. 2021 May 26;41(21):4686-4696.
doi: 10.1523/JNEUROSCI.2950-20.2021. Epub 2021 Apr 13.

Dissociating Perceptual Awareness and Postperceptual Processing: The P300 Is Not a Reliable Marker of Somatosensory Target Detection

Affiliations

Dissociating Perceptual Awareness and Postperceptual Processing: The P300 Is Not a Reliable Marker of Somatosensory Target Detection

Pia Schröder et al. J Neurosci. .

Abstract

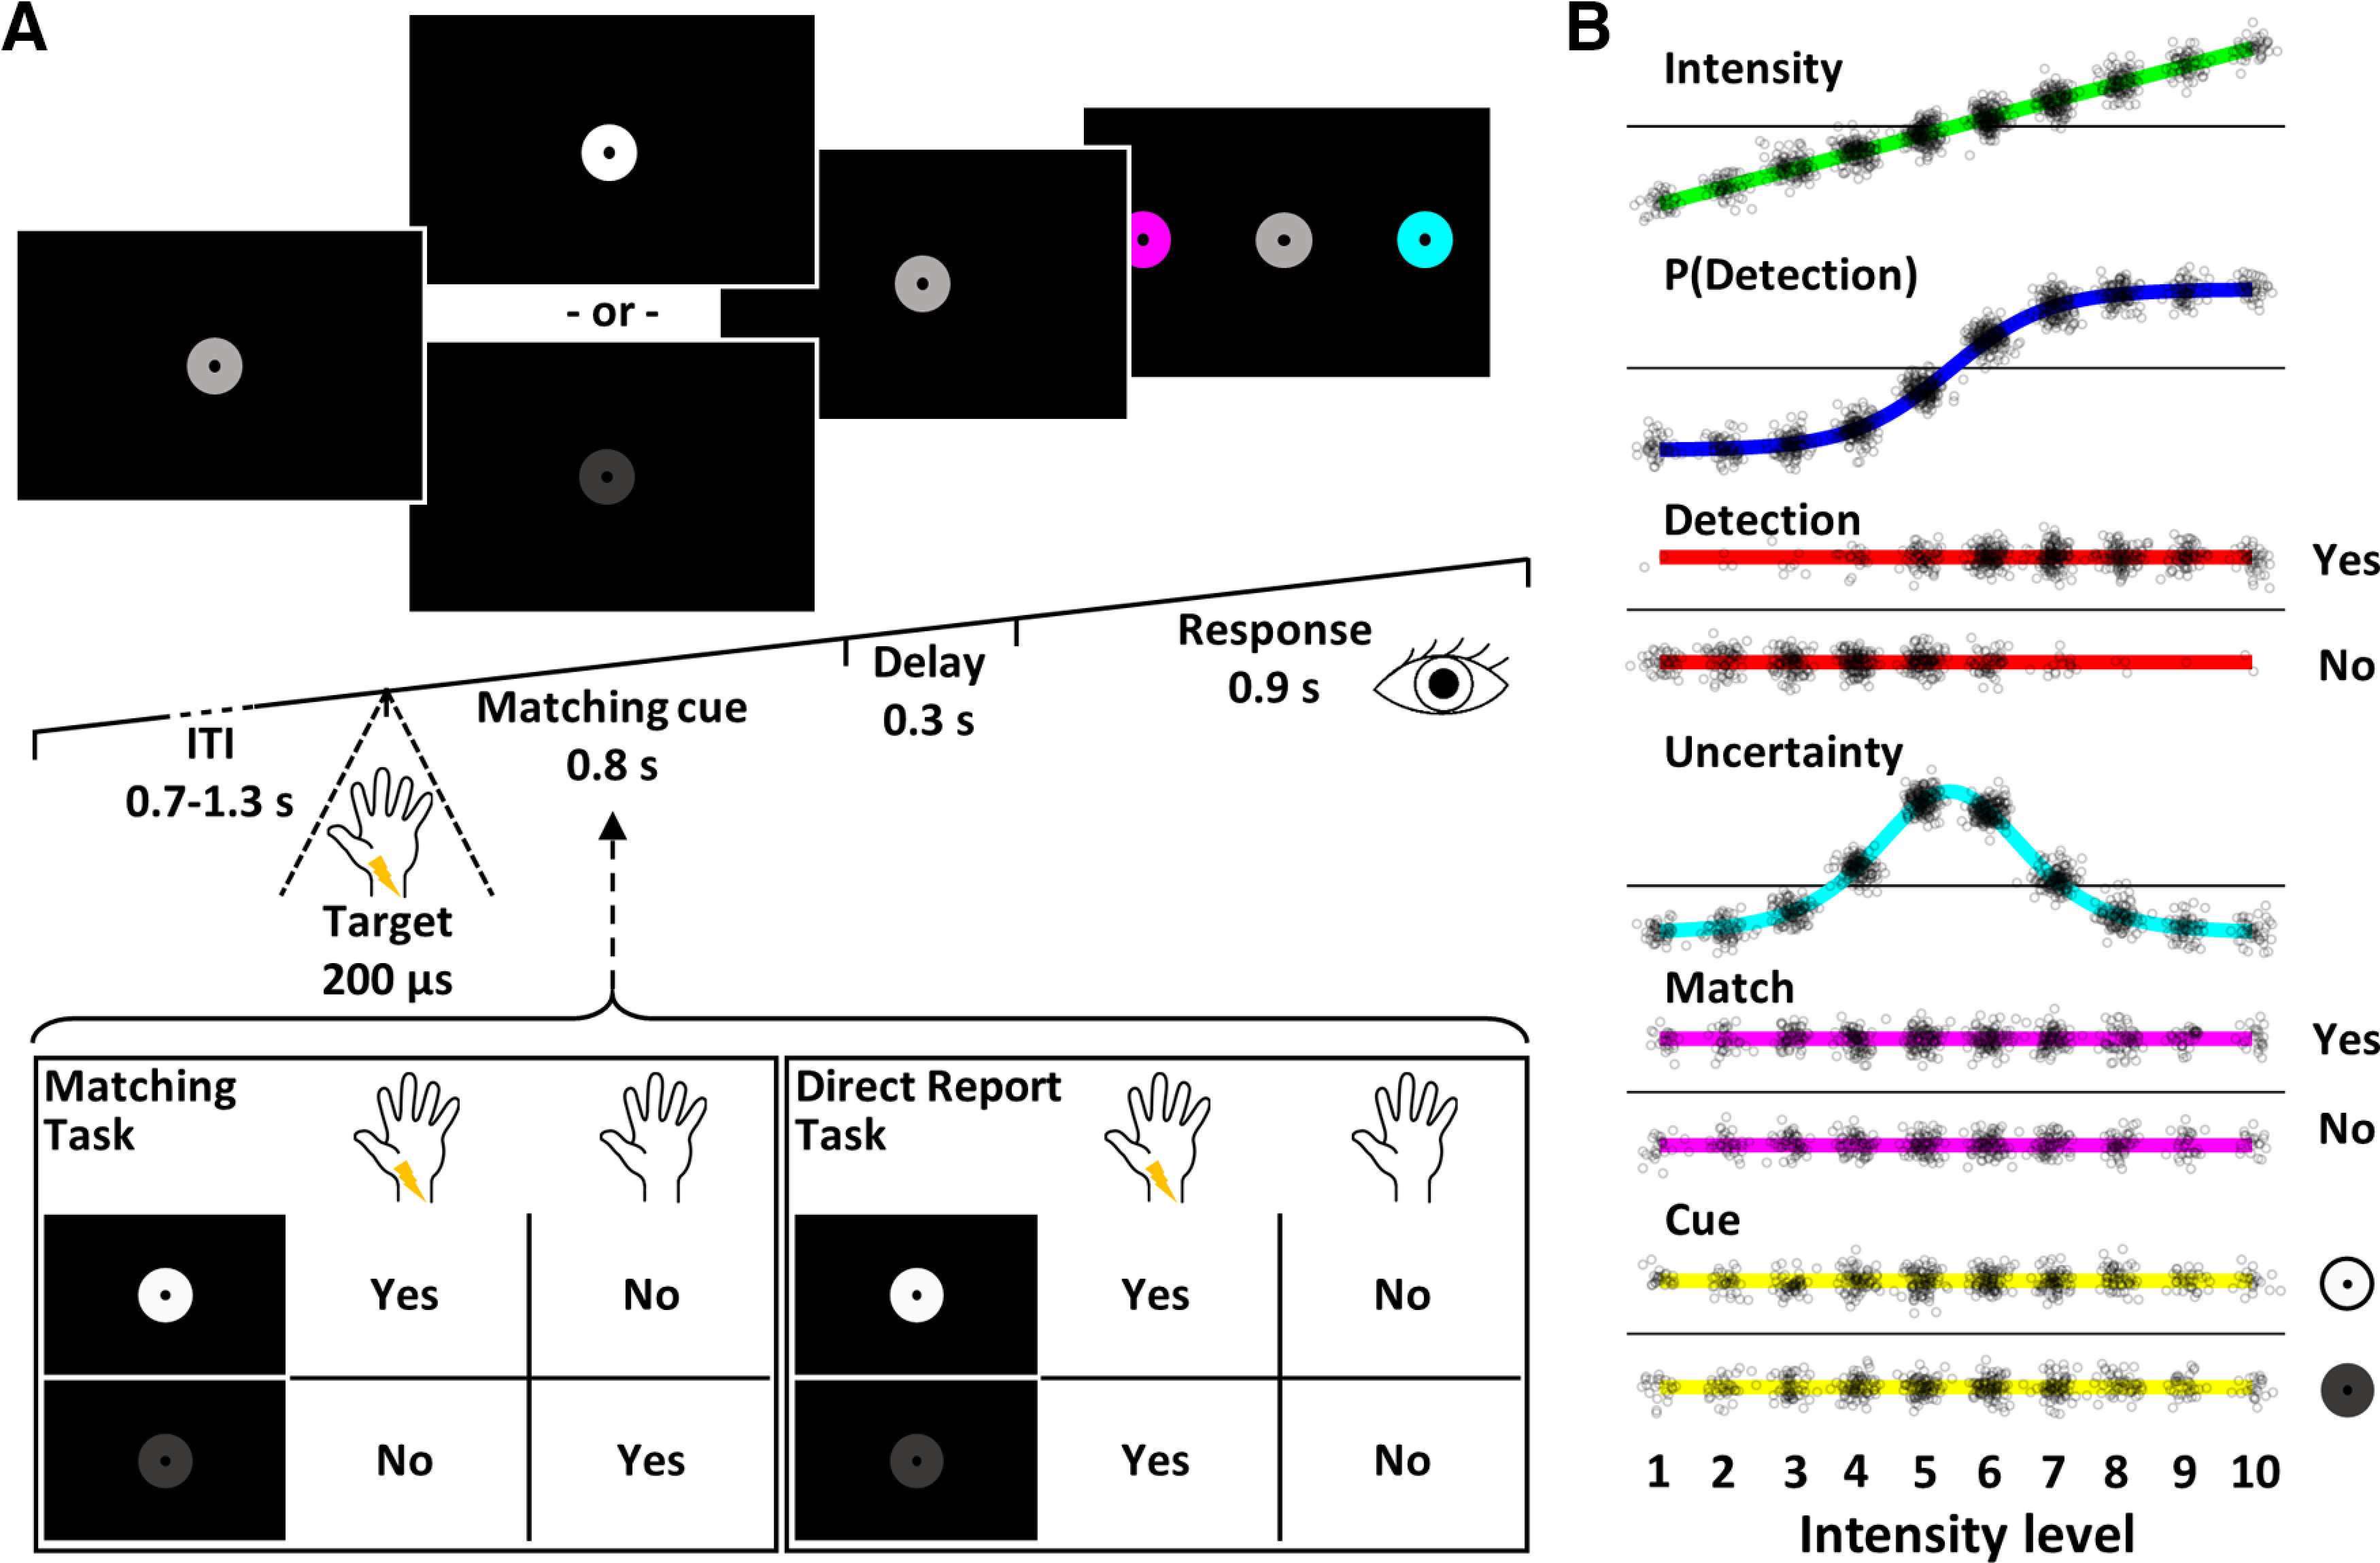
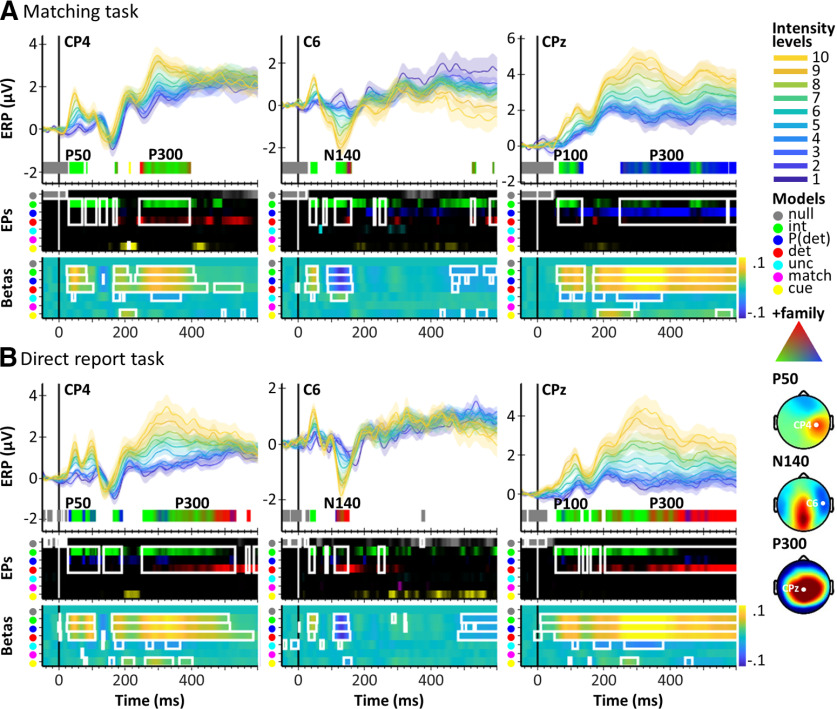
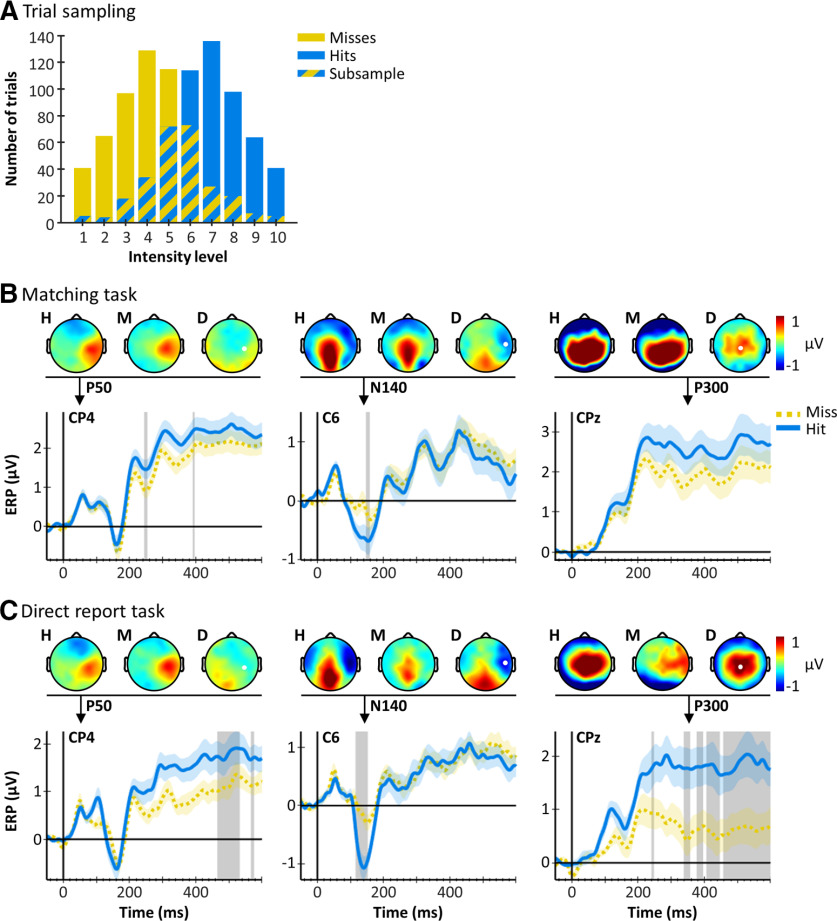
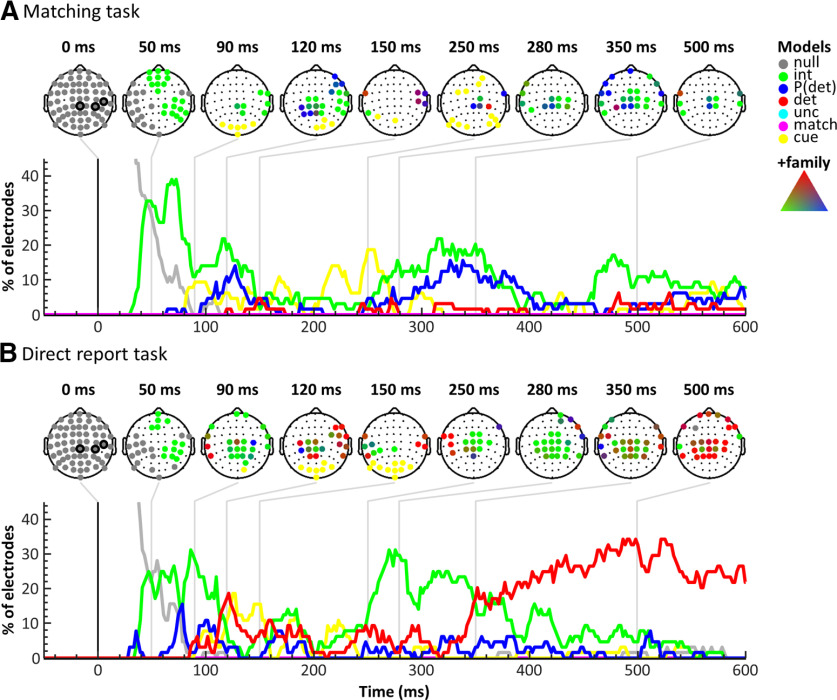
A central challenge in the study of conscious perception lies in dissociating the neural correlates of perceptual awareness from those reflecting its precursors and consequences. No-report paradigms have been instrumental in this endeavor, demonstrating that the event-related potential P300, recorded from the human scalp, reflects reports rather than awareness. However, these paradigms cannot probe the degree to which stimuli are consciously processed from trial to trial and, thus, leave open the possibility that the P300 is a genuine correlate of conscious access enabling reports. Here, instead of removing report requirements, we took the opposite approach and equated postperceptual task demands across conscious and unconscious trials by orthogonalizing target detection and overt reports in a somatosensory detection task. We used Bayesian model selection to track the transformation from physical to perceptual processing stages in the EEG data of 24 male and female participants and show that the early P50 component scaled with physical stimulus intensity, whereas the N140 component was the first correlate of target detection. The late P300 component was elicited for both perceived and unperceived stimuli and was not substantially modulated by target detection. This was in stark contrast to a control experiment using a classical direct report task, which replicated the P50 and N140 effects but additionally showed a strong effect of target detection in the P300 time range. Our results demonstrate the task dependence of the P300 in the somatosensory modality and show that late cortical potentials dissociate from perceptual awareness even when stimuli are always reported.SIGNIFICANCE STATEMENT The time it takes for sensory information to enter our conscious experience can be an indicator of the neural processing stages that lead to perceptual awareness. However, because many cognitive processes routinely correlate with perception, isolating those signals that uniquely reflect perceptual awareness is not a trivial task. Here, we show that late electroencephalography signals cease to correlate with somatosensory awareness when common task confounds are controlled. Importantly, by balancing report requirements instead of abolishing them, we show that the lack of late effects cannot be explained by a lack of conscious access. Instead, we propose that conscious access occurs earlier, at ∼150 ms, supporting the view that early activity in sensory cortices is a neural correlate of conscious perception.

Keywords: Bayesian model selection; P300; electroencephalography; perceptual awareness; somatosensory; target detection.


Figures

Figure 1.
Figure 1.
Experimental design. A, Trial design. Following a variable intertrial interval, participants received an electrical target pulse at 1 of 10 intensity levels, which they either detected or missed. At the same time, the fixation disk changed its brightness to serve as the visual matching cue, which signaled target presence (white) or target absence (dark gray). In the matching task, participants compared their somatosensory percept to the matching cue and decided whether the two modalities matched or not (left box). In the direct report task, participants ignored the identity of the matching cue and merely decided whether they had detected a target pulse or not (right box). After a brief delay, they reported their decision by making a saccade to one of two peripherally presented, color-coded response cues. The selected cue briefly increased in size, signaling that the response was logged, and the next trial began. B, Experimental regressors. EEG responses were modeled with seven different GLMs that were compared using BMS. Each experimental GLM contained an intercept regressor and one of six experimental regressors modeling stimulus intensity, detection probability, target detection (hit vs miss), expected uncertainty, matching reports (match vs mismatch), and matching cues (white vs dark gray). An additional null model contained the intercept regressor only. Small black circles represent individual trials of 1 participant. Please note that although the detection probability regressor is computed from the detection regressor, the two models differ in their behavior within intensity levels: for example, looking at the predictions for trials at intensity level 5, the detection probability model predicts the same activation level for all targets of that intensity level, regardless of whether they were detected or missed, whereas the detection model predicts categorically higher activity for detected than missed trials. Thus, the detection model assumes a nonlinear, all-or-none response for detected stimuli, whereas the detection probability model assumes a graded response. Further note the intensity-biased distribution of trials in the detection regressor, which leads to correlations between models and prohibits classical GLM analysis.
Figure 2.
Figure 2.
Psychometric functions in the matching task (A) and the direct report task (B). Black lines indicate the individual block-averaged psychometric functions of participants included in the final samples (matching task: n = 24; direct report task: n = 22). The psychometric curves are plotted as a function of intensity level, not intensity in mA, to normalize across participants. Red dashed lines indicate participants whose detection probabilities at minimum and maximum intensity levels fell outside the required margin of <10% and >90% (white background) and were thus excluded from the analyses. The red dotted line indicates 1 participant in the matching task that was excluded because of poor EEG data quality.
Figure 3.
Figure 3.
ERPs and BMS results for three electrodes of interest (CP4, C6, CPz, marked in grand-averaged Hit topographies on the right) in the matching task (A) and in the direct report task (B). For each electrode: Top, Stimulus-locked, grand-averaged ERPs (mean ± SE) for each intensity level (1-10). Below the ERPs, BMS results are plotted for time points of interest (EP>=99% and BF10beta >=3) as color bands representing the winning model families. For time points best modeled by the +family (intensity, P(detection), detection), the color represents an RGB value that is composed of the EPs of the three +family models (compare the RGB triangle: corners correspond to EP = 100%, signifying a clear winner of the model comparison within the +family, whereas intermixed colors represent similar EPs for the respective models). Corresponding peak +family model EPs are presented in Table 1. Middle, Unthresholded EP time courses for each model. Bottom, Time courses of group-averaged β estimates of each model's experimental regressor (warm colors represent positive β estimates; cold colors represent negative β estimates). White rectangles represent data segments that exceed the respective thresholds. The results suggest that the P50 was modulated by stimulus intensity in both tasks. The N140 showed a transition from stimulus intensity to target detection in the matching task and a pure effect of target detection in the direct report task. The P300 was strongly task-dependent, showing an effect of detection probability in the matching task and a transition from stimulus intensity to target detection in the direct report task.
Figure 4.
Figure 4.
Intensity-matched hit and miss ERPs. A, Trial distributions are shown for one exemplary participant. Lower-intensity levels resulted in more miss trials (yellow), whereas higher-intensity levels resulted in more hit trials (blue). To obtain intensity-matched subsamples of hit and miss trials, for each intensity level, we determined the number of trials obtained per condition and sampled as many trials from the condition with more trials as available for the condition with fewer trials. The subsampled trials (overlap) were then pooled across intensity levels to obtain a hit and a miss pool with identical intensity distributions. B, Hit and miss ERPs (mean ± SE) in the matching task and (C) in the direct report task. Topographies for hits (H), misses (M), and their difference (D) are displayed for time points of interest (indicated by black arrows). Gray shaded areas represent time points that were best explained by the detection model. The P50 was not modulated by target detection in either task, whereas the N140 exhibits larger amplitudes for hits compared with misses in both tasks. The P300 shows a large difference between hits and misses in the direct report task but not in the matching task.
Figure 5.
Figure 5.
BMS results across electrodes in the matching task (A) and the direct report task (B). For each task, scalp topographies for time points of interest (top) and model time courses across electrodes (bottom) are displayed. The scalp topographies indicate winning models in electrodes surpassing the threshold criteria using colors as in Figure 3. The circled electrodes at 0 ms represent electrodes CP4, C6, and CPz. Model time courses are plotted as the proportion of electrodes showing above-threshold effects over time. The results suggest a striking reduction of target detection effects (red) in the matching task compared with the direct report task, especially in late time windows >350 ms.

Similar articles

Cited by

References

    1. Al E, Iliopoulos F, Forschack N, Nierhaus T, Grund M, Motyka P, Gaebler M, Nikulin VV, Villringer A (2020) Heart-brain interactions shape somatosensory perception and evoked potentials. Proc Natl Acad Sci USA 117:10575–10584. 10.1073/pnas.1915629117 - DOI - PMC - PubMed
    1. Aru J, Bachmann T, Singer W, Melloni L (2012) Distilling the neural correlates of consciousness. Neurosci Biobehav Rev 36:737–746. 10.1016/j.neubiorev.2011.12.003 - DOI - PubMed
    1. Auksztulewicz R, Blankenburg F (2013) Subjective rating of weak tactile stimuli is parametrically encoded in event-related potentials. J Neurosci 33:11878–11887. 10.1523/JNEUROSCI.4243-12.2013 - DOI - PMC - PubMed
    1. Auksztulewicz R, Spitzer B, Blankenburg F (2012) Recurrent neural processing and somatosensory awareness. J Neurosci 32:799–805. 10.1523/JNEUROSCI.3974-11.2012 - DOI - PMC - PubMed
    1. Boncompte G, Cosmelli D (2018) Neural correlates of conscious motion perception. Front Hum Neurosci 12:355. - PMC - PubMed

LinkOut - more resources