. 2021 Apr 13;12(2):e00588-21.
doi: 10.1128/mBio.00588-21.

An Infection-Tolerant Mammalian Reservoir for Several Zoonotic Agents Broadly Counters the Inflammatory Effects of Endotoxin

Affiliations

An Infection-Tolerant Mammalian Reservoir for Several Zoonotic Agents Broadly Counters the Inflammatory Effects of Endotoxin

Gabriela Balderrama-Gutierrez et al. mBio. .

Abstract

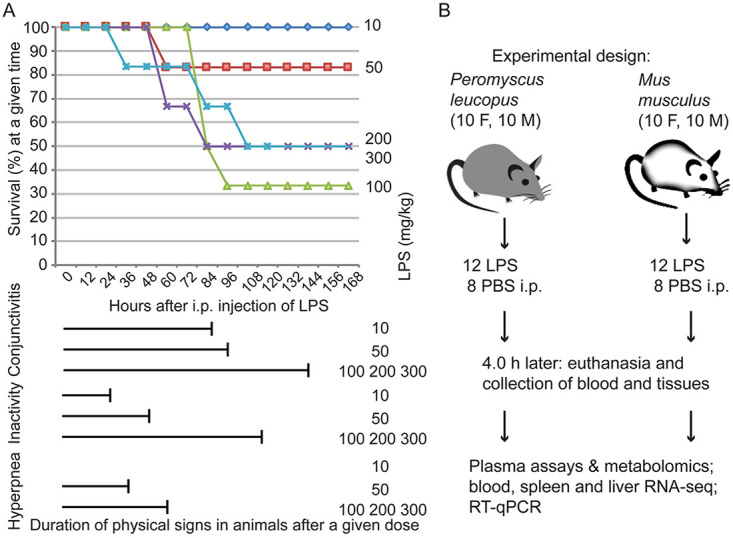
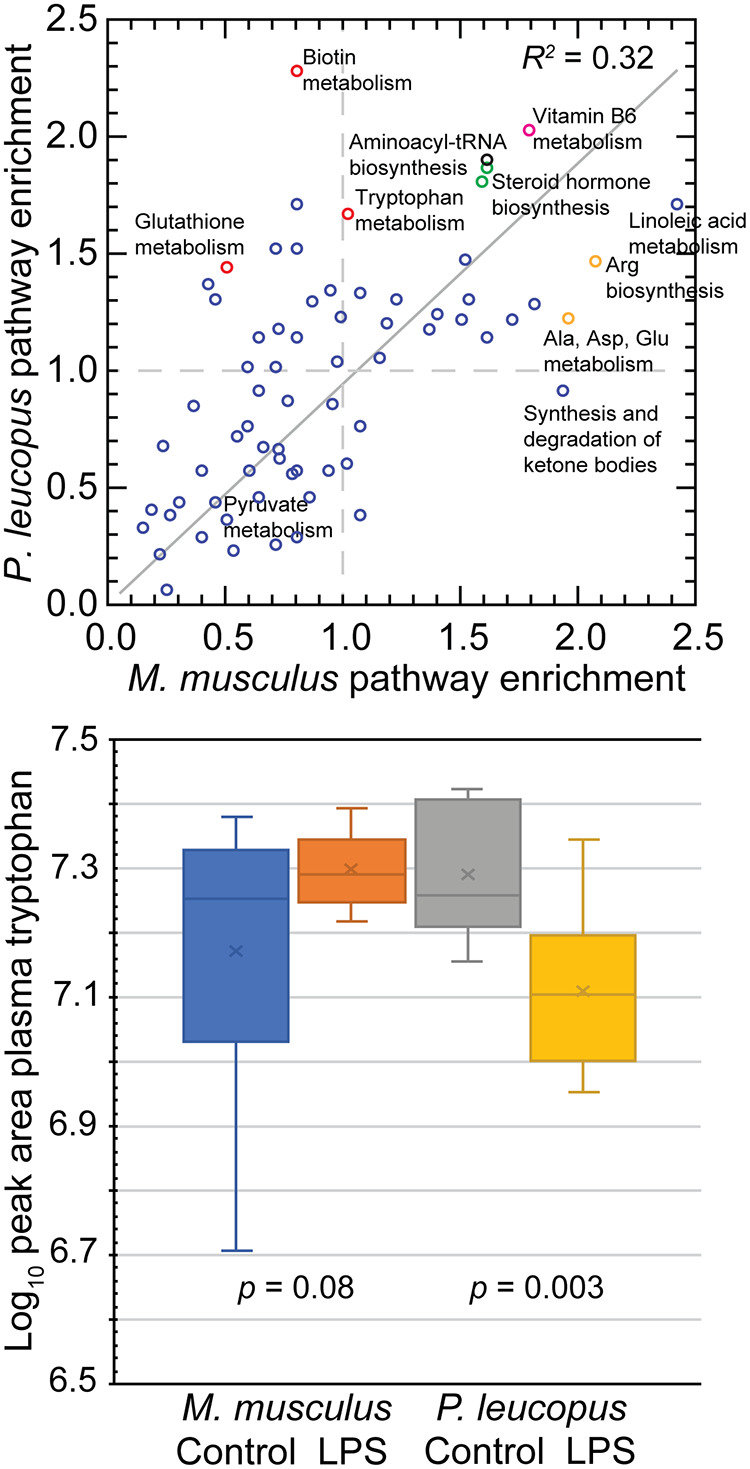
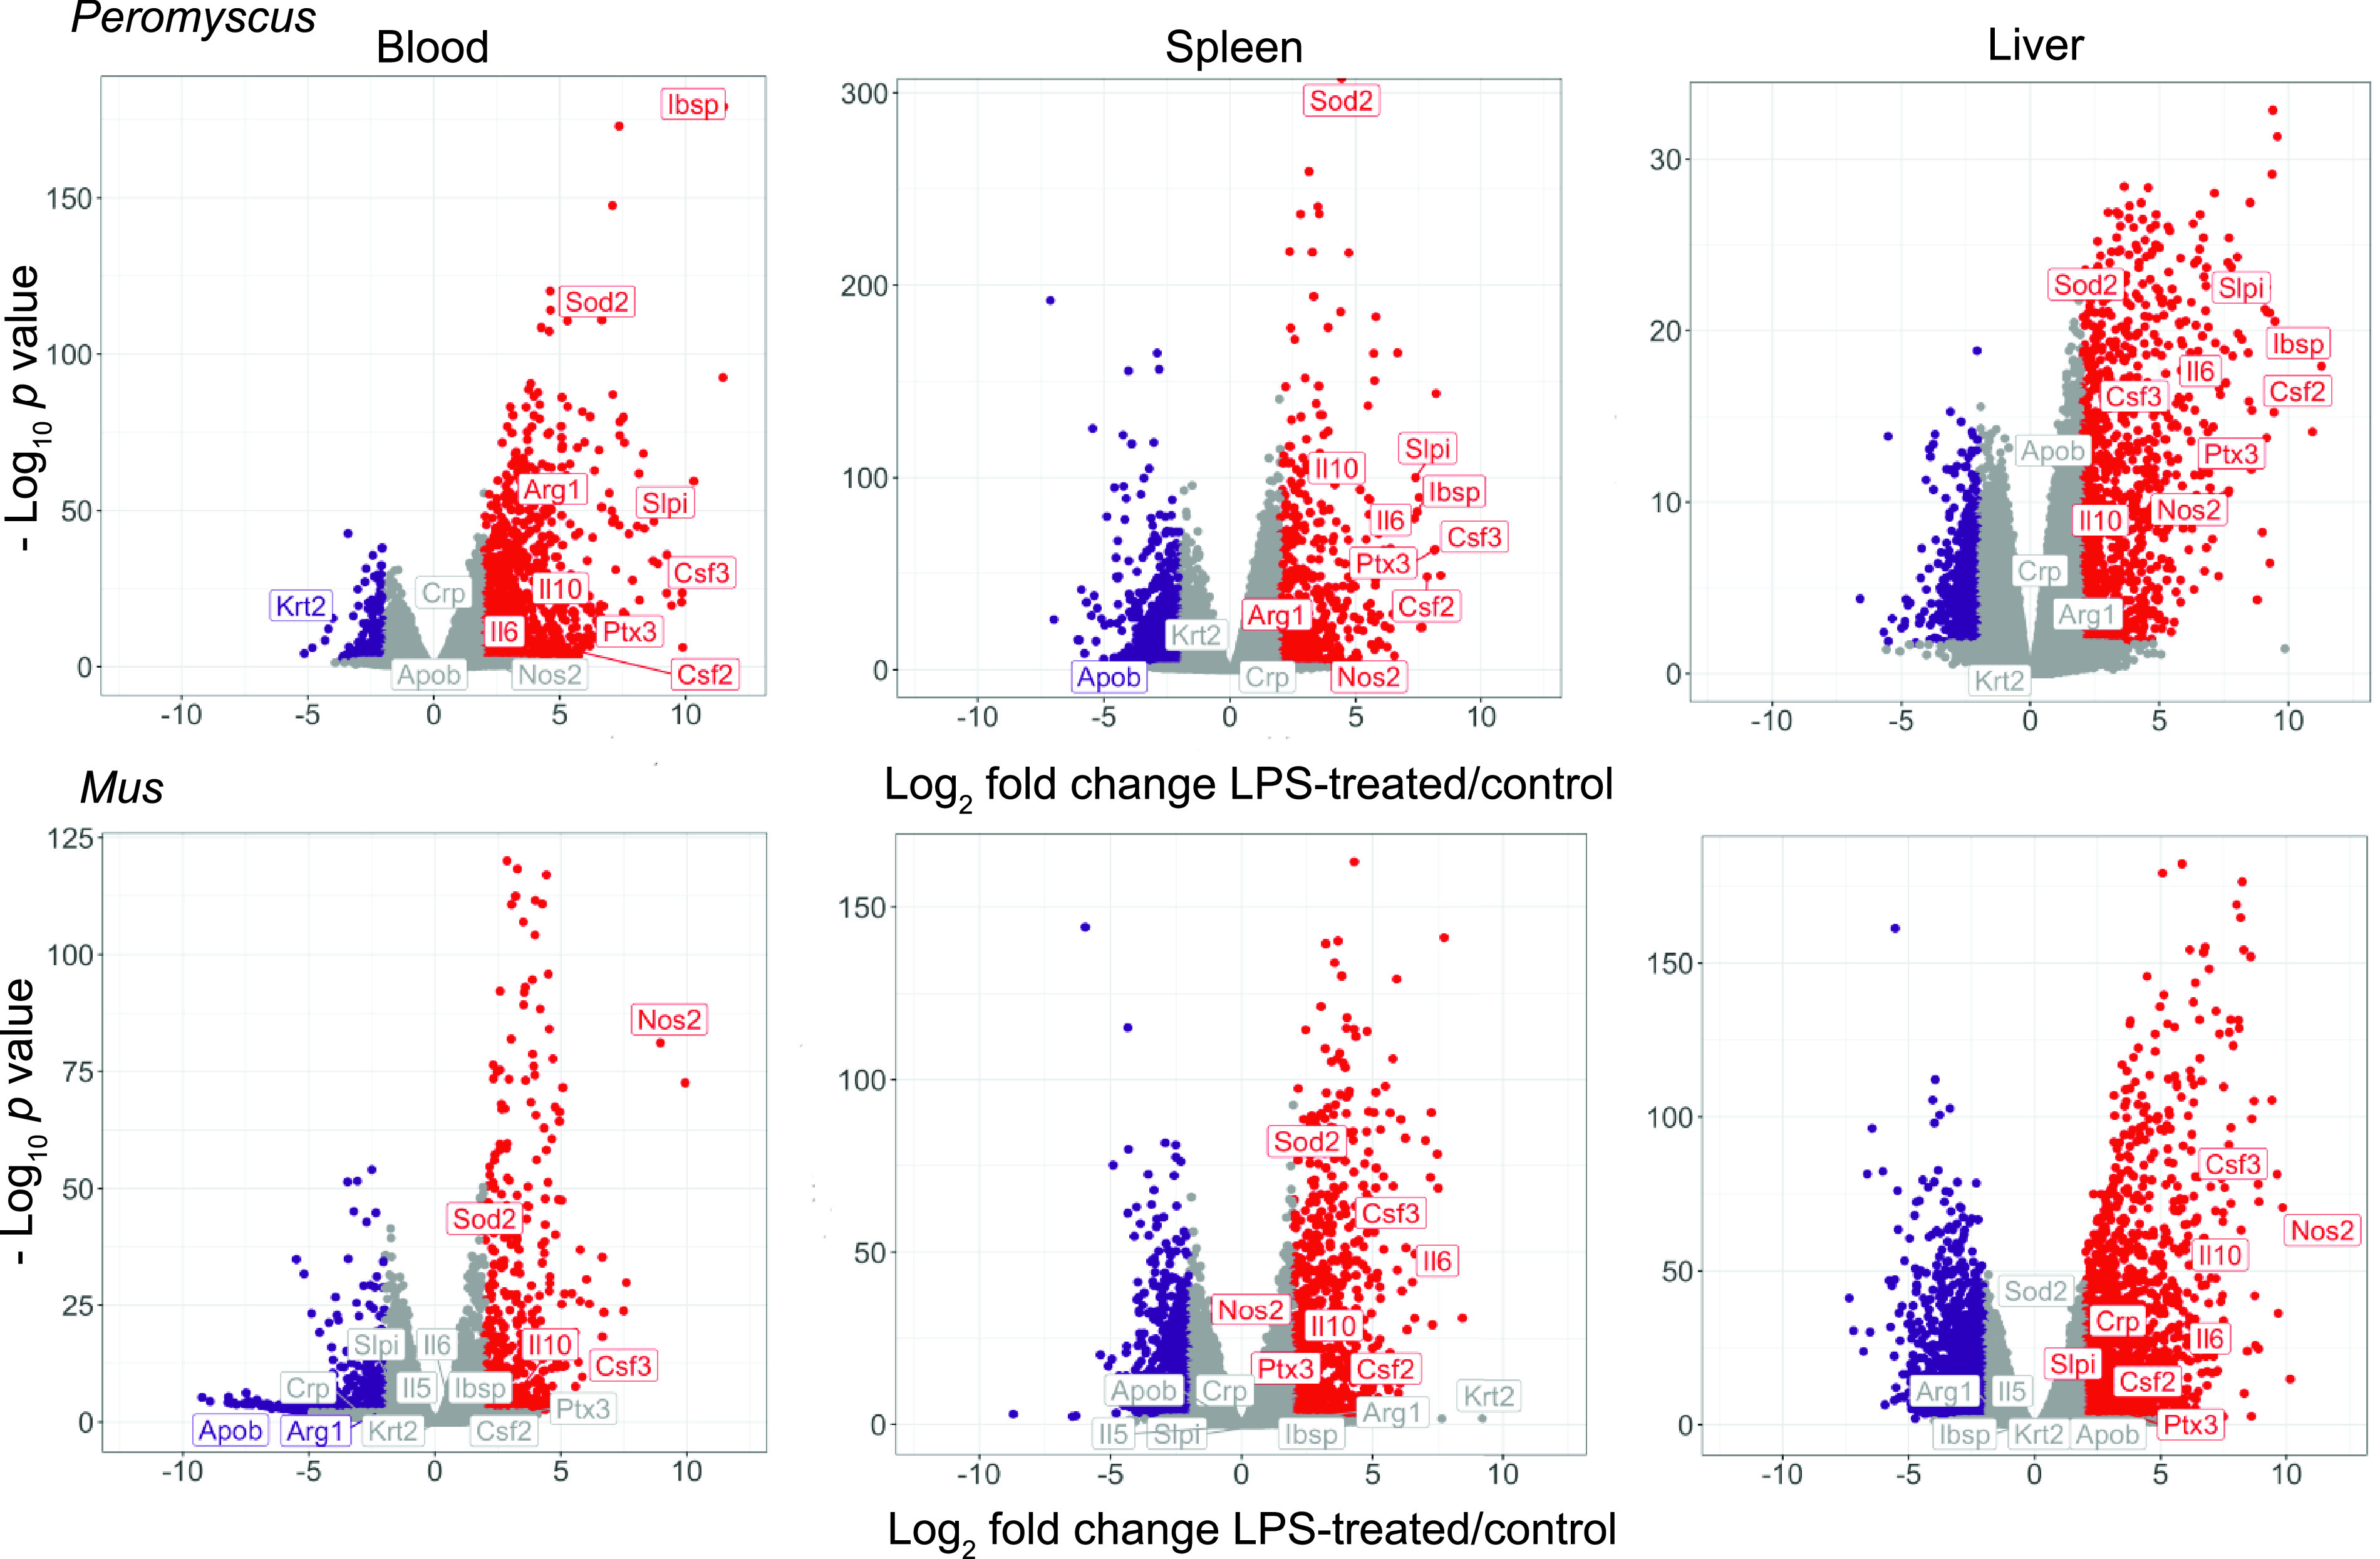
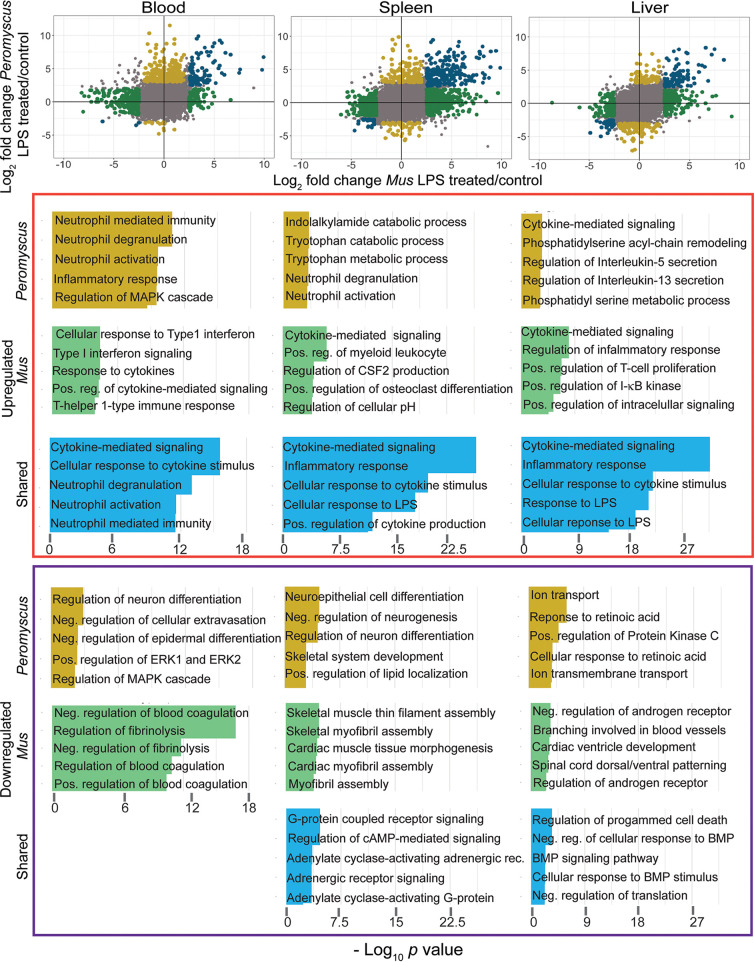
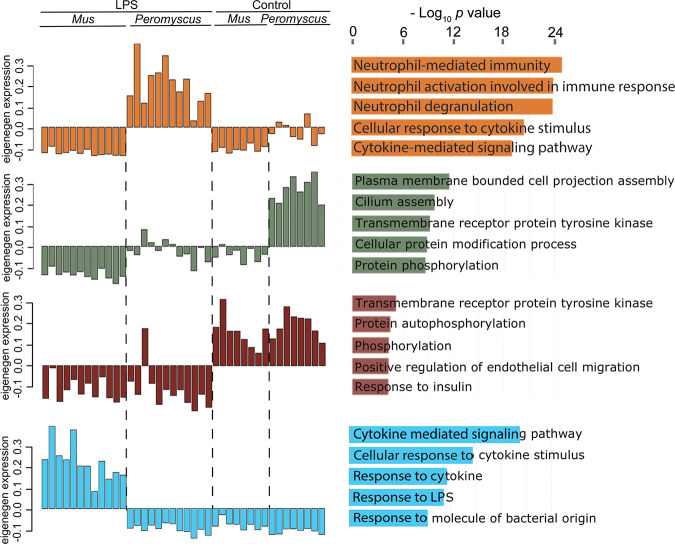
Animals that are competent reservoirs of zoonotic pathogens commonly suffer little morbidity from the infections. To investigate mechanisms of this tolerance of infection, we used single-dose lipopolysaccharide (LPS) as an experimental model of inflammation and compared the responses of two rodents: Peromyscus leucopus, the white-footed deermouse and reservoir for the agents of Lyme disease and other zoonoses, and the house mouse Mus musculus Four hours after injection with LPS or saline, blood, spleen, and liver samples were collected and subjected to transcriptome sequencing (RNA-seq), metabolomics, and specific reverse transcriptase quantitative PCR (RT-qPCR). Differential expression analysis was at the gene, pathway, and network levels. LPS-treated deermice showed signs of sickness similar to those of exposed mice and had similar increases in corticosterone levels and expression of interleukin 6 (IL-6), tumor necrosis factor, IL-1β, and C-reactive protein. By network analysis, the M. musculus response to LPS was characterized as cytokine associated, while the P. leucopus response was dominated by neutrophil activity terms. In addition, dichotomies in the expression levels of arginase 1 and nitric oxide synthase 2 and of IL-10 and IL-12 were consistent with type M1 macrophage responses in mice and type M2 responses in deermice. Analysis of metabolites in plasma and RNA in organs revealed species differences in tryptophan metabolism. Two genes in particular signified the different phenotypes of deermice and mice: the Slpi and Ibsp genes. Key RNA-seq findings for P. leucopus were replicated in older animals, in a systemic bacterial infection, and with cultivated fibroblasts. The findings indicate that P. leucopus possesses several adaptive traits to moderate inflammation in its balancing of infection resistance and tolerance.IMPORTANCE Animals that are natural carriers of pathogens that cause human diseases commonly manifest little or no sickness as a consequence of infection. Examples include the deermouse, Peromyscus leucopus, which is a reservoir for Lyme disease and several other disease agents in North America, and some types of bats, which are carriers of viruses with pathogenicity for humans. Mechanisms of this phenomenon of infection tolerance and entailed trade-off costs are poorly understood. Using a single injection of lipopolysaccharide (LPS) endotoxin as a proxy for infection, we found that deermice differed from the mouse (Mus musculus) in responses to LPS in several diverse pathways, including innate immunity, oxidative stress, and metabolism. Features distinguishing the deermice cumulatively would moderate downstream ill effects of LPS. Insights gained from the P. leucopus model in the laboratory have implications for studying infection tolerance in other important reservoir species, including bats and other types of wildlife.

Keywords: Borrelia; Lyme disease; Mus musculus; Peromyscus leucopus; RNA-seq; innate immunity; lipopolysaccharide; metabolomics.


Figures

FIG 1
FIG 1
Studies of lipopolysaccharide (LPS) effects on Peromyscus leucopus deermice and experimental design. (A) Dose response of P. leucopus to LPS. Groups of 6 adult animals (3 females and 3 males) received different intraperitoneal (i.p.) doses on a milligram/kilogram of body weight basis of Escherichia coli LPS at time zero and then monitored for physical signs of sickness (conjunctivitis, inactivity, and hyperpnea) and survival over the succeeding 7 days (168 h). The survival curves by dose are indicated by text to the right and by colors: dark blue (10 mg/kg LPS), red (50 mg/kg), light green (100 mg/kg), blue green (200 mg/kg), and purple (300 mg/kg). The x axis scale and label apply to the durations of physical signs as well as to the survival graph. (B) Experimental design of comparative study of short-term effects of LPS on P. leucopus and Mus musculus. Animals received 10 mg LPS in saline/kg body weight or saline alone. F, female; M, male.
FIG 2
FIG 2
Untargeted metabolomics of plasma of P. leucopus and M. musculus animals with or without LPS treatment 4 h prior. (Top) Scatterplot of pathway enrichments in LPS-treated P. leucopus (y axis) versus those in LPS-treated M. musculus (x axis). An enrichment value of 1.0 means that there is no difference in number of compounds in a given pathway between treated and untreated conditions for a species. Data, including identified KEGG terms, are provided in the Dryad repository (https://doi.org/10.7280/D1R70J). Selected pathways are labeled. The color of the symbols indicate the following findings for false discovery rate (FDR) P values of <0.05: green, both species; red, P. leucopus; and orange, M. musculus. The coefficient of determination (R2) shown is for an unspecified intercept. For consistency with the dashed lines indicating enrichment values of 1.0, the regression line for an intercept of 0.0 is shown. (Bottom) Box-plots of log-transformed plasma tryptophan levels estimated as peak areas in LPS-treated and untreated animals of each species. Two-tailed t test P values between the two conditions for each species are shown. Data for tryptophan and several of its metabolites are given in Table S1.
FIG 3
FIG 3
Species- and tissue-specific responses to LPS. Independent differential gene expression analysis of RNA-seq data were performed for blood, spleen, and liver tissues of P. leucopus and M. musculus collected 4 h after injection with LPS or buffer alone as a control. These are represented as volcano plots with range-adjusted scales for the log2-transformed fold changes on x axes and log10-transformed FDR P values on y axes. Colors of symbols denote the following: red, upregulated gene with an absolute fold change of >4.0 and a P value of <0.05; purple, downregulated gene with an absolute fold change of >4.0 and a P value of <0.05; and gray, all others. Numbers at the top left and right corners in each plot represent numbers of down- and upregulated genes, respectively. Numerical values for each gene in the 6 data sets are provided at the Dryad repository (https://doi.org/10.7280/D1VX0C).
FIG 4
FIG 4
Comparison of P. leucopus and M. musculus animals in their responses to LPS by RNA-seq and categorization of DEGs by gene ontology (GO) term enrichment. In the three scatterplots for blood, spleen, and liver tissues at the top of the figure, log2 values for the fold change of P. leucopus are plotted against corresponding values for M. musculus for each gene in the data set. DEGs specific for P. leucopus are indicated by gold symbols, while DEGs specific for M. musculus are green. Genes shared between species among the DEGs are in blue. Gray is for all others. P. leucopus-specific, M. musculus-specific, and shared upregulated genes are in the upper half, right half, or upper right quadrant, respectively, of the plot. GO term enrichment was performed for each group of genes, separating upregulated and downregulated genes for each one of the tissues, accordingly. The colors in the horizontal bar graphs correspond with the colors indicated above. The genes that constitute each of the listed GO terms in the bottom part of the figure are given in Table S3. Pos., positive; reg., regulation; Neg., negative; MAPK, mitogen-activated protein kinase; cAMP, cyclic AMP; rec., receptor.
FIG 5
FIG 5
Four selected Eigengene modules by network analysis of differential responses of P. leucopus or M. musculus animals to LPS. The different modules are distinguished by the color of the hexadecimal scheme: dark orange 2 for upregulated in LPS-treated P. leucopus, dark sea green 4 for comparatively higher expression in untreated P. leucopus than in the other three groups, brown 4 for downregulated in both species after LPS treatment, and light blue for upregulated in LPS-treated M. musculus. The top 5 GO terms by adjusted P value are shown for each module. The DEGs constituting each of the GO term sets from this analysis are listed in Table S4 along with P values and odds ratios. The other 20 modules from this analysis are available at the Dryad repository (https://doi.org/10.7280/D1B38G).
FIG 6
FIG 6
Correlations of pairs of selected genes of P. leucopus and M. musculus from the RNA-seq analysis of Table S3 and Fig. S2. The 9 scatterplots are log10 values of normalized unique reads of one coding sequence against another for each of the four groups: control M. musculus (MC), LPS-treated M. musculus (ML), control P. leucopus (PC), and LPS-treated P. leucopus (PL). Each group is represented by a different symbol.
FIG 7
FIG 7
Assessment of diversity among individual animals by species in transcriptional responses to LPS for 17 genes. Pairwise coefficients of determination (R2) were calculated for the 66 intraspecies pairs for LPS-treated P. leucopus animals, the 66 intraspecies pairs for LPS-treated M. musculus animals, and the 144 interspecies pairs for all LPS-treated animals. Data were drawn from selective transcripts from RNA-seq for the spleen (Table S5). The top panel is a frequency distribution of R2 values for all pairwise determinations. The bottom panel shows just the distributions of intraspecies pairwise determinations.
FIG 8
FIG 8
Comparison of DEGs of RNA-seq of P. leucopus deermice treated with LPS and P. leucopus animals systemically infected with the bacterial agent Borrelia hermsii. There were 12 LPS-treated animals with 8 controls and 5 infected animals with 3 controls (Table S7). (A) Venn diagram of numbers of DEGs in each experiment and the overlap between them (B) scatterplot of log2-transformed fold changes between study and control conditions for the infection experiment (y axis) versus the short-term LPS experiment (x axis). Selected genes are indicated with a label adjacent to a red symbol for the data point.
FIG 9
FIG 9
Volcano plot of RNA-seq results for pairs of P. leucopus fibroblast cultures with or without exposure to LPS. Fold changes for 543 genes are given on the x axis, and false discovery rate P values are given on the y axis. For conciseness, the upper limit for the –log10 values for this graph was 13.5. The exact or approximate locations of selected differentially expressed genes are shown. Numerical values for each gene in the data set are provided in the Dryad repository (https://doi.org/10.7280/D1MD69).

References

    1. Barbour AG. 2017. Infection resistance and tolerance in Peromyscus spp., natural reservoirs of microbes that are virulent for humans. Semin Cell Dev Biol 61:115–122. doi: 10.1016/j.semcdb.2016.07.002. - DOI - PMC - PubMed
    1. Paules CI, Marston HD, Bloom ME, Fauci AS. 2018. Tickborne diseases—confronting a growing threat. N Engl J Med 379:701–703. doi: 10.1056/NEJMp1807870. - DOI - PubMed
    1. Hall ER. 1981. The mammals of North America, 2nd ed, vol 2. John Wiley and Sons, New York, NY.
    1. Lackey JA, Huckaby DG, Ormiston BG. 1985. Peromyscus leucopus. Mamm Species 1985:1–10. doi: 10.2307/3503904. - DOI
    1. Mather TN, Wilson ML, Moore SI, Ribeiro JM, Spielman A. 1989. Comparing the relative potential of rodents as reservoirs of the Lyme disease spirochete (Borrelia burgdorferi). Am J Epidemiol 130:143–150. doi: 10.1093/oxfordjournals.aje.a115306. - DOI - PubMed

Publication types

MeSH terms