. 2021 Apr 13;14(678):eabe4509.
doi: 10.1126/scisignal.abe4509.

mTORC2 controls the activity of PKC and Akt by phosphorylating a conserved TOR interaction motif

Affiliations

mTORC2 controls the activity of PKC and Akt by phosphorylating a conserved TOR interaction motif

Timothy R Baffi et al. Sci Signal. .

Abstract

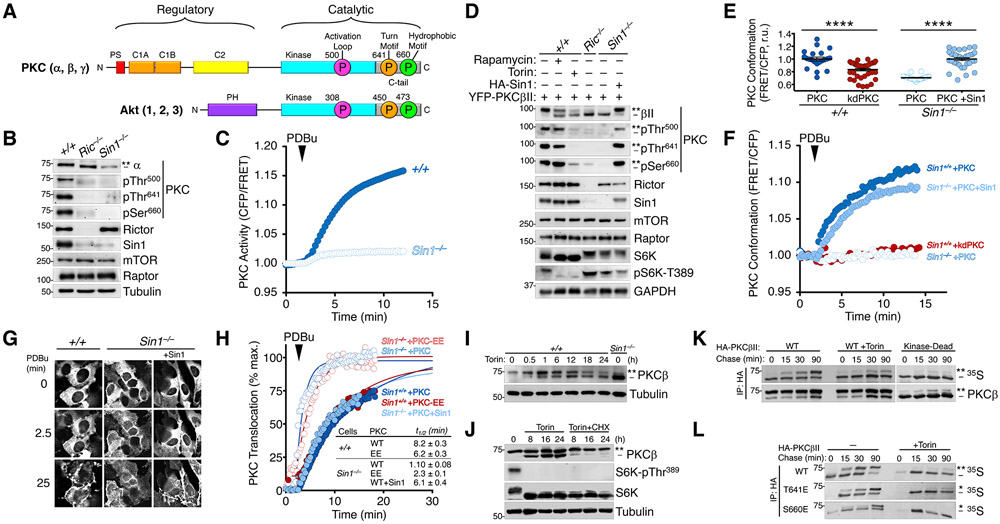
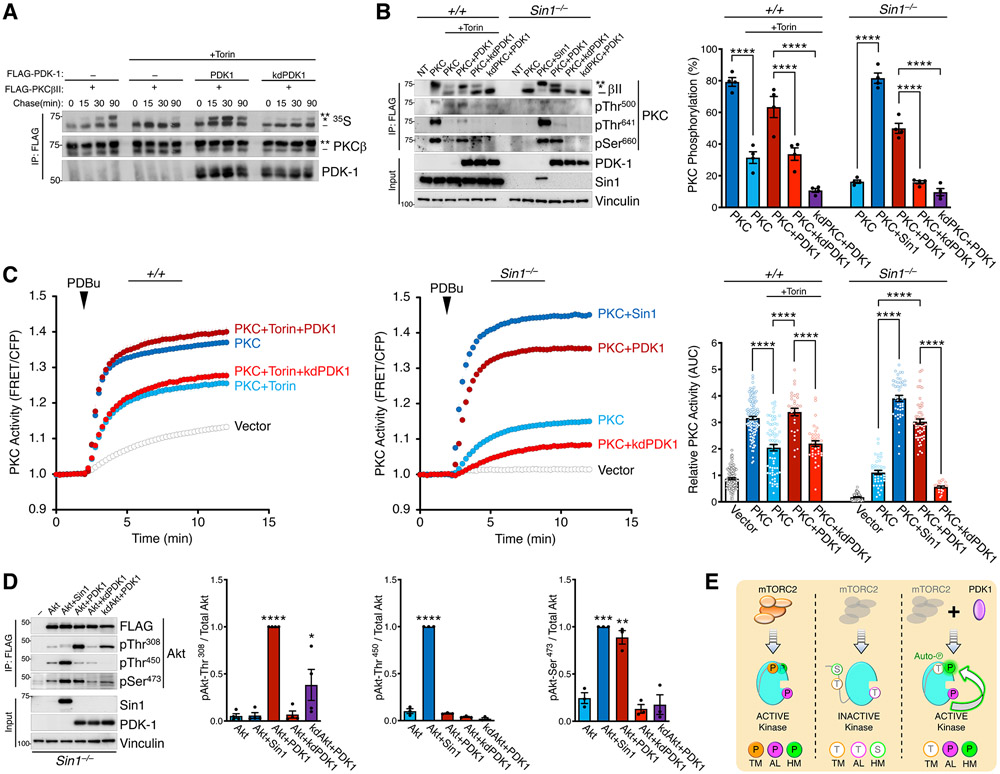
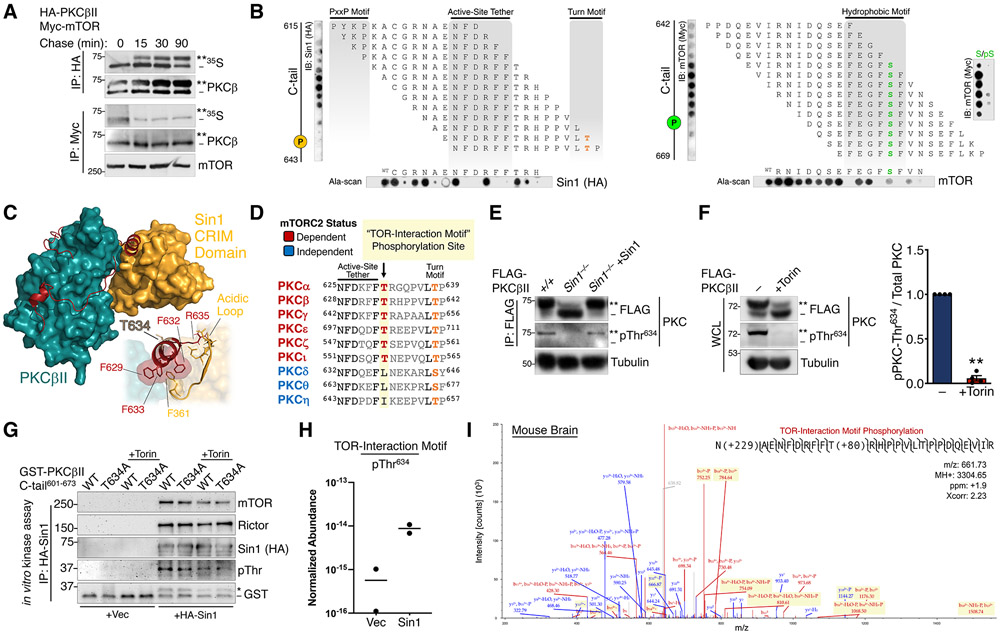
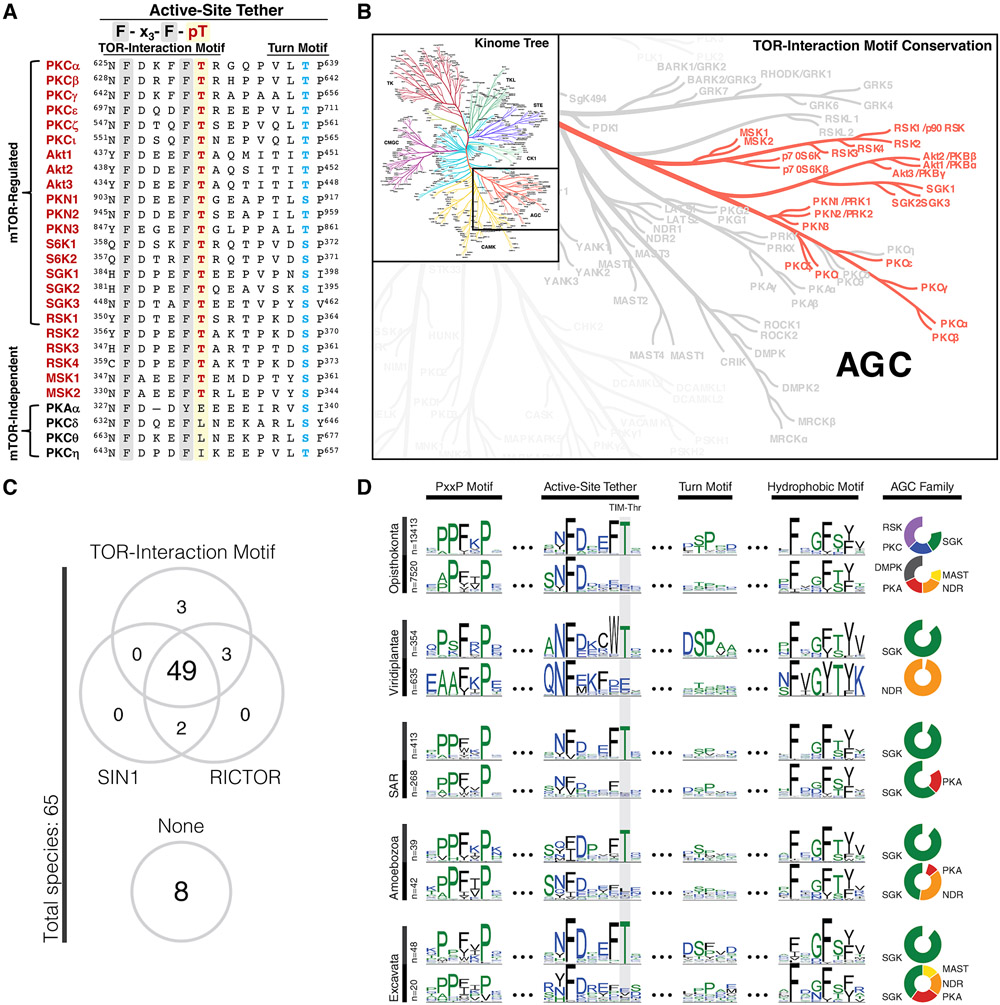
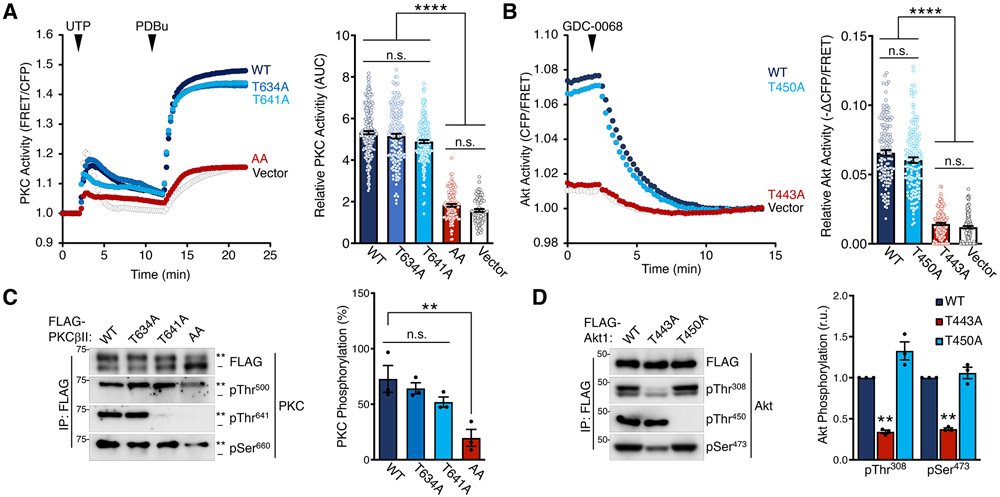
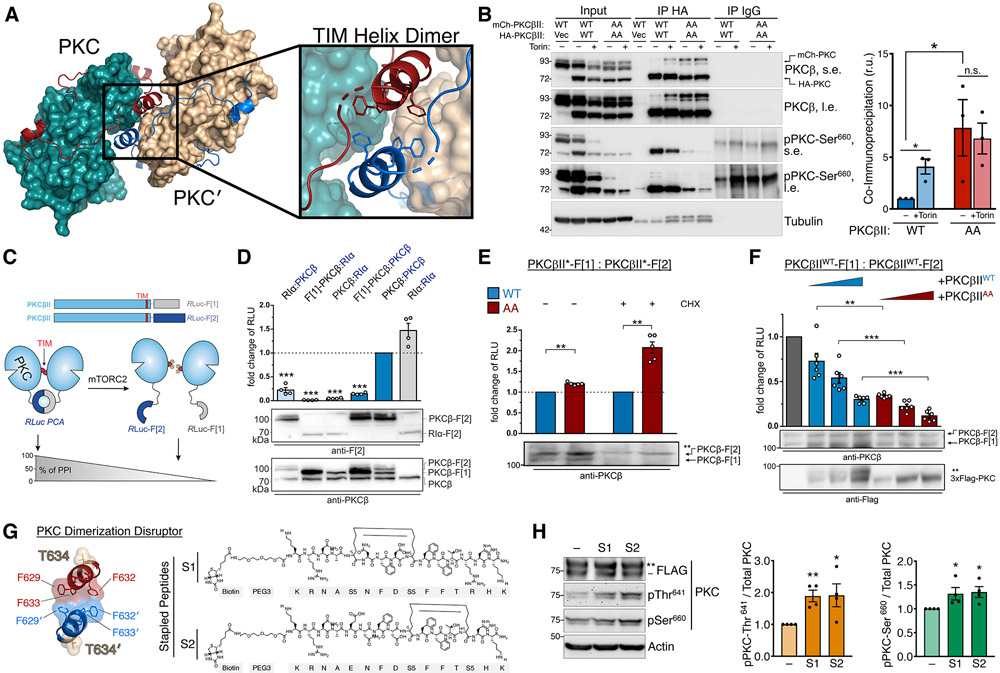
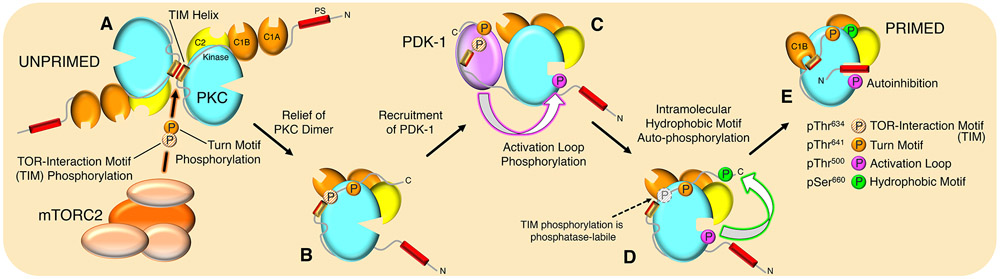
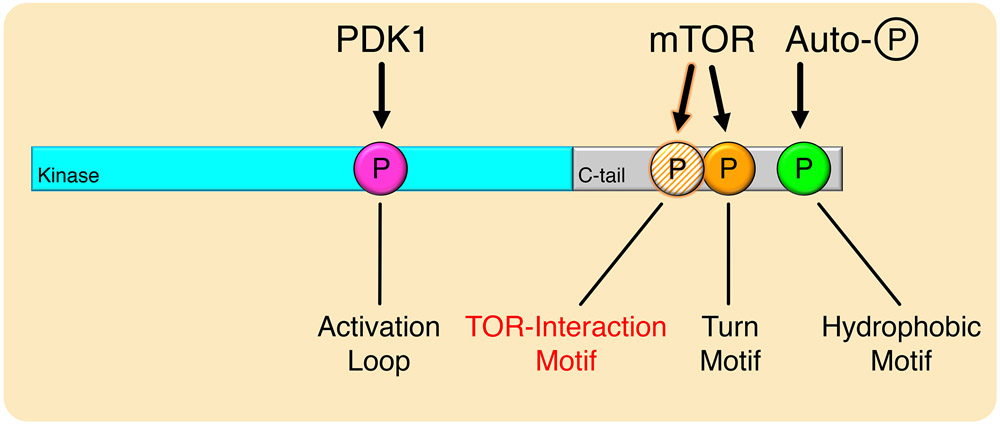
The complex mTORC2 is accepted to be the kinase that controls the phosphorylation of the hydrophobic motif, a key regulatory switch for AGC kinases, although whether mTOR directly phosphorylates this motif remains controversial. Here, we identified an mTOR-mediated phosphorylation site that we termed the TOR interaction motif (TIM; F-x3-F-pT), which controls the phosphorylation of the hydrophobic motif of PKC and Akt and the activity of these kinases. The TIM is invariant in mTORC2-dependent AGC kinases, is evolutionarily conserved, and coevolved with mTORC2 components. Mutation of this motif in Akt1 and PKCβII abolished cellular kinase activity by impairing activation loop and hydrophobic motif phosphorylation. mTORC2 directly phosphorylated the PKC TIM in vitro, and this phosphorylation event was detected in mouse brain. Overexpression of PDK1 in mTORC2-deficient cells rescued hydrophobic motif phosphorylation of PKC and Akt by a mechanism dependent on their intrinsic catalytic activity, revealing that mTORC2 facilitates the PDK1 phosphorylation step, which, in turn, enables autophosphorylation. Structural analysis revealed that PKC homodimerization is driven by a TIM-containing helix, and biophysical proximity assays showed that newly synthesized, unphosphorylated PKC dimerizes in cells. Furthermore, disruption of the dimer interface by stapled peptides promoted hydrophobic motif phosphorylation. Our data support a model in which mTORC2 relieves nascent PKC dimerization through TIM phosphorylation, recruiting PDK1 to phosphorylate the activation loop and triggering intramolecular hydrophobic motif autophosphorylation. Identification of TIM phosphorylation and its role in the regulation of PKC provides the basis for AGC kinase regulation by mTORC2.


Figures

Fig. 1.
Fig. 1.. Defect in PKC Maturation Upon Loss of mTORC2.
(A) Schematic of conventional PKC (cPKC) and Akt domain structures. cPKCs (α, β, γ) have an autoinhibitory pseudosubstrate (PS, red), tandem diacylglycerol sensing C1 domains (orange), and a Ca2+-dependent plasma membrane sensing C2 domain (yellow) in their N-terminal regulatory moiety and a kinase domain (cyan) and C-terminal tail (C-tail, grey) in the catalytic moiety. Akt has a PIP3-sensing PH domain and and a kinase domain (cyan) and C-terminal tail (C-tail, grey) in the catalytic moiety. Both kinases have three conserved phosphorylations at the activation loop (magenta) of the kinase domain and the turn motif (orange) and hydrophobic motif (green) in the C-tail, indicated with circles (PKCβII and Akt1 numbering). For PKC, these phosphorylations are constitutive whereas for Akt only the turn motif is constitutive, with the activation loop and hydrophobic motif phosphorylated in an agonist-dependent manner. The C-tail sites are mTORC2-sensitive. (B) Western blot of Triton-solubilized lysates from WT (+/+), Rictor KO (Ric−/−), or Sin1 KO (Sin1−/−) MEFs probed with the indicated total and phospho-specific antibodies. The double asterisk (**) denotes the position of mature, fully-phosphorylated PKC and the dash (−) indicates the position of unphosphorylated PKC. Note the activation loop does not cause a mobility shift and is modified in C-terminally phosphorylated species. Blots are representative of three independent experiments. (C) PKC activity in WT (+/+) or Sin1 KO (Sin1−/−) cells expressing the PKC activity reporter, CKAR, and treated with PDBu (200 nM) to maximally activate PKC. Data represent the normalized FRET ratio changes (mean ± SEM) from three independent experiments. (D) Western blot of Triton-solubilized lysates from WT (+/+), Rictor KO (Ric−/−), or Sin1 KO (Sin1−/−) MEFs, expressing YFP-PKCβII and HA-Sin1, treated with Rapamycin (10 nM; 24 h) or Torin (200 nM; 24 h), and probed with the indicated antibodies. Mobility shifts as described in B. Blots are representative of three independent experiments. (E) Basal conformation of PKC analyzed using the conformational reporter Kinameleon which comprises a donor:acceptor pair flanking the N and C termini of PKC. Autoinhibited PKC has a low FRET ratio and the open conformation has high FRET ratio. Indicated are the FRET ratio (mean ± SEM) of PKCβII Kinameleon wild-type (WT) or kinase-dead K371R (KD) expressed without or with HA-Sin1 in WT (+/+) or Sin1 KO (Sin1−/−) MEFs. Each data point represents the FRET ratio from an individual cell relative to the average maximum signal in three independent experiments. ****p < 0.0001 by Student’s t-test. (F) Agonist-induced conformational changes of PKCβII assessed using the reporter Kinameleon. Wild-type (WT) or kinase-dead K371R (KD) Kinameleon was expressed without or with HA-Sin1 in WT (Sin1+/+) or Sin1 KO (Sin1−/−) MEFs and treated with PDBu (200 nM) at the indicated time. Data represent the normalized FRET ratio changes (mean ± SEM) from three independent experiments. (G) Fluorescence images of WT (+/+) or Sin1 KO (Sin1−/−) MEFs expressing PKCβII Kinameleon alone or with coexpression of HA-Sin1, before (0) or after treatment with PDBu (200 nM) for the indicated timepoints. Images are representative of three independent experiments. (H) Analysis of plasma membrane translocation of mYFP-PKCβII WT or T641E/S660E (EE) in WT (+/+) or Sin1 KO (−/−) MEFs co-expressing myristoylated-palmitoylated mCFP with or without HA-Sin1, and treated with PDBu (100 nM). Data represent the FRET ratio signal from the CFP to YFP and are normalized to the maximum FRET ratio signal determined by fitting the data to a single phase logarithmic nonlinear regression (solid lines). Data represent the normalized FRET ratio changes (mean ± SEM) from three independent experiments. (I) Western blot of Triton-solubilized lysates from WT (+/+) MEFs overexpressing PKCβII and treated with Torin (250 nM) for 24 h prior to lysis. Mobility shifts as described in B. Blots are representative of three independent experiments. (J) Western blot of Triton-solubilized lysates from COS7 cells transfected with cDNA for PKCβII for 24 h prior to treatment with Torin (250 nM) and Cycloheximide (250 μM) for the indicated times. Mobility shifts as described in B. Blots are representative of three independent experiments. (K) Autoradiogram (detecting 35S-labeled newly-synthesized PKC) and Western blot (detecting total pool of PKC) of HA immunoprecipitates from a pulse-chase analysis of COS7 cells expressing HA-PKCβII WT or K371R (Kinase-Dead) and treated with Torin (250 nM) during the chase. Mobility shifts as described in B. Blots are representative of three independent experiments. (L) Autoradiogram (detecting 35S-labeled newly-synthesized PKC) and Western blot (detecting total pool of PKC) HA immunoprecipitates from a pulse-chase analysis of WT MEFs expressing the indicated HA-PKCβII constructs and treated with Torin (250 nM) during the chase. The double asterisk (**) denotes the position of mature, fully-phosphorylated PKC; the single asterisk (*) denotes the position of PKC phosphorylated at either the turn motif or hydrophobic motif; and the dash (−) indicates the position of unphosphorylated PKC. Blots are representative of three independent experiments.
Fig. 2.
Fig. 2.. The Hydrophobic Motif of PKC and Akt is Regulated by Autophosphorylation.
(A) Pulse-chase experiment monitoring newly-synthesized FLAG-PKCβII (35S; autoradiograph) immunoprecipitated (IP) from COS7 cells co-expressing FLAG-PDK1 WT or kinase-dead K110N (kd) and treated without or with Torin (250 nM) during the chase. Blots are representative of three independent experiments. (B) Western blot analysis of Triton-solubilized lysates (Input) or FLAG immunoprecipitates (IP:FLAG) from WT (+/+) or Sin1 KO (Sin1−/−) MEFs expressing FLAG-PKCβII WT or kinase-dead K371R (kd), and FLAG-PDK1 WT, kinase-dead K110N (kd), or HA-Sin1. Non-transfected cells (NT) also shown. Cells were treated with or without Torin (200 nM) during transfection and lysed 24 h later. (right) Quantification of % PKC phosphorylation obtained from the ratio of the slower mobility species (phosphorylated on hydrophobic motif, indicated by asterisks) over total PKC from 4 independent experiments. (C) PKC activity in WT (+/+) or Sin1 KO (Sin1−/−) MEFs expressing CKAR2 (48) and mCherry-PKCβII, and treated with PDBu (200 nM). Data represent the normalized FRET ratio changes (mean ± SEM) from three independent experiments. (right) Quantification of PKC activity reflects the normalized area under the curve from baseline of 1.0 (AUC; mean ± SEM) 10 min after PDBu treatment. Each point represents data from one cell. (D) Western blot analysis of Triton-solubilized lysates (Input) or FLAG immunoprecipitates (IP:FLAG) from Sin1 KO (Sin1−/−) MEFs expressing FLAG-mAkt1 catalytic domain (141-480) WT or kinase-dead K179M (kd), and FLAG-PDK1 WT, kinase-dead K110N (kd), or HA-Sin1. (right) Quantification of Akt phosphorylation reflects the normalized phospho-signal relative to total Akt for the activation loop (pThr308), turn motif (pThr450), or hydrophobic motif (pSer473) from 4 independent experiments. (E) The hydrophobic motif of PKC and Akt is regulated by autophosphorylation in a PDK1-dependent and mTORC2-sensitive manner. Schematic of mTORC2 and PDK1 function in the phosphorylation of PKC and Akt: (left) mTORC2-containing cells produce kinase that is phosphorylated at the activation loop (AL), Turn Motif (TM), and Hydrophobic Motif (HM); (middle) mTORC2-deficient cells produce kinase with impaired phosphorylation at all three sites; (right) PDK1 overexpression in mTORC2-deficient cells rescues phosphorylation at the AL and HM, but not the TM. This rescue depends on the intrinsic catalytic activity of PKC and Akt, indicating that the hydrophobic motif of both kinases is regulated by autophosphorylation (green arrow) in a reaction that is promoted by PDK1 phosphorylation of the activation loop. mTORC2 facilitates the PDK1 step and can by bypassed with PDK1 overexpression. In Western blots, the double asterisk (**) denotes the position of mature, phosphorylated PKC; the single asterisk (*) denotes the position of PKC phosphorylated at the hydrophobic motif, and the dash (−) indicates the position of unphosphorylated PKC. *p < 0.05, **p < 0.01, ***p < 0.001, ****p < 0.0001 by One-way ANOVA and Tukey HSD Test. Western blot quantifications represent the mean ± SEM from at least three independent experiments.
Fig. 3.
Fig. 3.. mTORC2 Binds and Phosphorylates a Novel TOR-Interaction Motif.
(A) Autoradiograph (35S) and Western blot of HA or Myc immunoprecipitates from a pulse-chase experiment of COS7 cells co-expressing HA-PKCβII and Myc-mTOR. The double asterisk (**) denotes the position of mature, fully phosphorylated PKC and the dash (−) indicates the position of unphosphorylated PKC. Blots are representative of three independent experiments. (B) (top) Immunoblot analysis of 1-step, 15-mer peptide arrays spanning residues 615-643 (left) and residues 642-669 (right) of the PKCβII C-tail overlaid with Triton-solubilized lysate from WT MEFs expressing HA-Sin1 or Myc-mTOR and probed with antibodies for Sin1 (HA) or mTOR (Myc). The positions of the turn motif Thr641 and hydrophobic motif Ser660 are indicated. (far right) Peptide arrays of the indicated hydrophobic motif sequences were generated with phospho-Ser (pS) or unphosphorylated Ser (S) at the hydrophobic motif site and probed for mTOR as in panels on left. (bottom) Ala-scans of the indicated C-tail peptides were probed for Sin1 (HA) and mTOR; first spot is the wild-type peptide (WT). Blots are representative of three independent experiments. (C) Docking of the Sin1 CRIM domain (NMR structure, PDB ID: 2RVK) to the PKCβII catalytic domain (X-ray structure, PDB ID: 2I0E). (inset) Interactions of the CRIM domain acidic loop with the PKCβII TOR-interaction motif helix are shown. (D) Sequence alignment of the active-site tether and turn motif regions in the PKC C-tail, indicating the novel TOR-interaction motif Thr conserved in mTORC2-dependent PKC isozymes. (E) Western blot of FLAG immunoprecipitates (IP:FLAG) from WT (+/+) or Sin1 KO (Sin1−/−) MEFs expressing FLAG-PKCβII alone or with HA-Sin1 and probed with an antibody to pThr634 or FLAG. Tubulin blot represents 10% whole-cell lysate input prior to immunoprecipitation. (F) Western blot of whole-cell lysates (WCL) from HEK-293t cells expressing FLAG-PKCβII, treated with Torin (250 nM) for 36 h co-transfection, and probed with the indicated antibodies. (right) Quantification reflects the TIM phospho-signal (pThr634) relative to total PKC. (G) Western blot from in vitro mTORC2 kinase assay, performed by incubation of HA-Sin1 or HA empty vector control (Vec) immunoprecipitated from HEK-293t cells transfected with these HA constructs, and GST-tagged PKCβII C-tail (a.a.601-673) WT or T634A purified by GST pulldown, in the presence or absence of Torin (200 nM) and probed with antibodies to mTORC2 components, GST, or an antibody to phospho-Thr. The asterisk (*) represents phosphorylated GST-PKCβII C-tail peptide and the dash (−) represents unphosphorylated peptide. (H) Relative abundance of PKCβII C-tail peptide or phosphorylation at Thr634 for the in vitro kinase assay shown in (H) as determined by LC-MS. Data were obtained from two independent kinase assays. (I) Representative spectrum of in vivo PKCβII Thr634 phosphorylation from analysis of a mouse brain phospho-proteomic dataset. Blue color denotes y ions and red color denotes b ions. (ppm-parts per million, Xcorr- spectral match correlation score). **p < 0.01 by One-way ANOVA and Tukey HSD Test or Student’s t-test. Error bars represent SEM from at least three independent experiments.
Fig. 4.
Fig. 4.. The TOR-Interaction Motif Is Evolutionarily Conserved in Eukaryotes.
(A) Sequence alignment of the active-site tether region of AGC kinases indicating TOR-interaction motif (red) and turn motif (blue) phosphorylation sites for selected AGC kinases. (B) AGC kinase branch of the human Kinome tree (111) indicating conservation of the TOR-interaction motif Thr in the highlighted kinases. (C) Co-conservation of the TOR-interaction motif with TORC2 components SIN1 and RICTOR in various species (detailed in Fig. S7). Conservation of the TOR-interaction motif was defined by species that showed at least one AGC kinase conserving the TIM Thr. (D) Conservation of the TOR-interaction motif Thr (TIM-Thr) in the AGC C-terminal tail across 5 major taxonomic groups. Sequence logos are shown for four distinct regions of the AGC tail: PxxP motif (124), active-site tether (57), turn motif, and hydrophobic motif. Sequences are stratified by taxonomic clades across the Y-axis: opisthokonta (animals, fungi, yeast), viridiplantae (terrestrial & aquatic plants), SAR (protozoa), amoebozoa (protozoa), and excavata (protozoa). Within each clade, sequences are further stratified by conservation of the TIM-Thr (top row). Pie charts (right) show the composition of AGC families within strata. AGC families accounting for less than 10% of each strata are not shown.
Fig. 5.
Fig. 5.. TOR-Interaction Motif Phosphorylation is Critical for PKC and Akt Activity.
(A) PKC activity in COS7 cells expressing CKAR2 (48) alone or with mCherry-PKCβII WT, T634A, T641A, or T634A/T641A (AA) and treated with UTP (100 μM) and then PDBu (200 nM) at the times noted. Data represent the normalized FRET ratio changes (mean ± SEM) from three independent experiments. (right) Quantification of PKC activity represents the normalized area under the curve from baseline of 1.0 (AUC; mean ± SEM) for the 20 min following UTP addition. Each data point reflects AUC of single cells from three independent experiments. (B) Akt activity in COS7 cells expressing BKAR and mCherry-mAkt1 kinase domain (a.a.141-480) WT, T450A, or T443A and treated with the Akt inhibitor GDC-0068 (20 μM). The drop in FRET upon inhibitor addition indicates the degree of basal activity of the isolated kinase domain. Data represent the normalized FRET ratio changes (mean ± SEM) from three independent experiments. (right) Quantification of basal Akt activity measured by magnitude of the FRET change (mean ± SEM) 12 min after inhibitor addition. Each data point reflects AUC of a single cells from three independent experiments. (C) Western blot of FLAG immunoprecipitates from Triton-solubilized lysates of HEK-293t cells expressing FLAG-PKCβII WT, T634A, T641A, or T634A/T641A (AA) and probed with the indicated antibodies. (right) Quantification of PKC phosphorylation (mean ± SEM) from three independent experiments represents the percent of the slower-mobility, phosphorylated species (**) over total PKC. Blots are representative of three independent experiments. (D) Western blot of FLAG immunoprecipitates from Triton-solubilized lysates of HEK-293t cells expressing FLAG-Akt1 catalytic domain (a.a.141-480) WT, T443A, or T450A constructs and probed with the indicated antibodies. (right) Quantification of Akt phosphorylation (mean ± SEM) from three independent experiments reflects the normalized phospho-signal relative to total Akt for the activation loop (pThr308) or hydrophobic motif (pSer473). Blots are representative of three independent experiments. **p < 0.01; ****p < 0.0001; n.s., not significant by One-way ANOVA and Tukey HSD Test or Student’s t-test. Western blot quantifications represent the mean ± SEM from at least three independent experiments.
Fig. 6.
Fig. 6.. The TOR-Interaction Motif Coordinates PKC Dimerization.
(A) PKC dimer from PKCβII X-ray structure (PDB ID: 2I0E) showing the PKC kinase (teal) and C-tail (red) with dimer partner (PKC′) kinase (tan) and C-tail (blue). The dimerization interface at the TOR-interaction helix (TIM Helix) is shown with interacting Phe residues. (B) Western blot of Triton-solubilized lysates (Input) and HA or IgG control immunoprecipitates from HEK-293t cells expressing HA- and mCherry-PKCβII WT or T634A/T641A (AA), and probed with the indicated antibodies. s.e., short exposure; l.e., long exposure. (right) Quantification of immunoprecipitated mCherry-PKC normalized to the input mCherry-PKC (mean ± SEM) from three independent experiments. (C) Domain organization of PKCβII constructs tagged with the Renilla luciferase (Rluc) based protein-fragment complementation assay (PCA) fragments Rluc-F[1] and Rluc-F[2]. Scheme illustrates an involvement of the PKC TOR-interaction motif (TIM) in PKC dimer formation analyzed using the PCA system. PKC dimerization induces the complementation of Rluc fragments and bioluminescent signal reflects the indicated protein-protein interactions (PPI). (D) Indicated C-terminally tagged Rluc PCA reporter constructs were transiently co-expressed in HEK293 cells (the exception is the N terminally tagged F[1]-PKCβ). Data are presented as the fold change of bioluminescent signals (relative light units (RLU)) relative to PKCβII homodimer formation. Each point represents the mean value of an individual experiment performed at least in triplicate; bars indicate the mean ± SEM from four independent experiments. The PKA subunit RIα was used as a dimerization positive control. (E) PKC dimer formation of PKCβII WT and T634A/T641A (AA), measured in the presence or absence of cycloheximide (CHX; 250 μM for 6 h), assessed by the RLuc PCA reporter assay as in (D). Data are presented as the fold change of the PPI signal relative to the WT PKCβII dimer signal. Each point represents the mean value of an individual experiment performed at least in triplicate; bars indicate the mean ± SEM from five independent experiments. *p< 0.05; **p<0.01; ***p<0.001; n.s., not significant by paired Student's t-test. (F) Effect of increasing expression of FLAG-PKCβII WT or T634A/T641A (AA) on dimer formation of PKCbII-Rluc-F[1] and PKCbII-Rluc-F[2]. Data are presented as the fold change of the PPI signal in relation to the mock control. Each point represents the mean value of an individual experiment performed at least in triplicate; bars indicate the mean ± SEM from three independent experiments. *p< 0.05; **p<0.01; ***p<0.001; n.s., not significant by One-way ANOVA. (G) Dimerization interface of the TIM helix showing hydrophobic interactions and TIM phosphorylation site (T634). Kekulé structures of two PKC Dimerization Disruptor (PKC-DD) stapled peptides targeting the TOR-interaction motif. (H) Western blot of HEK293t cells expressing FLAG-PKCβII, treated with 10 μM of the indicated PKC-DD stapled peptides for 24 h prior to lysis, and probed with the indicated antibodies. (right) Quantification represents the amount of PKC phosphorylated at Thr641 or Ser660 normalized to total PKC from three independent experiments. *p < 0.05; **p<0.01; ***p<0.001; n.s., not significant by Student’s t-test or One-way ANOVA. Error bars represent SEM from at least n=3 experiments.
Fig. 7.
Fig. 7.. Model of PKC maturation by phosphorylation.
(A) Newly-synthesized PKC exists as a homodimer mediated by the TOR-interaction motif (TIM) helix, with membrane targeting domains exposed, and is neither phosphorylated nor catalytically active (UNPRIMED). (B) mTORC2 binds to disrupt the dimer interface, phosphorylates TIM and turn motif phosphorylation to relieve the PKC dimer, exposing the C-terminal tail to recruit PDK1. (C) Bound PDK1 phosphorylates PKC at the activation loop. (D) Activation loop phosphorylation triggers intramolecular autophosphorylation at the hydrophobic motif. (E) Phosphorylation at the hydrophobic motif triggers binding of the pseudosubstrate to the substrate binding cavity to effect autoinhibition (PRIMED). This species of PKC, which is stable and catalytically competent, is maintained in an inactive state by the pseudosubstrate, poised for activation by the second-messengers diacylglycerol and Ca2+.
Fig. 8.
Fig. 8.. Model for Phosphorylation of mTOR-Regulated AGC Kinases.
mTOR-regulated kinases are phosphorylated at the activation loop, turn motif, hydrophobic motif, and the newly-identified TOR-interaction motif. The TOR-interaction motif and turn motif are phosphorylated by mTOR, which facilitates activation loop phosphorylation by PDK1, and triggers hydrophobic motif autophosphorylation to activate the kinase.

References

    1. Nolen B, Taylor S, Ghosh G, Regulation of protein kinases: Controlling activity through activation segment conformation. Mol. Cell 15 (2004), pp. 661–675. - PubMed
    1. Pearce LR, Komander D, Alessi DR, The nuts and bolts of AGC protein kinases. Nat. Rev. Mol. cell Biol 11 (2010), doi:10.1038/nrm2822. - DOI - PubMed
    1. Leroux AE, Schulze JO, Biondi RM, AGC kinases, mechanisms of regulation and innovative drug development. Semin. Cancer Biol 48, 1–17 (2018). - PubMed
    1. Mora A, Komander D, Van Aalten DMF, Alessi DR, PDK1, the master regulator of AGC kinase signal transduction. Semin. Cell Dev. Biol 15, 161–170 (2004). - PubMed
    1. Alessi DR, James SR, Downes CP, Holmes AB, Gaffney PRJ, Reese CB, Cohen P, Characterization of a 3-phosphoinositide-dependent protein kinase which phosphorylates and activates protein kinase Bα. Curr. Biol 7, 261–269 (1997). - PubMed

Publication types