. 2021 Apr 14;6(1):148.
doi: 10.1038/s41392-021-00535-1.

GOLM1 restricts colitis and colon tumorigenesis by ensuring Notch signaling equilibrium in intestinal homeostasis

Affiliations

GOLM1 restricts colitis and colon tumorigenesis by ensuring Notch signaling equilibrium in intestinal homeostasis

Yang Pu et al. Signal Transduct Target Ther. .

Abstract

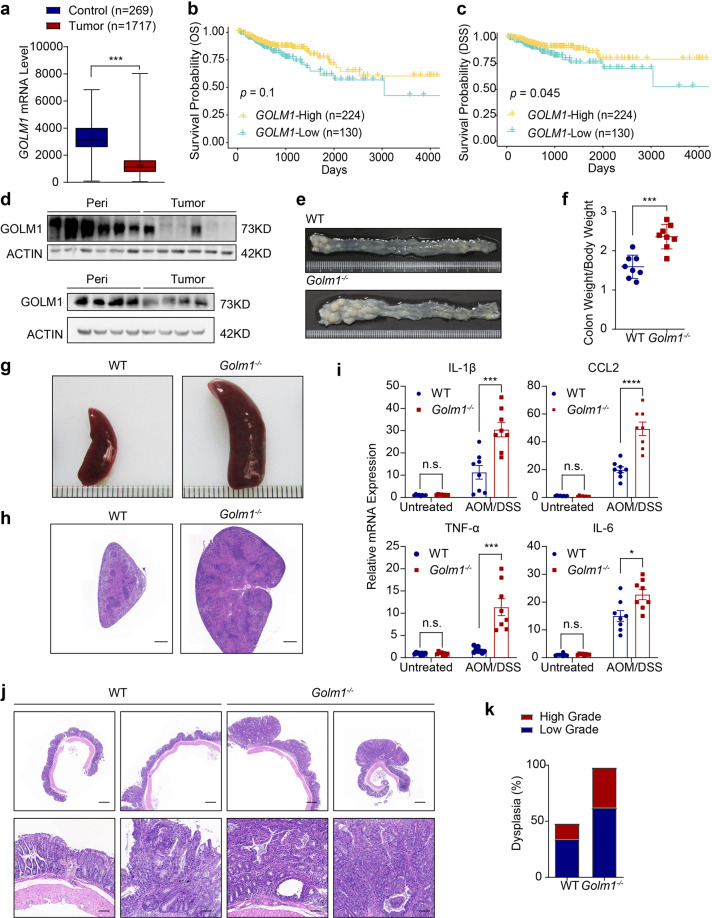
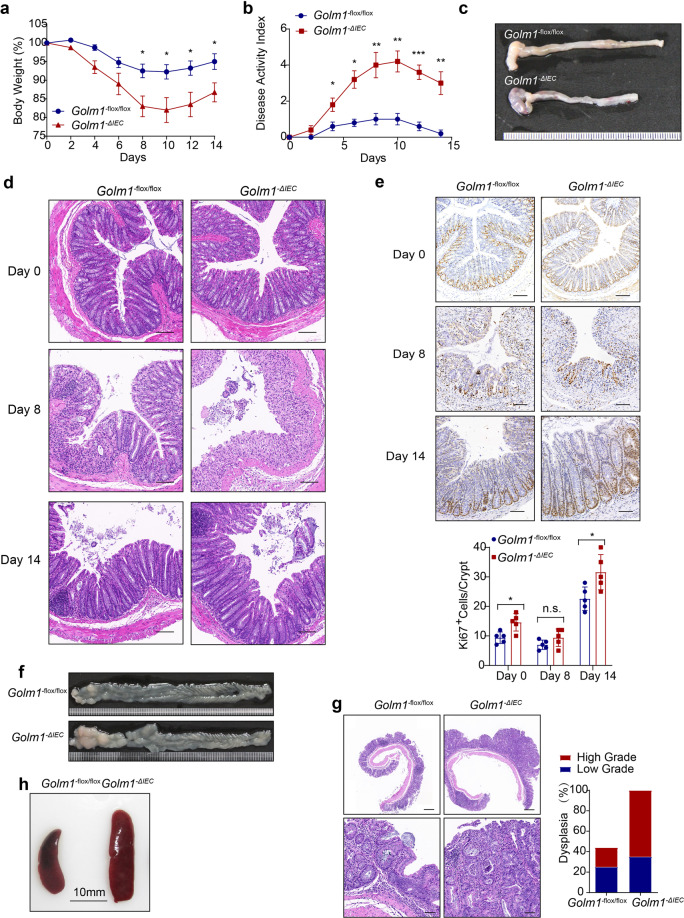
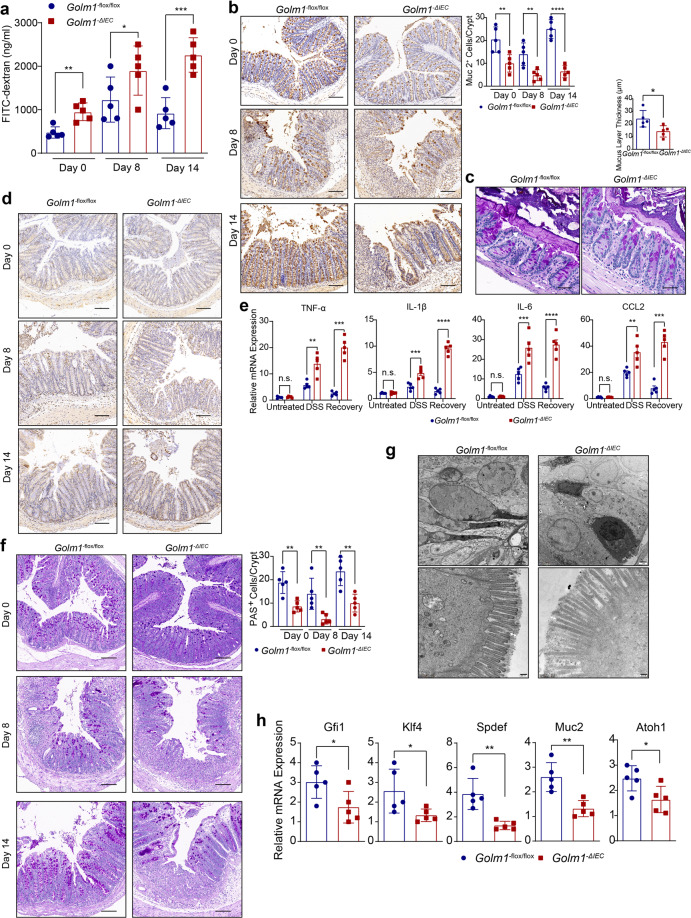
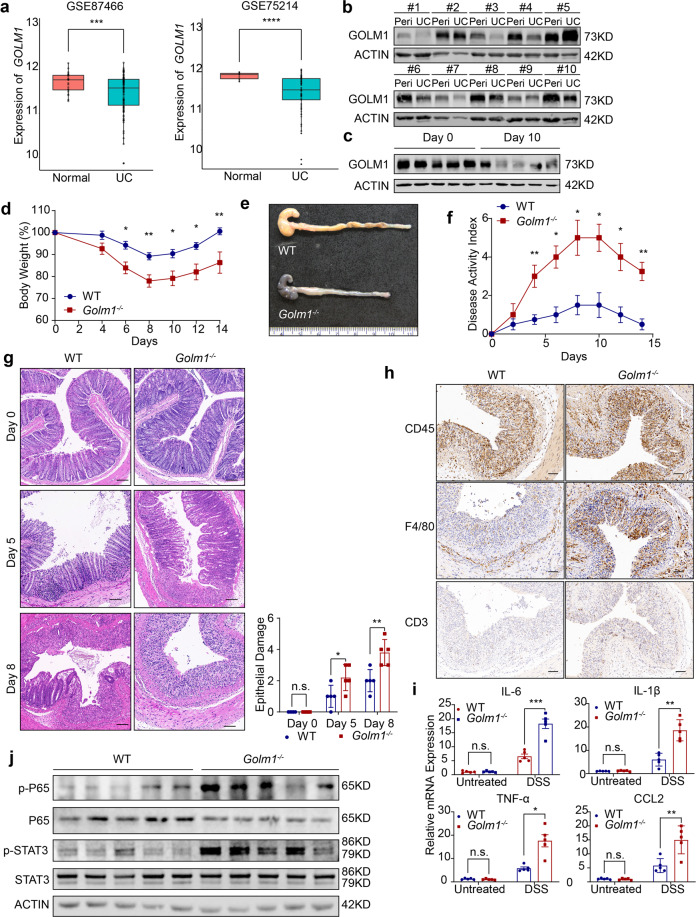
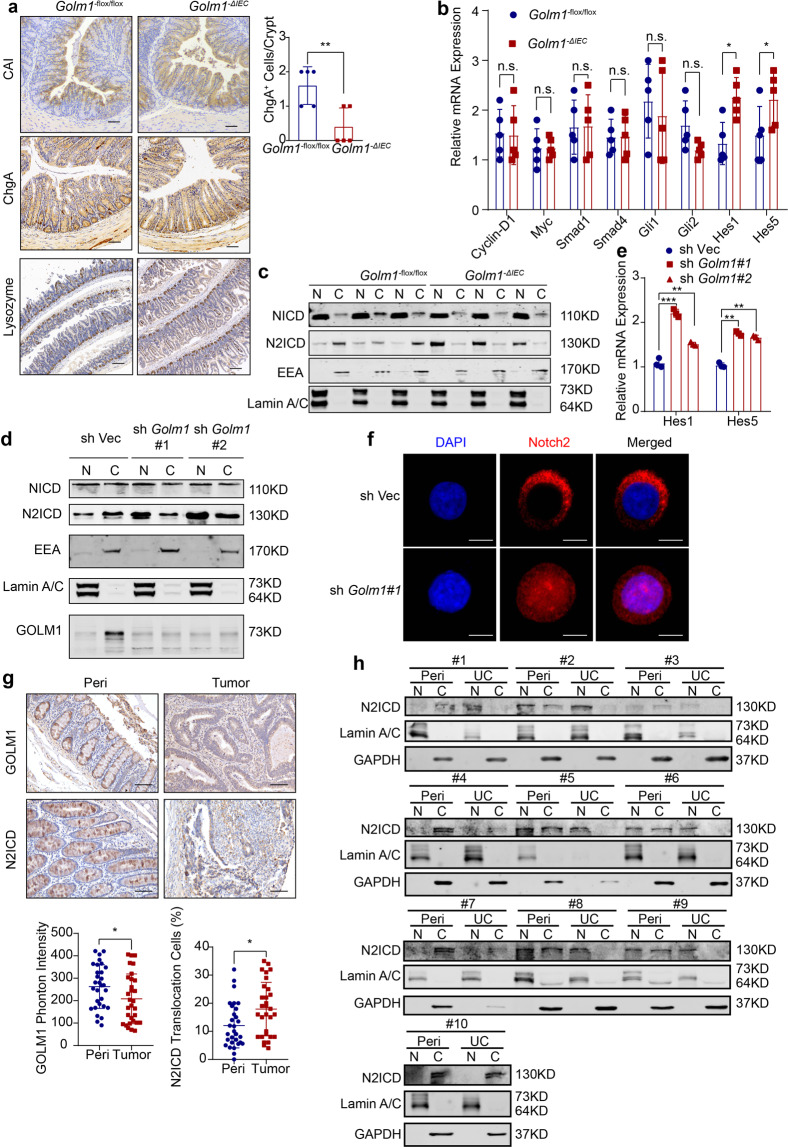
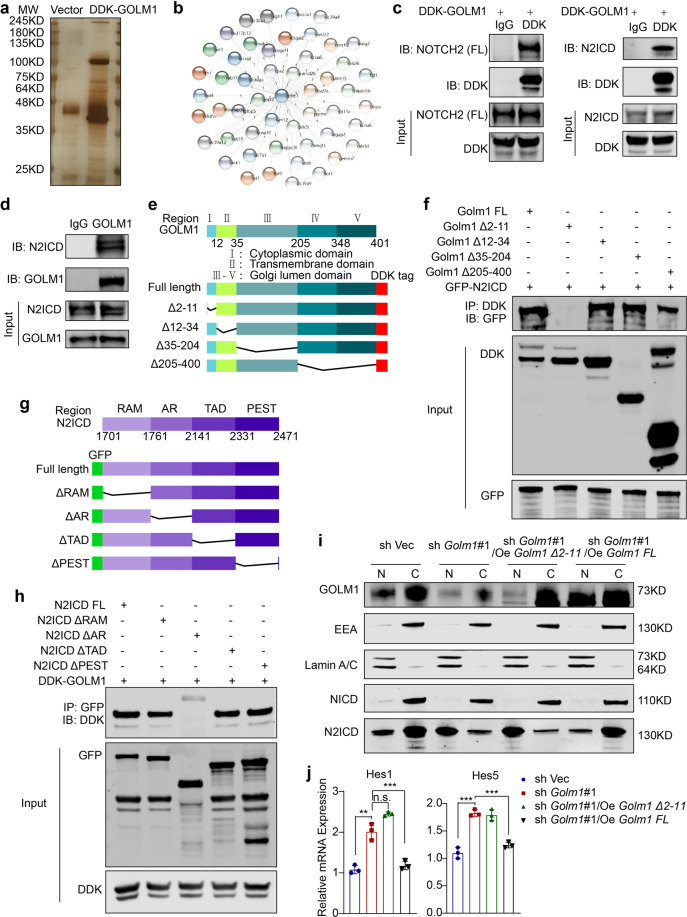
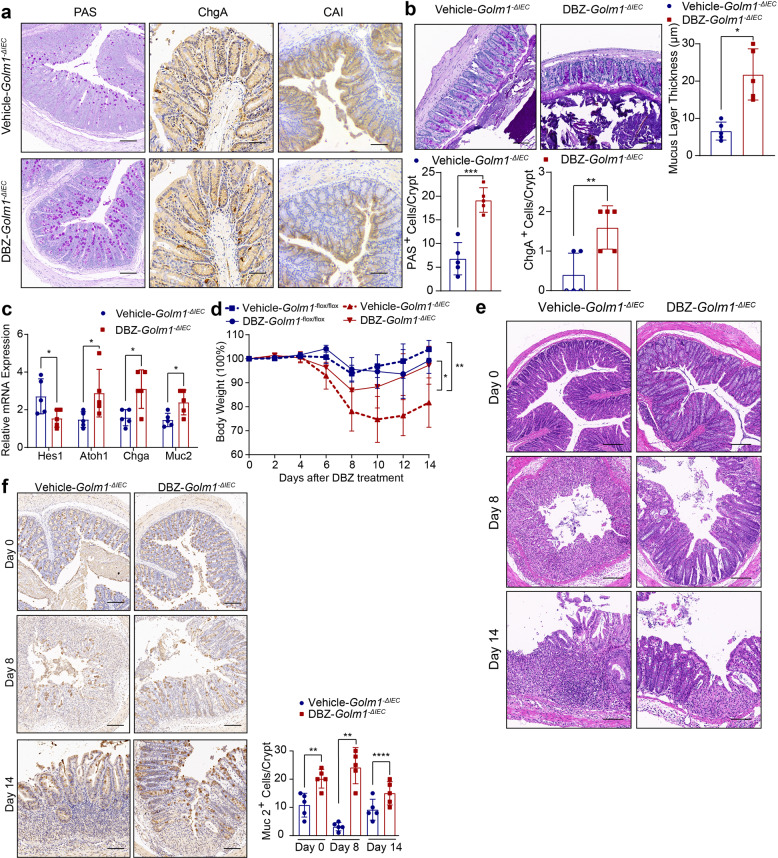
Intestinal epithelium serves as the first barrier against the infections and injuries that mediate colonic inflammation. Colorectal cancer is often accompanied with chronic inflammation. Differed from its well-known oncogenic role in many malignancies, we present here that Golgi membrane protein 1 (GOLM1, also referred to as GP73) suppresses colorectal tumorigenesis via maintenance of intestinal epithelial barrier. GOLM1 deficiency in mice conferred susceptibility to mucosal inflammation and colitis-induced epithelial damage, which consequently promoted colon cancer. Mechanistically, depletion of GOLM1 in intestinal epithelial cells (IECs) led to aberrant Notch activation that interfered with IEC differentiation, maturation, and lineage commitment in mice. Pharmacological inhibition of Notch pathway alleviated epithelial lesions and restrained pro-tumorigenic inflammation in GOLM1-deficient mice. Therefore, GOLM1 maintains IEC homeostasis and protects against colitis and colon tumorigenesis by modulating the equilibrium of Notch signaling pathway.


Conflict of interest statement

The authors declare no competing interests.

Figures

Fig. 1
Fig. 1
GOLM1-deficient mice are more susceptible to AOM/DSS-induced colon tumorigenesis. a GOLM1 expression in human colorectal cancer (CRC) tissues compared with that in normal tissues using expression data from the TCGA database (***P < 0.001; unpaired, two-tailed Student’s t test). b Curves for overall survival are shown between high and low expression of GOLM1 in CRC samples based on the TCGA database. c Curves for disease-specific survival are shown between high and low expression of GOLM1 in CRC samples based on the TCGA database. d Human CRC and adjacent normal tissues we collected were extracted and immunoblotted (n = 10). e Representative images of colon tumors obtained from AOM/DSS-treated mice. f The average ratio of colon weight/body weight in AOM/DSS-treated mice (each symbol in each column represents an individual mouse, n = 8; the data are represented as the means ± SEM; ***P < 0.01; unpaired, two-tailed Student’s t test). g Representative images of the spleen obtained from AOM/DSS-treated mice. h Representative Hematoxylin and Eosin (H&E) staining of mouse spleen sections obtained from AOM/DSS-treated mice. Scale bars, 1000 μm. i Relative mRNA expression levels of inflammatory mediators in the distal colon of AOM/DSS-treated mice determined by quantitative reverse transcription PCR (qRT-PCR). Relative expression reflects the fold change calculated by comparing with the average expression levels in untreated WT mice (the data are represented as the means ± SEM, n = 8; ***P < 0.001, *P < 0.05; unpaired, two-tailed Student’s t test). j Representative H&E staining of mouse colon sections obtained from AOM/DSS-treated mice. Upper scale bars, 500 μm; lower scale bars, 50 μm. k Percentages of mice with dysplasia at 70 days after AOM injection administration
Fig. 2
Fig. 2
GOLM1 depletion renders mice vulnerable to DSS-induced colitis. a GOLM1 expression was analyzed from intestinal mucosal biopsies of ulcerative colitis (UC) patients and controls of cohorts GSE87466 and GSE75214 (***P < 0.001, ****P < 0.0001; unpaired, two-tailed Student’s t test). b UC patients’ samples and adjacent normal tissues we collected were extracted and immunoblotted (n = 10). c Colon lysates from DSS-treated WT mice sacrificed on the indicated days were analyzed by immunoblotting with indicated antibodies (n = 5). d Mice were administered with 2% DSS for 5 days. The mouse body weights were recorded on indicated days (the data are represented as the means ± SEM, n = 5; *P < 0.05, **P < 0.01). e Representative images of colons from mice treated with 2% DSS for 5 days and sacrificed on day 8. f The disease activity indexes of mice administered 2% DSS treatment for 5 days (the data are represented as the means ± SEM, n = 5; *P < 0.05, **P < 0.01). g Representative H&E staining of mouse colon sections obtained from DSS-treated mice on the indicated days. Scale bars, 100 μm. The sections were histologically graded for epithelial damage (the data are represented as the means ± SEM; *P < 0.05, **P < 0.01; unpaired, two-tailed Student’s t test). h Representative CD45, F4/80, and CD3 staining of the colon sections obtained from mice treated with 2% DSS and sacrificed on day 8. Scale bars, 100 μm. i The relative mRNA expression levels of inflammatory mediators in the distal colon of DSS-treated mice were determined by qRT-PCR (the data are represented as the means ± SEM, n = 5; *P < 0.05, **P < 0.01, ***P < 0.001; unpaired, two-tailed Student’s t test). The relative expression reflects the fold change, which was calculated by comparing with the average expression levels in untreated WT mice. j Colon lysates from DSS-treated mice sacrificed on day 8 were analyzed by immunoblotting (n = 5) with the indicated antibodies
Fig. 3
Fig. 3
GOLM1 deficiency in IEC increases mouse susceptibility of colitis and CAC. a The body weights of 2% DSS-treated Golm1ΔIEC mice and Golm1−flox/flox counterparts were recorded on indicated days (the data are represented as the means ± SEM, n = 5; *P < 0.05). b The disease activity indexes of Golm1ΔIEC mice and Golm1−flox/flox counterparts administered 2% DSS for 5 days (the data are represented as the means ± SEM, n = 5; *P < 0.05, **P < 0.01, ***P < 0.001). c Representative image of colons obtained from Golm1ΔIEC mice and Golm1−flox/flox counterparts treated with 2% DSS for 5 days and sacrificed on day 8. d Representative H&E staining of mouse colon sections obtained from DSS-treated mice on the indicated days. Scale bars, 100 μm. e Representative Ki67 staining of colon sections from mice treated with 2% DSS and sacrificed on the indicated days. Scale bars, 100 μm. Quantification is shown in the histogram (the data are represented as the means ± SEM, n = 5; *P < 0.05; unpaired, two-tailed Student’s t test). f Representative images of colon tumors obtained from AOM/DSS-treated mice. g Representative H&E staining of mouse colon sections obtained from AOM/DSS-treated mice. Upper scale bars, 500 μm; lower scale bars, 50 μm. Percentages of mice with dysplasia at 70 days after injection of AOM. h Representative image of the spleens obtained from AOM/DSS-treated mice
Fig. 4
Fig. 4
GOLM1 restricts colitis and CAC through maintaining goblet cells and intestinal barrier. a Intestinal permeability was measured by concentration of FITC-dextran in mouse serum (the data are represented as the means ± SEM, n = 5; *P < 0.05, **P < 0.01, ***P < 0.0001; unpaired, two-tailed Student’s t test). b Representative MUC-2 staining of mouse colon sections obtained from mice treated with 2% DSS and sacrificed on indicated days. Scale bars, 100 μm. Quantification is shown in the histogram (the data are represented as the means ± SEM, n = 5; **P < 0.01, ****P < 0.0001; unpaired, two-tailed Student’s t test). c Representative PAS staining of mouse colon sections obtained from Golm1ΔIEC \and Golm1−flox/flox mice. White arrows indicate innate mucus layer. Scale bars, 20 μm. Quantification is shown in the histogram (the data are represented as the means ± SEM, n = 5; *P < 0.05; unpaired, two-tailed Student’s t test). d Representative CD3 staining of mouse colon sections obtained from mice treated with 2% DSS and sacrificed on indicated days. Scale bars, 100 μm. e Relative mRNA expression levels of inflammatory mediators in the distal colon of DSS-treated mice determined by qRT-PCR. Relative expression reflects the fold change calculated by comparing with the average expression levels in untreated Golm1−flox/flox mice (the data are represented as the means ± SEM, n = 5; P < 0.05, **P < 0.01, ***P < 0.001, ****P < 0.0001; unpaired, two-tailed Student’s t test). f Representative PAS staining of mouse colon sections obtained from DSS-treated mice. Scale bars, 100 μm. Quantification is shown in the histogram (the data are represented as the means ± SEM, n = 5; **P < 0.01; unpaired, two-tailed Student’s t test). g Representative electron microscopy images of goblet cells and epithelial glycocalyx produced by goblet cells between the intestinal microvilli from the colons of Golm1ΔIEC and Golm1−flox/flox mice. Scale bars, 100 nm (upper panel), 200 nm (lower panel). White arrows indicate mucopolysaccharide matrix (epithelial glycocalyx). h Relative mRNA expression levels of the indicated genes in IECs isolated from Golm1ΔIEC and Golm1−flox/flox mice determined by qRT-PCR (the data are represented as the means ± SEM, n = 5; *P < 0.05, **P < 0.01; unpaired, two-tailed Student’s t test)
Fig. 5
Fig. 5
GOLM1 deletion causes the nuclear translocation of N2ICD. a Representative CAI and ChgA staining of mouse colon sections and representative Lysozyme staining of mouse small intestine sections obtained from untreated Golm1ΔIEC and Golm1−flox/flox mice. Scale bars, 100μm. Quantification of ChgA staining is shown in the histogram (the data are represented as the means ± SEM, n = 5; *P < 0.05; unpaired, two-tailed Student’s t test). b The relative mRNA levels of genes that represent the major differentiated signaling pathways in isolated IECs from untreated Golm1ΔIEC and Golm1−flox/flox mice were determined by qRT-PCR (the data are represented as the means ± SEM, n = 5; *P < 0.05; unpaired, two-tailed Student’s t test). c The separated cytoplasmic and nuclear lysates of IECs isolated from untreated Golm1ΔIEC mice and Golm1−flox/flox counterparts were analyzed by immunoblotting (n = 3) with indicated antibodies. d Cellular fractionations from GOLM1-deficient Caco-2 cells and control cells were analyzed by immunoblotting with indicated antibodies. e The relative mRNA expression levels of Notch downstream genes in GOLM1-deficient Caco-2 cells and control cells were determined (the data are represented as the means ± SEM, ***P < 0.001; unpaired, two-tailed Student’s t test). f Representative immunofluorescence staining for N2ICD in GOLM1-deficient Caco-2 cells and control cells. Scale bars, 20 μm. g Representative immunochemistry staining for GOLM1 and N2ICD in 30 CRC samples of tissue microarray. Scale bars, 50 μm. IHC images were calculated using Image-Pro Plus (the data are represented as the means ± SEM; *P < 0.05; unpaired, two-tailed Student’s t test). h Cellular fractionations of colons from the UC patients we collected were analyzed by immunoblotting with the indicated antibodies (n = 10)
Fig. 6
Fig. 6
GOLM1 interacts with N2ICD and modulates its downstream signaling. a Mass spectrometry (MS) analysis of GOLM1-associated proteins. Total cell lysates from DDK-GOLM1 expressed cells were subjected to affinity purification. The purified protein complex was resolved on SDS-PAGE and silver stained; then the bands were retrieved and analyzed by MS. b A diagram depicts GOLM1 interactors as detected by MS (Detailed information in Supplementary Information). c The interaction between GOLM1 and NOTCH2/N2ICD in 293T cells stably expressing DDK GOLM1 was detected by immunoprecipitation. d The interaction between GOLM1 and NOTCH2 (FL)/N2ICD in Caco-2 cells was detected by immunoprecipitation. e Diagrammatic representation of GOLM1 and its truncated forms. Based on sequence and structure analyses, cytoplasmic domain, transmembrane domain, and Golgi lumen domain are indicated. f Various GOLM1 truncation constructs tagged with DDK were co-transfected with GFP-NOTCH2 in 293T cells for domain mapping. Immunoprecipitation analysis was performed with anti-GFP or anti-DDK antibodies. g Diagrammatic representation of N2ICD and its truncated forms. h Various N2ICD truncation constructs tagged with GFP were co-transfected with DDK-GOLM1 in 293T cells for domain mapping. Immunoprecipitation analysis was performed with anti-GFP or anti-DDK antibodies. i Cellular fractionations from GOLM1-deficient Caco-2 cells transfected with various GOLM1 truncation constructs and control cells were analyzed by immunoblotting with the indicated antibodies. j The relative mRNA expression levels of Notch signaling downstream genes from GOLM1-deficient Caco-2 cells transfected with various GOLM1 truncation constructs and control cells were determined by qRT-PCR (the data are represented as the means ± SEM; **P < 0.01, ***P < 0.001; unpaired, two-tailed Student’s t test)
Fig. 7
Fig. 7
Notch inhibitor-DBZ treatment reduces DSS-induced colitis in Golm1ΔIEC mice. a Representative PAS, ChgA and CAI staining of mouse colon tissues obtained from Golm1ΔIEC mice injected intraperitoneally with 3 μmol/kg DBZ or vehicle for 5 days. Scale bars, 100 μm. Quantifications of PAS and ChgA staining are shown in the histogram (the data are represented as the means ± SEM, n = 5; **P < 0.01, ***P < 0.001; unpaired, two-tailed Student’s t test). b Representative PAS staining of mouse colon sections fixed by Carnoy’s fluid from Golm1ΔIEC mice injected intraperitoneally with 3 μmol/kg DBZ or vehicle for 5 days. Scale bars, 50μm. Quantification is shown in the histogram (the data are represented as the means ± SEM, n = 5; **P < 0.01; unpaired, two-tailed Student’s t test). c The relative mRNA expression levels of the indicated genes in the distal colon of mice determined by qRT-PCR after DBZ/vehicle treatment. The relative expression reflects the fold change calculated by comparing with the expression levels in untreated Golm1ΔIEC mice (the data are represented as the means ± SEM, n = 5; *P < 0.05; unpaired, two-tailed Student’s t test). d The body weights of Golm1−flox/flox and Golm1ΔIEC mice treated with 2% DSS followed by DBZ administration were recorded on indicated days (the data are represented as the means ± SEM, n = 5; *P < 0.05, **P < 0.01). e Representative H&E staining of mouse colon sections obtained from DBZ/vehicle-DSS-treated Golm1ΔIEC mice sacrificed on indicated days. Scale bars, 100 μm. f. Representative MUC-2 staining of mouse colon sections obtained from Golm1ΔIEC mice treated with 2% DSS plus DBZ and sacrificed on indicated days. Scale bars, 100μm. Quantification is shown in the histogram (the data are represented as the means ± SEM, n = 5; **P < 0.01, ***P < 0.001; unpaired, two-tailed Student’s t test)

References

    1. Bray F, et al. Global cancer statistics 2018: GLOBOCAN estimates of incidence and mortality worldwide for 36 cancers in 185 countries. CA Cancer J. Clin. 2018;68:394–424. - PubMed
    1. Gillen CD, Walmsley RS, Prior P, Andrews HA, Allan RN. Ulcerative colitis and Crohn’s disease: a comparison of the colorectal cancer risk in extensive colitis. Gut. 1994;35:1590–1592. doi: 10.1136/gut.35.11.1590. - DOI - PMC - PubMed
    1. Ahn MJ, Sun JM, Lee SH, Ahn JS, Park K. EGFR TKI combination with immunotherapy in non-small cell lung cancer. Expert Opin. Drug Saf. 2017;16:465–469. doi: 10.1080/14740338.2017.1300656. - DOI - PubMed
    1. Long AG, Lundsmith ET, Hamilton KE. Inflammation and Colorectal Cancer. Curr. Colorectal Cancer Rep. 2017;13:341–351. doi: 10.1007/s11888-017-0373-6. - DOI - PMC - PubMed
    1. Terzic J, Grivennikov S, Karin E, Karin M. Inflammation and colon cancer. Gastroenterology. 2010;138:2101–2114 e2105. doi: 10.1053/j.gastro.2010.01.058. - DOI - PubMed

Publication types

LinkOut - more resources