. 2021 Apr 13;12(1):2190.
doi: 10.1038/s41467-021-22368-w.

Single cell transcriptional and chromatin accessibility profiling redefine cellular heterogeneity in the adult human kidney

Affiliations

Single cell transcriptional and chromatin accessibility profiling redefine cellular heterogeneity in the adult human kidney

Yoshiharu Muto et al. Nat Commun. .

Abstract

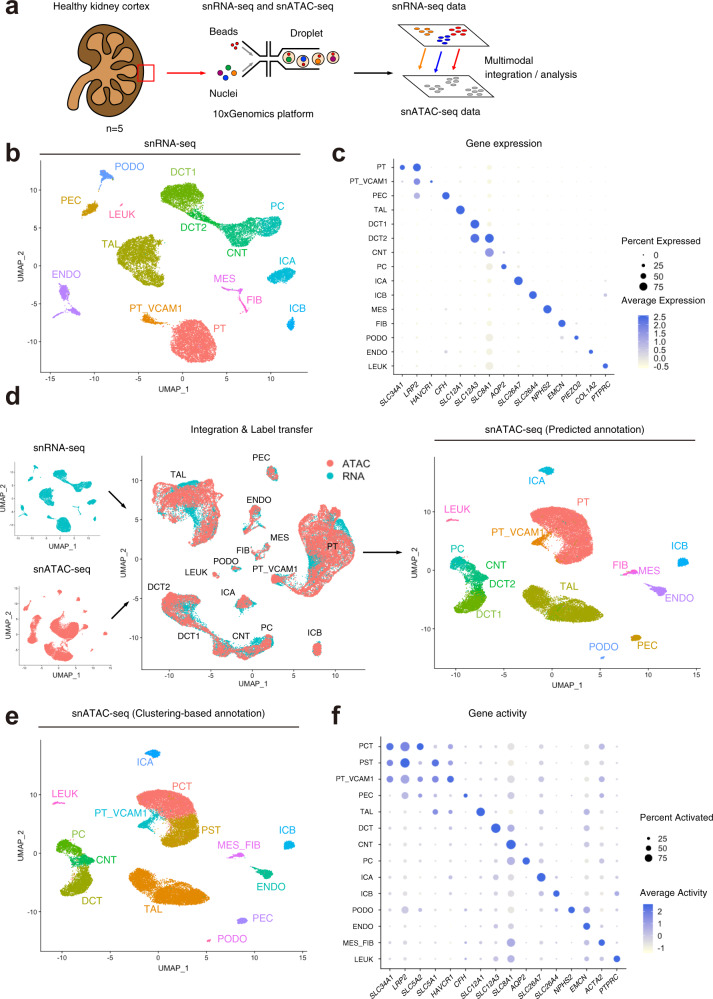
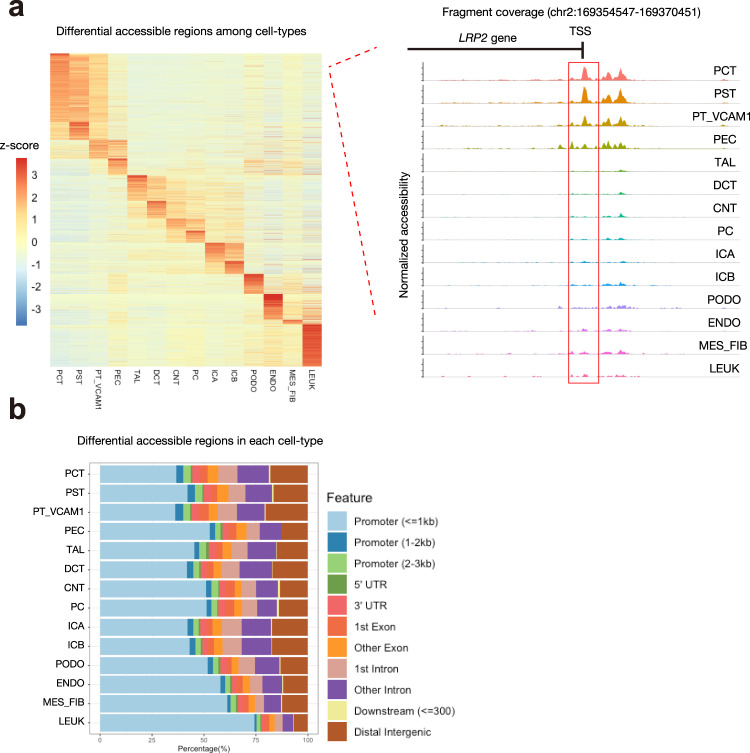
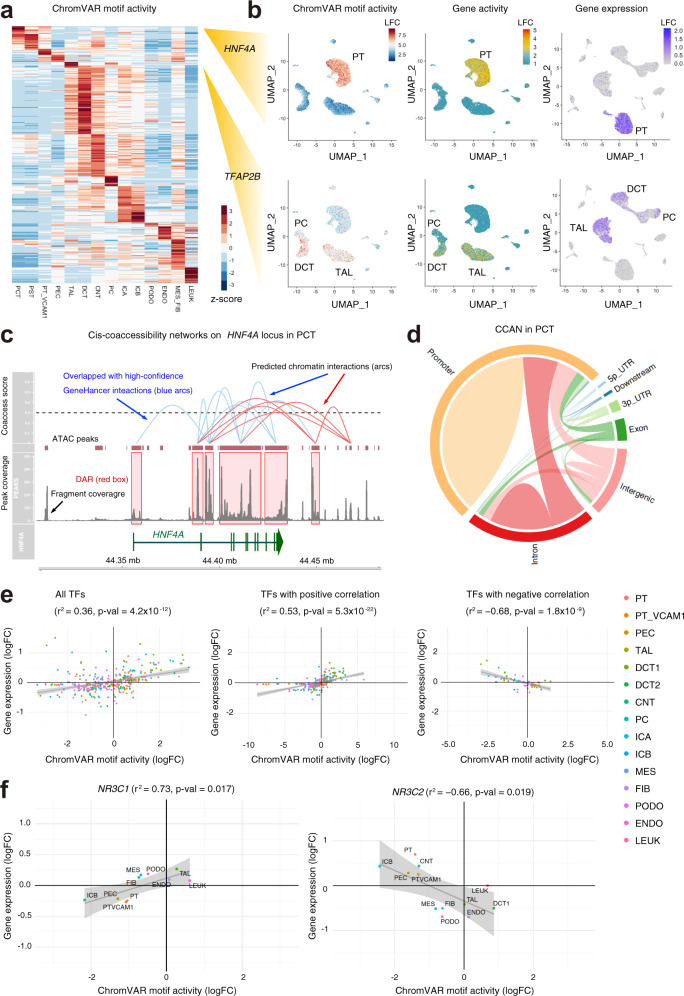
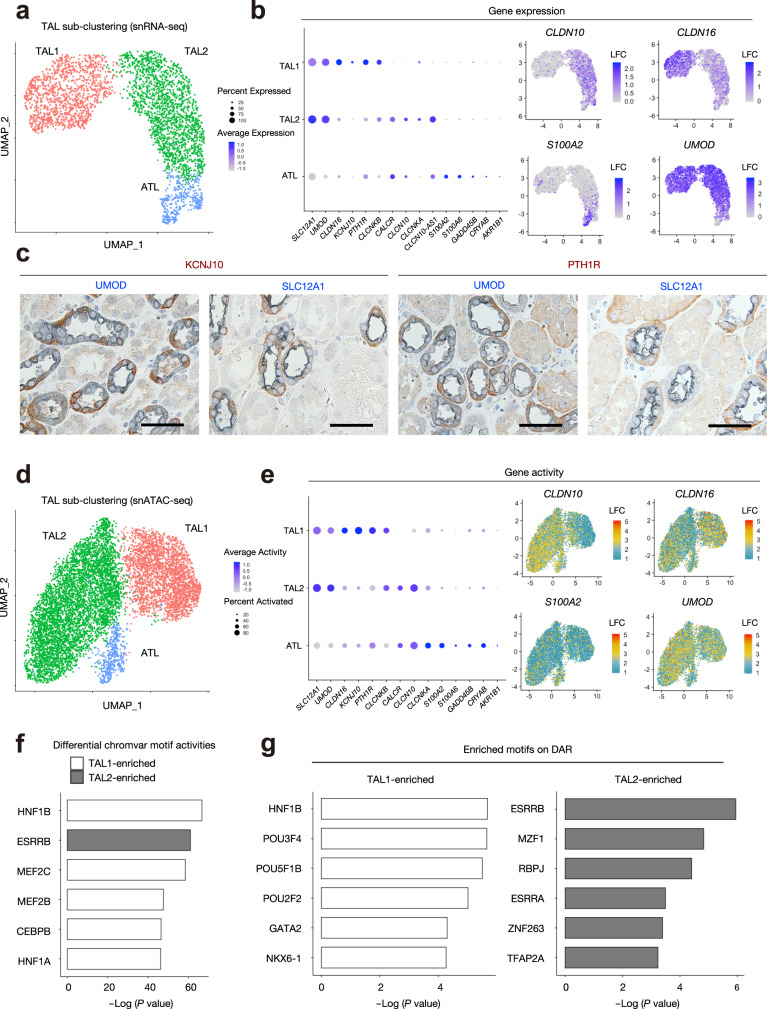
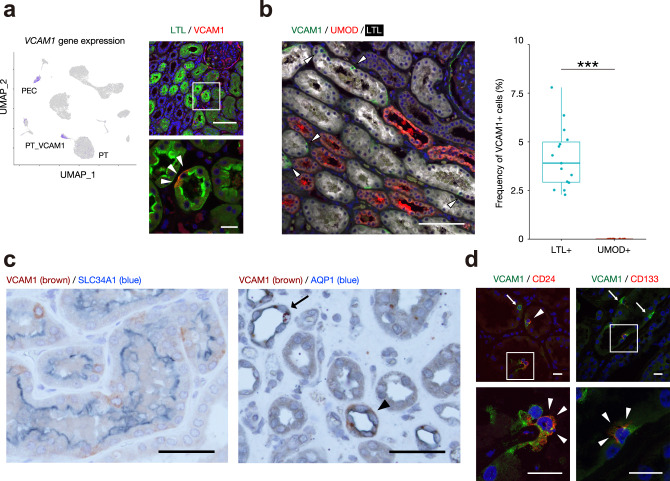
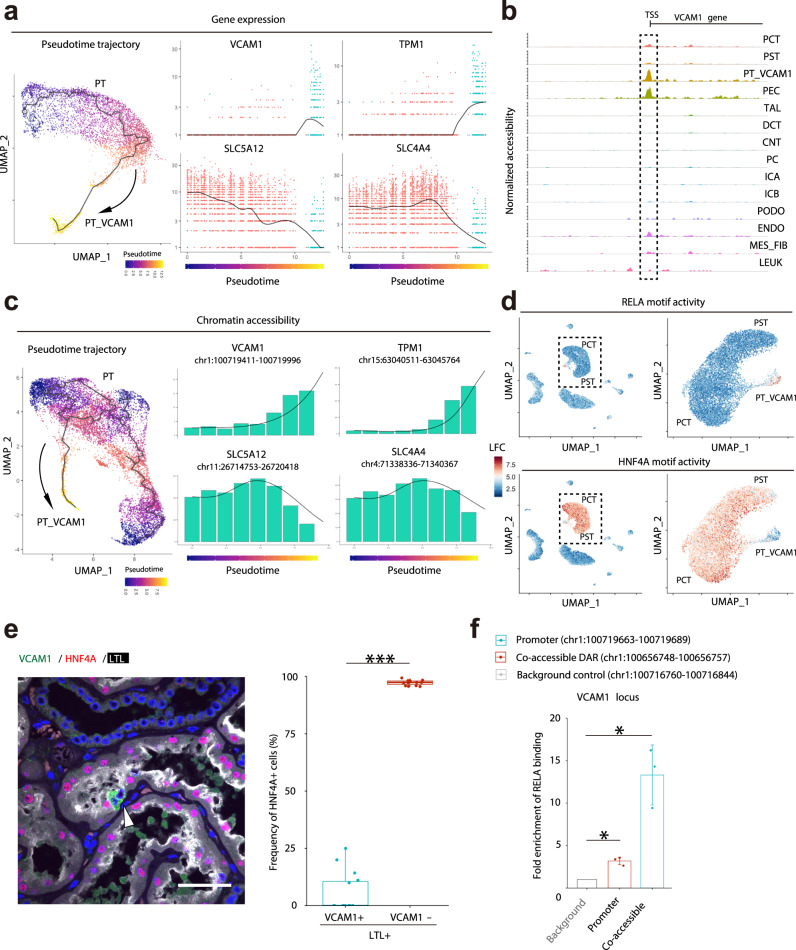
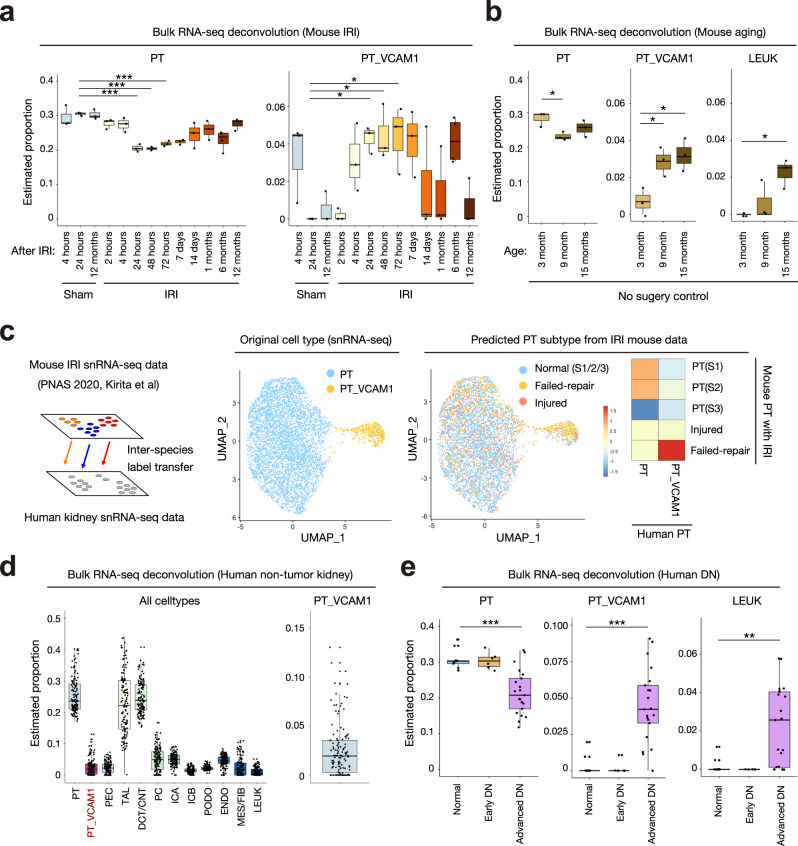
The integration of single cell transcriptome and chromatin accessibility datasets enables a deeper understanding of cell heterogeneity. We performed single nucleus ATAC (snATAC-seq) and RNA (snRNA-seq) sequencing to generate paired, cell-type-specific chromatin accessibility and transcriptional profiles of the adult human kidney. We demonstrate that snATAC-seq is comparable to snRNA-seq in the assignment of cell identity and can further refine our understanding of functional heterogeneity in the nephron. The majority of differentially accessible chromatin regions are localized to promoters and a significant proportion are closely associated with differentially expressed genes. Cell-type-specific enrichment of transcription factor binding motifs implicates the activation of NF-κB that promotes VCAM1 expression and drives transition between a subpopulation of proximal tubule epithelial cells. Our multi-omics approach improves the ability to detect unique cell states within the kidney and redefines cellular heterogeneity in the proximal tubule and thick ascending limb.


Conflict of interest statement

The authors declare no competing interests.

Figures

Fig. 1
Fig. 1. Single-cell transcriptional and chromatin accessibility profiling on the human adult kidneys.
a Graphical abstract of experimental methodology. n = 5 human adult kidneys were analyzed with snRNA-seq and snATAC-seq. b UMAP plots of snRNA-seq dataset. PT, proximal tubule; PT_VCAM1, subpopulation of proximal tubule with VCAM1 expression; PEC, parietal epithelial cells; TAL, thick ascending limb; DCT, distal convoluted tubule; CNT, connecting tubule; PC, principle cells, ICA, Type A intercalated cells; ICB, Type B intercalated cells; PODO, podocyte; ENDO, endothelial cells; MES, mesangial cells, FIB, fibroblasts; LEUK, leukocytes. c Dot plot of snRNA-seq dataset showing gene expression patterns of cluster-enriched markers. The diameter of the dot corresponds to the proportion of cells expressing the indicated gene and the density of the dot corresponds to average expression relative to all cell types. d Multi-omics integration strategy for processing the snATAC-seq dataset. Following integration and label transfer, the snATAC-seq dataset was filtered using a 97% prediction score threshold for cell-type assignment. e UMAP plot of snATAC-seq dataset with gene activities-based cell-type assignments. PCT, proximal convoluted tubule; PST, proximal straight tubule. f Dot plot of snATAC-seq dataset showing gene-activity patterns of cell-type markers. The diameter of the dot corresponds to the proportion of cells with detected activity of indicated gene and the density of the dot corresponds to average gene activity relative to all cell types.
Fig. 2
Fig. 2. Distribution of cell-type-specific chromatin accessible regions.
a Heatmap of average number of Tn5 cut sites within a differentially accessible region (DAR) for each cell type (left). The color scale represents a z-score of the number of Tn5 sites within each DAR scaled by row. Fragment coverage (frequency of Tn5 insertion) around the DAR (DAR ± 50 Kb) on the LRP2 gene promoter is shown (right). b Bar plot of annotated DAR locations for each cell type.
Fig. 3
Fig. 3. Cell-type-specific transcription factor activity and chromatin interaction networks.
a Heatmap of average chromVAR motif activity for each cell type. The color scale represents a z-score scaled by row. b UMAP plot displaying chromVAR motif activity (left), gene activity (middle) and gene expression (right) of HNF4A or TFAP2B. The color scale for each plot represents a normalized log-fold-change (LFC) for the respective assay. c Cis-coaccessibility networks (CCAN, red or blue arcs) near the HNF4A locus in the proximal convoluted tubule (PCT) with multiple connections between DAR (red boxes). DAR overlapping with high-confidence GeneHancer interactions are shown as blue arcs. Fragment coverage (frequency of Tn5 insertion) and called ATAC peaks are shown in the lower half. HNF4A gene track is shown along the bottom of the image. d Circos plot displaying CCAN in the PCT. e Cell-specific mean chromVAR motif activity from the JASPAR database was plotted against cell-specific average log-fold-change expression for the corresponding transcription factor for all cell types and transcription factors (left), transcription factors with significant positive correlation (middle) and transcription factors with significant negative correlation (right). f Mean chromVAR activity was plotted against average log-fold-change for glucocorticoid receptor (NR3C1, left) and mineralocorticoid receptor (NR3C2, right). Significant correlation was assessed with Pearson’s product moment correlation coefficient using the cor.test function in R. snATAC-seq cell types were assigned using the label-transferred annotations from the snRNA-seq Seurat object. Cell types without significant chromVAR activity or transcription factor expression as determined by the Seurat FindMarkers function were not included in the plots.
Fig. 4
Fig. 4. Transcriptional and epigenetic heterogeneity in the thick ascending limb.
a Sub-clustering of TAL on the umap plot of snRNA-seq dataset to divide three subpopulations (TAL1, TAL2, and ATL). ATL, Ascending thin limb (of loop of Henle). b Dot plots showing gene expression patterns of the genes enriched in each of TAL subpopulations (left). The diameter of the dot corresponds to the proportion of cells expressing the indicated gene and the density of the dot corresponds to average expression relative to all cell types. Umap displaying gene expressions of CLDN10, CLDN16, S100A2 or UMOD (right). c Representative immunohistochemical images of KCNJ10 or PTH1R (brown) and UMOD or SLC12A1 (blue) in the adult human kidneys. Scale bar indicates 50 µm. n = 3 samples were independently analyzed and similar results were obtained. d Sub-clustering of TAL on the umap plot of snATAC-seq dataset to divide three subpopulations (TAL1, TAL2, and ATL). e Dot plots showing gene activity patterns of the genes enriched in each of TAL subpopulations (right). The diameter of the dot corresponds to the proportion of cells with detected activity of indicated gene and the density of the dot corresponds to average gene activity relative to all cell types. Umap displaying gene activities of CLDN10, CLDN16, S100A2, or UMOD (left). f Differentially activated transcription factor motifs with chromVAR between TAL1 and TAL2. The top 6 motifs with the lowest P values are listed. g Motif enrichment analysis on the DARs between TAL1 and TAL2. Background was set as the genomic regions that are accessible to at least 2.5% of the TAL cells. The top 6 motifs with the lowest P values in each subpopulation are listed.
Fig. 5
Fig. 5. Identification of a subset of proximal tubular cells that express VCAM1.
a Umap plot displaying VCAM1 gene expression in the snRNA-seq dataset (left), and representative immunohistochemical images of VCAM1 (red) or LTL (Lotus tetragonolobus lectin, green) in the adult kidney (n = 3 patients). Arrowheads indicate the VCAM1+ proximal tubular cells. VCAM1 was expressed in PEC and a subpopulation of LTL+ proximal tubular cells. Scale bar indicates 100 µm (upper right) or 20 µm (lower right). b Immunofluorescence staining for VCAM1 (green), UMOD (red) and LTL (white) in the adult human kidney sections (left, representative image) and quantitation of VCAM1-positive cells on the LTL-positive cells or UMOD-positive cells (right). The quantification was performed in five 200x images randomly taken from each patient (n = 3 patients). Arrowheads indicate VCAM1-positive cells in the LTL-positive PT. Scale bar indicates 100 µm. Box-and-whisker plots depict the median, quartiles and range. ***P < 0.001 (P = 5.47 × 10−11, two-sided Student’s t test). c Representative immunohistochemical images of SLC34A1 or AQP1 (blue) and VCAM1 (brown) in the adult human kidneys. An arrowhead marks VCAM1 expression in the DTL and an arrow marks DTL without VCAM1 expression. Scattered brown dots are seen with multiple different antibodies and considered non-specific staining. Scale bar indicates 50 µm. n = 3 samples were independently analyzed and similar results were obtained. d Representative immunostaining images of CD24 or CD133 (red) and VCAM1 (green) in the adult human kidney. Arrowheads indicate VCAM1 co-expression with CD24 or CD133 in PT and arrows mark VCAM1 expression without CD24 or CD133. Scale bar indicates 20 µm. n = 3 samples were independently analyzed and similar results were obtained.
Fig. 6
Fig. 6. Characterization of a subset of proximal tubular cells using a multi-omics approach.
a Pseudotemporal trajectory from PT to PT_VCAM1 using snRNA-seq was generated with Monocle3 (left), and gene expression dynamics along a pseudotemporal trajectory from PT to PT_VCAM 1 are shown (right); VCAM1 (upper left), TPM1 (upper right), SLC5A12 (lower left) and SLC4A4 (lower right). b Fragment coverage (frequency of Tn5 insertion) around the representative DAR (DAR ± 5000 bp) in VCAM1 locus. c Pseudotemporal trajectory from PT to PT_VCAM1 using snATAC-seq was generated with Cicero (left). Chromatin accessibility dynamics along the pseudotemporal trajectory from PT to PT_VCAM1 are shown (right). chr1:100719411-100719996 (VCAM1 promoter, upper left); chr15:63040511-63045764 (TPM1 promoter, upper right), chr11:26714753-26720418 (SLC5A12 gene body, lower left) and chr4:71338336-71340367 (SLC4A4 gene body, lower right). d Feature plot of single-cell chromVAR motif activity of RELA and HNF4A in the entire dataset or PT/PT_VCAM1 subset. The color scale for each plot represents a normalized log-fold-change (LFC). e Immunofluorescence staining for VCAM1 (green), HNF4A (red) and LTL (white) in the adult human kidney sections (left, representative image) and quantitation of HNF4A-positive cells on the VCAM1-positive or negative subset of LTL-positive PT cells (right). The quantification was performed in five 200x images randomly taken from each patient (n = 3). Arrowheads indicate VCAM1-positive cells without HNF4A expression. Scale bar indicates 50 µm. Box-and-whisker plots depict the median, quartiles and range. ***P < 0.001 (P = 1.21 × 10−26, two-sided Student’s t test). f ChIP followed by quantitative PCR (ChIP-qPCR) analysis of RELA binding within the promoter or the open chromatin region that was predicted to interact with a VCAM1 promoter via a CCAN in the VCAM1 locus in RPTEC (n = 3 independent samples). The background control was set on the region without RELA motif at the upstream of VCAM1 promoter. See also Supplementary Fig. 17b (graphical method). Data are means ± s.d. *P < 0.05 (P = 0.0129 and 0.0264, two-sided one sample t test).
Fig. 7
Fig. 7. The estimated proportion of VCAM1+ proximal tubular cells increases in acute and chronic kidney disease.
a, b Deconvolution analysis of bulk RNA-seq mouse kidney IRI dataset (GSE98622) with BisqueRNA. Sham control and IRI (a), or no surgery control (b). c Inter-species data integration was performed between mouse IRI snRNA-seq (GSE139107) and human snRNA-seq with Seurat (left). PT and PT_VCAM1 from human snRNA-seq (middle) are label-transferred from mouse IRI snRNA-seq, and the frequencies of predicted cell types are shown on the heatmap (right). d Deconvolution analysis of bulk RNA-seq TCGA non-tumor kidney data (e) Deconvolution analysis of bulk RNA-seq human diabetic nephropathy (DN) data (GSE142025) with BisqueRNA. Box-and-whisker plots depict the median, quartiles and range. *P < 0.05; **P < 0.01; ***P < 0.005, one-way ANOVA with post hoc Dunnett’s multiple comparisons test. All P values are provided in the Data Source file.

References

    1. Wilson PC, Humphreys BD. Kidney and organoid single-cell transcriptomics: the end of the beginning. Pediatr. Nephrol. 2020;35:191–197. doi: 10.1007/s00467-018-4177-y. - DOI - PMC - PubMed
    1. Lindgren D, et al. Isolation and characterization of progenitor-like cells from human renal proximal tubules. Am. J. Pathol. 2011;178:828–837. doi: 10.1016/j.ajpath.2010.10.026. - DOI - PMC - PubMed
    1. Smeets B, et al. Proximal tubular cells contain a phenotypically distinct, scattered cell population involved in tubular regeneration. J. Pathol. 2013;229:645–659. doi: 10.1002/path.4125. - DOI - PMC - PubMed
    1. Angelotti ML, et al. Characterization of renal progenitors committed toward tubular lineage and their regenerative potential in renal tubular injury. Stem Cells. 2012;30:1714–1725. doi: 10.1002/stem.1130. - DOI - PubMed
    1. Sagrinati C, et al. Isolation and characterization of multipotent progenitor cells from the Bowman’s capsule of adult human kidneys. J. Am. Soc. Nephrol. 2006;17:2443–2456. doi: 10.1681/ASN.2006010089. - DOI - PubMed

Publication types