. 2021 Apr 13;12(1):2229.
doi: 10.1038/s41467-021-22463-y.

Tissue-specific cell-free DNA degradation quantifies circulating tumor DNA burden

Affiliations

Tissue-specific cell-free DNA degradation quantifies circulating tumor DNA burden

Guanhua Zhu et al. Nat Commun. .

Abstract

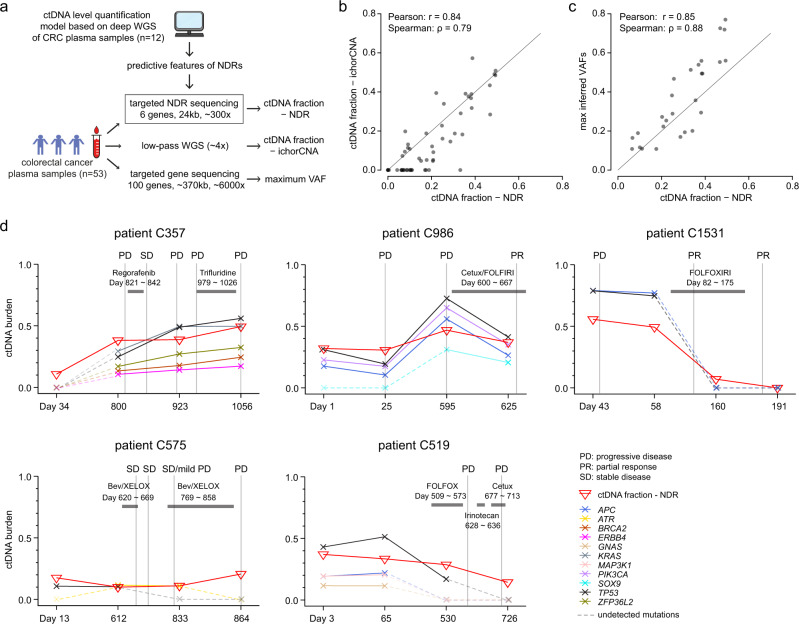
Profiling of circulating tumor DNA (ctDNA) may offer a non-invasive approach to monitor disease progression. Here, we develop a quantitative method, exploiting local tissue-specific cell-free DNA (cfDNA) degradation patterns, that accurately estimates ctDNA burden independent of genomic aberrations. Nucleosome-dependent cfDNA degradation at promoters and first exon-intron junctions is strongly associated with differential transcriptional activity in tumors and blood. A quantitative model, based on just 6 regulatory regions, could accurately predict ctDNA levels in colorectal cancer patients. Strikingly, a model restricted to blood-specific regulatory regions could predict ctDNA levels across both colorectal and breast cancer patients. Using compact targeted sequencing (<25 kb) of predictive regions, we demonstrate how the approach could enable quantitative low-cost tracking of ctDNA dynamics and disease progression.


Conflict of interest statement

The authors declare no competing interests.

Figures

Fig. 1
Fig. 1. Overview of approach.
Deep cfDNA WGS profiles of plasma samples from healthy individuals and cancer patients were compared to identify nucleosome-depleted regions (NDRs) with tumor/blood tissue-specific expression and differential cfDNA coverage. A model was trained to predict ctDNA levels from NDR cfDNA coverage. A compact assay targeting predictive NDRs was used to perform longitudinal profiling of ctDNA levels and dynamics.
Fig. 2
Fig. 2. Characteristics of cfDNA degradation patterns at promoters and exon–intron junctions.
a Systematic analysis of gene regulatory regions for association of gene expression and cfDNA relative coverage. Relative coverage refers to cfDNA coverage across the given region when normalized to ±1 kb flanking regions. The nucleosome-depleted regions of promoter (NDR, −150 to 50 bp relative to TSS) and first exon–intron junction (NDR, −300 to −100 bp relative to first exon end) are highlighted. b Relative cfDNA coverage of promoter and junction NDRs for expressed (fpkm ≥30 in whole blood) and unexpressed genes. c Distribution of promoter and junction NDR relative coverage for expressed and unexpressed genes.
Fig. 3
Fig. 3. Quantitative estimation of colorectal cancer ctDNA burden.
a cfDNA relative coverage for the promoter region of PPP1R16A (ENST00000528430) overexpressed in CRC tumors relative to whole blood, and cfDNA relative coverage for the junction region of GMFG (ENST00000602185) overexpressed in whole blood relative to CRC tumors. The dark red curve shows the mean coverage across CRC samples. b Relative coverage score (see Methods) of NDRs in transcripts differentially expressed between CRC tumors and whole blood. Two-sided Wilcoxon rank-sum tests were performed to compare CRC and blood-specific transcripts. c Schematic showing how the predictive model of ctDNA fractions was developed: differentially expressed genes in CRC and blood were identified, NDR relative coverage features were obtained from in silico generated cfDNA samples, predictive features were selected, and a quantitative model was fitted. d, e Comparison of expected (in silico simulation) and observed ctDNA fractions across the CRC cfDNA samples in the d training and e test set, respectively. The mean absolute error (MAE) is listed for each sample. f Comparison between observed and expected ctDNA fractions of the 113 samples in the test set. Boxplots represent the median as centreline, the interquartile range (IQR) as bounds of box, and the lower quartile –1.5 IQR and the upper quartile +1.5 IQR as whiskers.
Fig. 4
Fig. 4. Targeted NDR assay to quantify ctDNA burden and monitor cancer progression.
a Schematic showing how targeted NDR sequencing, low-pass WGS, and targeted gene sequencing were performed on a cohort of 53 CRC plasma samples. b Comparison of ctDNA fractions (n = 53) inferred by targeted NDR sequencing and low-pass WGS (ichorCNA). c Comparison of ctDNA fractions (n = 27) inferred by targeted NDR sequencing and maximum VAFs (maximum VAF of all SNVs identified in a given plasma sample). d NDR-quantified ctDNA burden across serial plasma samples and its association with events of cancer progression and treatment response. Somatic SNV VAFs are highlighted for each timepoint; SNVs detected in at least two timepoints are shown. SNVs undetected with standard filtering criteria at given timepoints are indicated with a dashed line. Treatment types and intervals are highlighted. Events of disease progression as inferred by computerized tomography (CT) scans are shown.
Fig. 5
Fig. 5. Estimation of ctDNA burden across two distinct cancer types.
a cfDNA relative coverage across the promoter region of the blood-specific gene, RASGRP4 (ENST00000615340). Red and blue curves show the mean of the coverages from plasma samples from CRC and BRCA patients, respectively. b Schematic showing how the ctDNA content prediction model across CRC and BRCA cfDNA samples was developed. c, d Comparison of expected (in silico simulation) and observed ctDNA fractions across CRC and BRCA cfDNA samples in the c training and d test set, respectively. The mean absolute error is listed for each sample. Boxplots represent the median as centreline, the interquartile range (IQR) as bounds of box, and the lower quartile –1.5 IQR and the upper quartile +1.5 IQR as whiskers.

References

    1. Lui YY, et al. Predominant hematopoietic origin of cell-free DNA in plasma and serum after sex-mismatched bone marrow transplantation. Clin. Chem. 2002;48:421–427. doi: 10.1093/clinchem/48.3.421. - DOI - PubMed
    1. Thompson JC, et al. Detection of therapeutically targetable driver and resistance mutations in lung cancer patients by next-generation sequencing of cell-free circulating tumor DNA. Clin. Cancer Res. 2016;22:5772–5782. doi: 10.1158/1078-0432.CCR-16-1231. - DOI - PMC - PubMed
    1. Murtaza M, et al. Non-invasive analysis of acquired resistance to cancer therapy by sequencing of plasma DNA. Nature. 2013;497:108–112. doi: 10.1038/nature12065. - DOI - PubMed
    1. Bettegowda C, et al. Detection of circulating tumor DNA in early-and late-stage human malignancies. Sci. Transl. Med. 2014;6:224ra224–224ra224. doi: 10.1126/scitranslmed.3007094. - DOI - PMC - PubMed
    1. Sausen M, et al. Clinical implications of genomic alterations in the tumour and circulation of pancreatic cancer patients. Nat. Commun. 2015;6:7686. doi: 10.1038/ncomms8686. - DOI - PMC - PubMed

Publication types

Substances