. 2021 Apr 13;12(1):2198.
doi: 10.1038/s41467-021-22522-4.

EFA6B regulates a stop signal for collective invasion in breast cancer

Affiliations

EFA6B regulates a stop signal for collective invasion in breast cancer

Racha Fayad et al. Nat Commun. .

Abstract

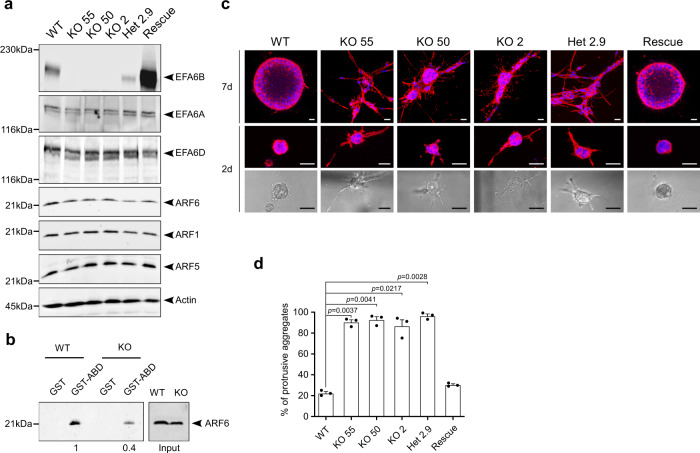
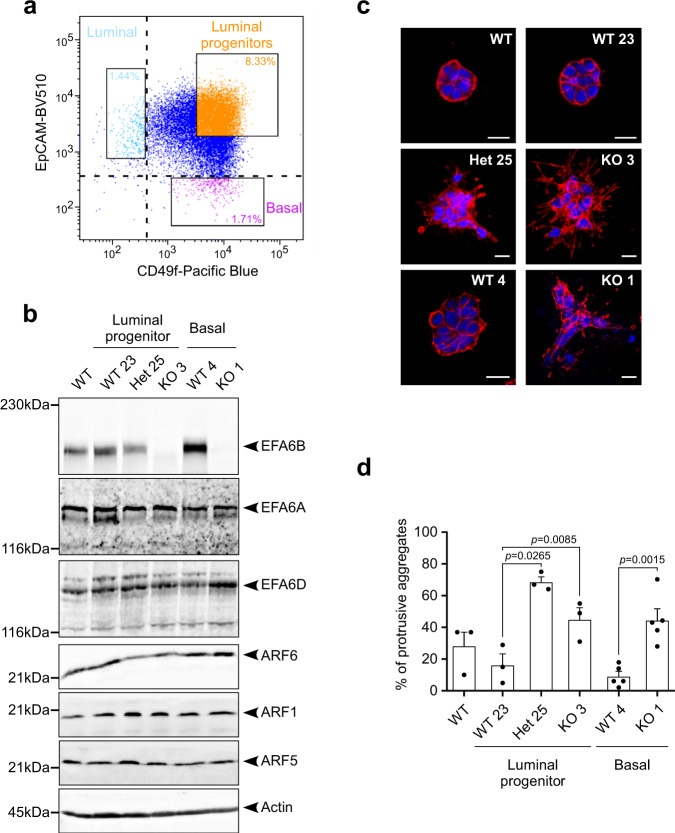
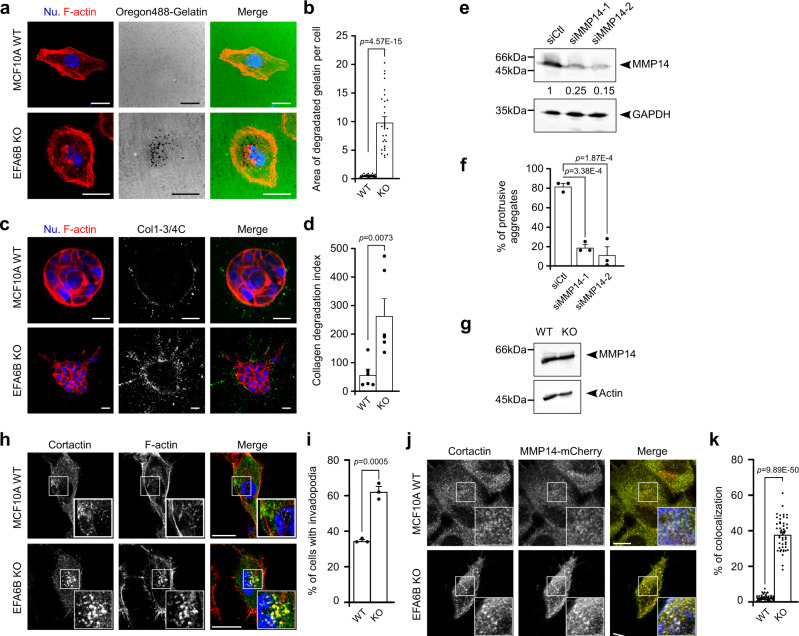
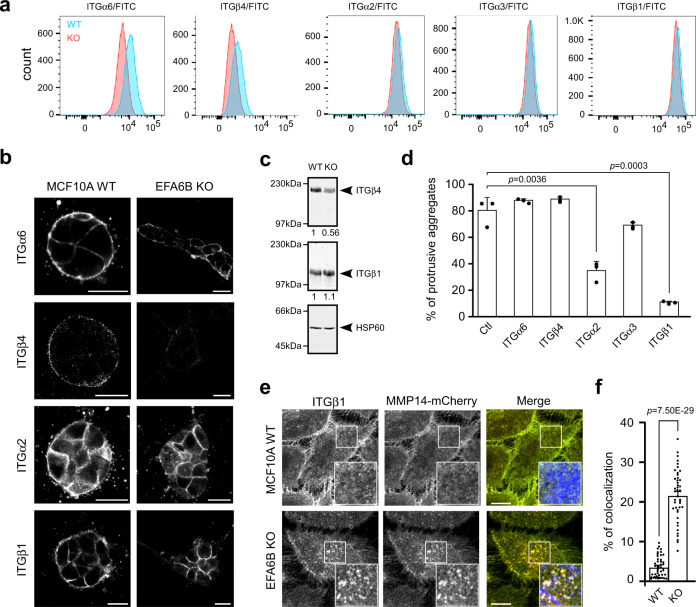
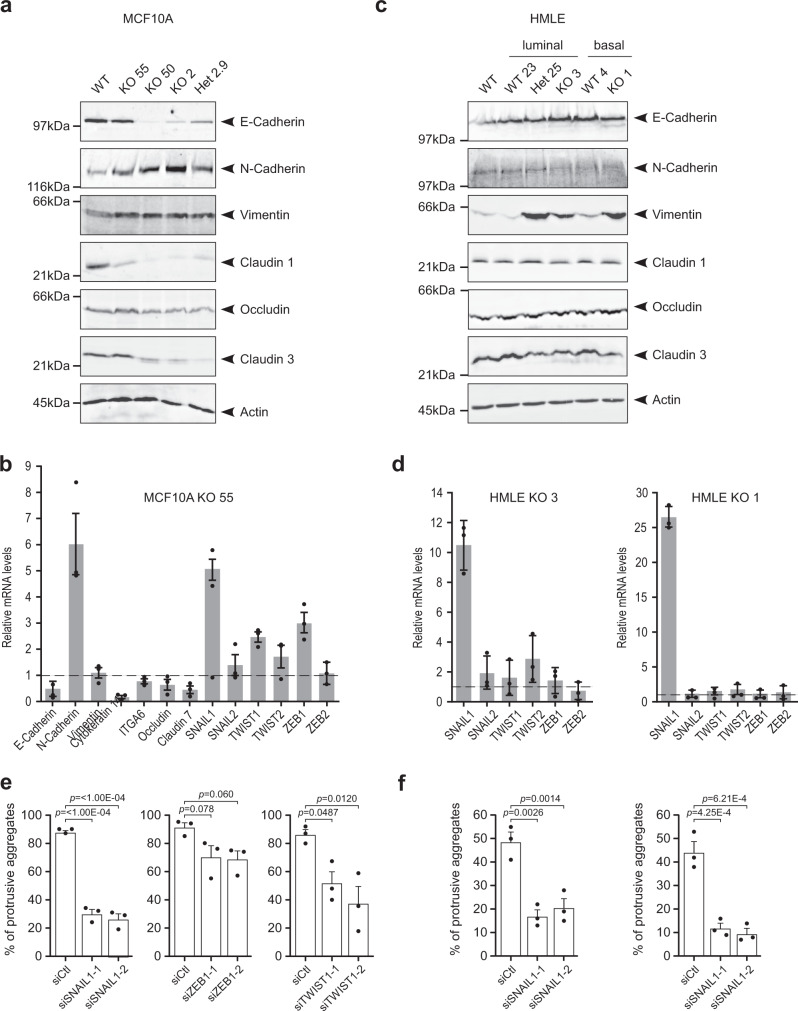
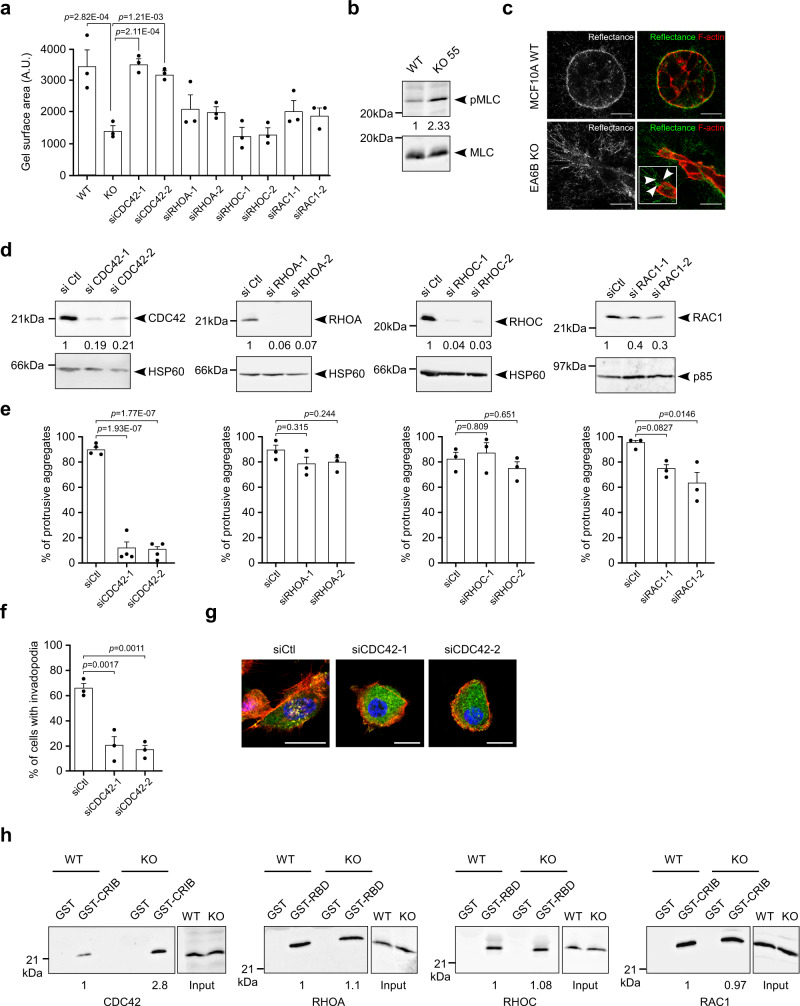
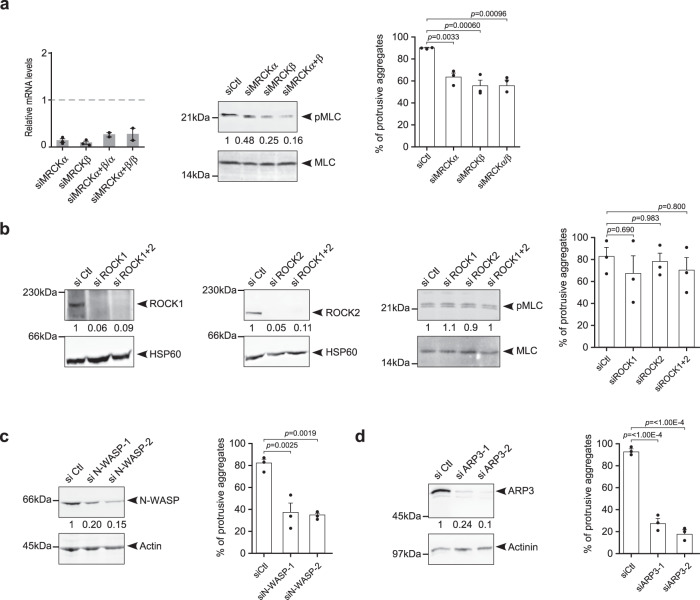
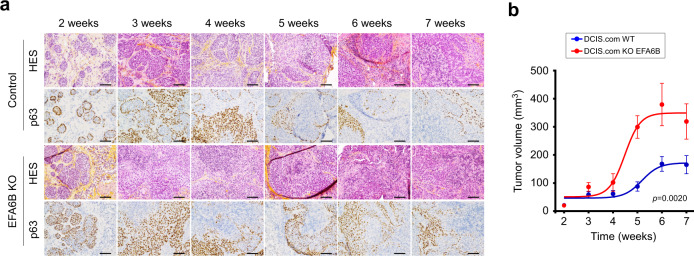
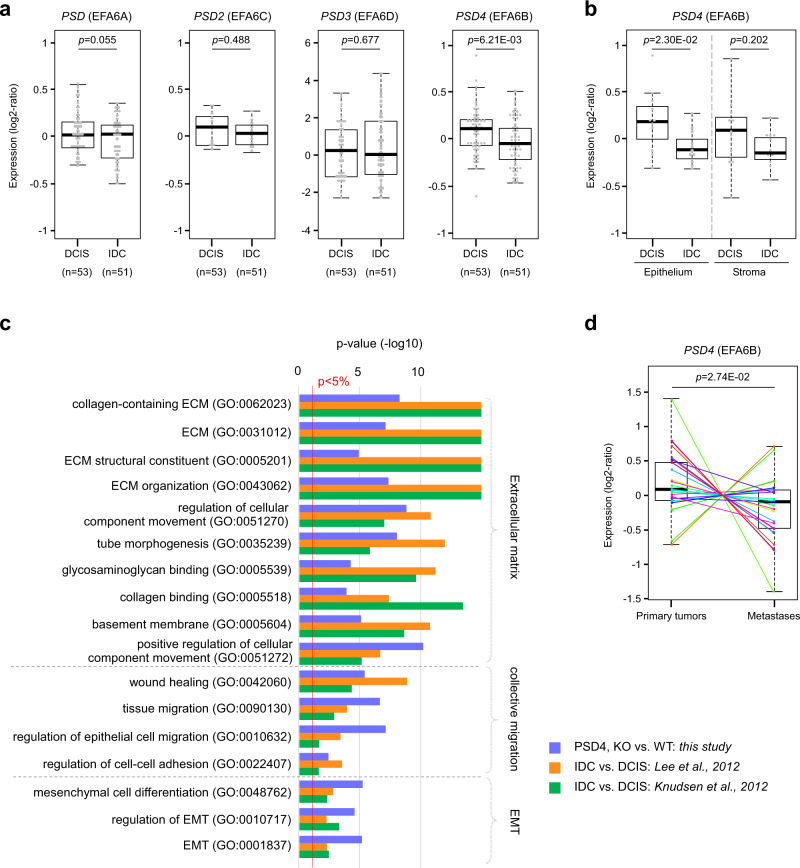
Cancer is initiated by somatic mutations in oncogenes or tumor suppressor genes. However, additional alterations provide selective advantages to the tumor cells to resist treatment and develop metastases. Their identification is of paramount importance. Reduced expression of EFA6B (Exchange Factor for ARF6, B) is associated with breast cancer of poor prognosis. Here, we report that loss of EFA6B triggers a transcriptional reprogramming of the cell-to-ECM interaction machinery and unleashes CDC42-dependent collective invasion in collagen. In xenograft experiments, MCF10 DCIS.com cells, a DCIS-to-IDC transition model, invades faster when knocked-out for EFA6B. In addition, invasive and metastatic tumors isolated from patients have lower expression of EFA6B and display gene ontology signatures identical to those of EFA6B knock-out cells. Thus, we reveal an EFA6B-regulated molecular mechanism that controls the invasive potential of mammary cells; this finding opens up avenues for the treatment of invasive breast cancer.


Conflict of interest statement

The authors declare no competing interests.

Figures

Fig. 1
Fig. 1. CRISPR/Cas9-mediated knock-out of the EFA6B encoding gene PSD4 in MCF10A cells induces collective invasion in collagen I.
a The MCF10A WT, the homozygous EFA6B KO55, KO50, KO2, the heterozygous EFA6B KO2.9 (Het 2.9) and the EFA6B KO55 over-expressing EFA6B-vsvg cells were solubilized and the expression of the indicated proteins was analyzed by immunoblot. Actin served as a loading control. b Lysates of MCF10A WT and EFA6B KO55 cells were reacted with GST or GST-ABD (ARF6GTP-binding domain of ARHGAP10) bound to glutathione-sepharose beads. The whole lysates and bound proteins were analyzed by immunoblotting with an anti-ARF6 antibody. N = 3. c Representative images of the indicated cell aggregates placed in collagen for 7 days (upper panels) or 2 days (middle and bottom panels). The cells were processed for immunofluorescence to label the endogenous F-actin (red) and the nuclei (blue). The bottom panels are bright-field phase-contrast images of the corresponding immunofluorescence images shown in the middle panels. Scale bars 20 μm. d Quantification of the percentage of cell aggregates (n = 100) with invasive protrusions of the indicated MCF10A cell lines grown in collagen for 2 days. N = 3, average ± SEM, one-way ANOVA test with Dunnett’s multiple comparison p-values. Source data are provided as a Source Data file.
Fig. 2
Fig. 2. CRISPR/Cas9-mediated knock-out of the EFA6B encoding gene PSD4 in HMLE luminal and basal populations induces collective invasion in collagen I.
a The cell surface marker EpCAM and CD49f were used to sort three epithelial cell populations including the luminal (light blue), luminal progenitors (orange) and mature basal cells (purple). These cells were immediately processed for CRISPR/Cas9-mediated PSD4 knock-out. b The HMLE WT population, the luminal progenitor clone WT23, heterozygous EFA6B KO25 (Het 25), homozygous EFA6B KO3, and the mature basal clone WT4, homozygous EFA6B KO1 cells were solubilized and the expression of the indicated proteins analyzed by immunoblot. Actin served as a loading control. c Representative images of the indicated cells grown 5 days in collagen I and stained for F-actin (red) and the nuclei (blue). Scale bars 20 μm. d Quantification of the percentage of cell aggregates (n = 100) with invasive protrusions of the indicated cell lines grown in collagen I for 5 days. N = 3 for WT, WT23, Het25, KO3; N = 5 for WT4 and KO1, average ±SEM, paired Student’s t-test p-values are versus WT23 for luminal cell lines and WT4 for basal cell lines. Source data are provided as a Source Data file.
Fig. 3
Fig. 3. EFA6B knock-out stimulates matrices degradation and invasion in an MMP14-dependent manner.
a Representative images of MCF10A WT and EFA6B KO55 cells placed on Oregon488-gelatin (green)-coated coverslips and stained for F-actin (red) and nuclei (Nu., blue). Areas devoid of fluorescent signal indicate degradation of the fluorescent gelatin. Scale bars 20 μm. b Quantification of the gelatin degradation. Values are the mean percentage of degradation area per cell area ± SEM. n = 10, N = 3, Student’s t-test p-value. c Representative images of MCF10A WT and EFA6B KO55 cells grown in collagen I for 3 days and stained for cleaved collagen I with the Col1-3/4C antibody (white in middle panel and green in left merge panel), for F-actin (red) and nuclei (blue). Scale bars 20 μm. d Quantification of collagen degradation. Values are mean degradation index ± SEM. n = 3 aggregates of 30 cells, N = 2, Student’s t-test p-value. e MCF10A WT and EFA6B KO55 cells were transfected with siRNA control or directed against MMP14. 48 h post-transfection the expression of MMP14 was analyzed by immunoblot. GAPDH served as a loading control. N = 3. f Quantification of the percentage of cell aggregates (n = 100) with invasive protrusions of the indicated cell lines grown in collagen I for 2 days. N = 3, one-way ANOVA test with Dunnett’s multiple comparison p-values. g Expression of MMP14 analyzed by immunoblot in MCF10A WT and EFA6B KO55 cells. GAPDH served as a loading control. N = 4. h Representative images of the indicated cells grown 2 days on collagen I-coated coverslips stained for cortactin (green), F-actin (red), and nuclei (blue). The large inset is a 2× zoom-in image of the indicated area. Scale bars 20 μm. i Quantification of the percentage of cells (n = 100) displaying invadopodia, N = 3, average ± SEM, Student’s t-test p-value. j Representative images of the indicated cells grown 2 days on collagen I-coated coverslips stained for cortactin (green), MMP14-mCherry (red), and F-actin (blue). Co-localization of all three markers appears in white. The large inset is a 2× zoom-in image of the indicated area. Scale bars 20 μm. k Quantification of the percentage of cortactin co-localized with MMP14-mCherry. A total of 52 WT cells and 48 KO55 cells from three independent experiments were analyzed, Student’s t-test p-value. Source data are provided as a Source Data file.
Fig. 4
Fig. 4. EFA6B knock-out promotes a change in the ITG repertoire and stimulates the formation of ITGβ1-based invadopodia.
a Cell surface expression of ITG molecules in MCF10A WT (blue) and EFA6B KO55 (red) cells analyzed by FACS. b Representative images of the indicated spheroids grown 2 days in collagen I stained for the indicated ITG. Scale bars 20 μm. c Expression of ITGβ1 and ITGβ4 analyzed by immunoblot in MCF10A WT and EFA6B KO55 cells. HSP60 served as a loading control. N = 3. d Quantification of MCF10A WT and EFA6B KO55 cell aggregates with invasive protrusions incubated in the presence of the control pre-immune serum (Ctl) or the indicated anti-ITG (α-ITG) antibodies for 2 days. Values are percentages of total cell aggregates ± SEM. 300 cell aggregates were analyzed for each cell population in three independent experiments, one-way ANOVA test with Dunnett’s multiple comparison p-values. e Representative images of the indicated cells grown 2 days on collagen I-coated coverslips stained for ITGβ1 (green), MMP14-mCherry (red), and F-actin (blue). Co-localization of all three markers appears in white. The large inset is a 2× zoom-in image of the indicated area. Scale bars 20 μm. f Quantification of the percentage of ITGβ1 co-localized with MMP14-mCherry. A total of 45 WT cells and 42 KO55 cells from three independent experiments were analyzed, Student’s t-test p-value. Source data are provided as a Source Data file.
Fig. 5
Fig. 5. EFA6B knock-out induces the expression of EMT transcription factors that promote collective invasion of MCF10A and HMLE WT cells in collagen I.
a The MCF10A WT, the homozygous EFA6B KO55, KO50, KO2, and the heterozygous EFA6B KO2.9 (Het2.9) cells were solubilized and the expression of the indicated proteins analyzed by immunoblot. Actin served as a loading control. N = 3. Quantification is shown in Supplementary Fig. 3f. b Expression of EMT-associated genes by qPCR analysis in EFA6B KO55 cells normalized to MCF10A WT. N = 3, average ± SEM. c The HMLE WT population, the luminal progenitor clone WT23, heterozygous KO25, homozygous KO3, and the mature basal clone WT4, homozygous KO1 cells were solubilized and the expression of the indicated proteins analyzed by immunoblot. Actin served as a loading control. N = 3. Quantification is shown in Supplementary Fig. 3f. d Expression of EMT-TF genes by qPCR analysis in EFA6B KO3 and KO1 cells normalized to their respective HMLE control cells WT23 and WT4. N = 3, average ± SD. e Quantification of the percentage of aggregates (n = 100) with invasive protrusions of MCF10A KO55 cells grown in collagen I for 2 days after transfection with the indicated siRNAs. N = 3, average ± SEM, one-way ANOVA test with Dunnett’s multiple comparison p-values. f Quantification of the percentage of aggregates (n = 100) with invasive protrusions of HMLE KO3 (left) and KO1 (right) cells grown in collagen I for 2 days after transfection with the SNAIL1 targeted siRNAs. N = 3, average ± SEM, one-way ANOVA test with Dunnett’s multiple comparison p-values. Source data are provided as a Source Data file.
Fig. 6
Fig. 6. EFA6B knock-out stimulates cellular contractility and invasion through CDC42.
a Quantification of the contractility of MCF10A WT (WT) and EFA6B KO55 (KO) cells transfected with a control siRNA, and EFA6B KO55 cells transfected with the indicated siRNA evaluated by a collagen gel contraction assay. Values are the mean surface area of the collagen gel ± SEM. N = 3, one-way ANOVA test with Dunnett’s multiple comparison p-values calculated versus KO55. b Expression of pMLC (phospho-myosin light chain) and total MLC (myosin light chain) analyzed by immunoblot in MCF10A WT and EFA6B KO55 cells, N = 4. c Representative images of the MCF10A WT and EFA6B KO55 spheroids embedded 2 days in collagen I stained for F-actin (red). The organization of the collagen I fibers surrounding the cell aggregates were imaged by confocal reflectance microscopy (green). The large inset is a 2× zoom-in image of the leader cell. Arrowheads point to thin membrane extensions co-localized with collagen fibers. Scale bars 20 μm. d Two days post-transfection of EFA6B KO55 cells with the indicated siRNAs, the expression of the corresponding protein was analyzed by immunoblot and quantified, N = 3. HSP60 and p85 served as loading controls. e Quantification of the percentage of aggregates (n = 100) with invasive protrusions of EFA6B KO55 cells grown in collagen I for 2 days after transfection with the indicated siRNAs. N = 4 for siCDC42 and N = 3 for siRHOA, siRHOC, siRAC, average ± SEM, one-way ANOVA test with Dunnett’s multiple comparison p-values. f Quantification of the percentage of invadopodia in EFA6B KO55 cells (n = 30) grown in collagen I for 2 days after transfection with CDC42 targeted siRNAs. N = 3, average ±SEM, one-way ANOVA test with Dunnett’s multiple comparison p-values. g Representative images of EFA6B KO55 cells transfected with the indicated siRNAs and stained for cortactin (green), F-actin (red), and nuclei (blue). Scale bars 20 μm. h Lysates of MCF10A WT and EFA6B KO55 cells were reacted with GST, GST-CRIB (CDC42GTP- and RAC1GTP-interacting domain of PAK) or GST-RBD (RHOAGTP- and RHOCGTP-binding domain of rhotekin) prebound to glutathione-sepharose beads. The whole lysates and bound proteins were analyzed by immunoblot with the indicated antibodies, N = 3. Source data are provided as a Source Data file.
Fig. 7
Fig. 7. EFA6B knock-out stimulates cellular contractility and invasion through two CDC42-dependent signaling pathways: CDC42-MRCK-pMLC and CDC42-N-WASP-ARP2/3.
a Left: expression of MRCKα and MRCKβ (myotonic dystrophy kinase-related Cdc42-binding kinase) genes in EFA6B KO55 cells analyzed by qPCR 2 days post-transfection with the indicated siRNAs. siMRCKα+β/α and siMRCKα+β/β indicate the gene expression level of MRCKα or MRCKβ after transfection with siRNAs against both MRCKs, N = 3 for single siRNA and N = 2 for combined siRNA. Middle: expression of pMLC and total MLC analyzed by immunoblot 2 days post-transfection of EFA6B KO55 cells with the indicated siRNAs. Right: quantification of the percentage of aggregates with invasive protrusions of EFA6B KO55 cells grown in collagen I for 2 days post-transfection with the indicated siRNAs. N = 3, average ±SEM, one-way ANOVA test with Dunnett’s multiple comparison p-values. b Expression of the indicated proteins analyzed by immunoblot two days post-transfection of EFA6B KO55 cells with the indicated siRNAs. ROCK: Rho-associated protein kinase. HSP60 served as a loading control. Right panel: quantification of the percentage of aggregates with invasive protrusions of EFA6B KO55 cells grown in collagen I for 2 days after transfection with the indicated siRNAs. N = 3, average ± SEM, one-way ANOVA test with Dunnett’s multiple comparison p-values. c Left: expression of N-WASP (Neural Wiskott–Aldrich Syndrome Protein) analyzed by immunoblot two days post-transfection of EFA6B KO55 cells with N-WASP targeted siRNAs. Actin served as a loading control. Right: quantification of the percentage of aggregates (n = 100) with invasive protrusions of EFA6B KO55 cells grown in collagen I for 2 days after transfection with N-WASP-directed siRNAs. N = 3, average ± SEM, one-way ANOVA test with Dunnett’s multiple comparison p-values. d Left: expression of ARP3 (Actin Related Protein 3) analyzed by immunoblot 2 days post-transfection of EFA6B KO55 cells with ARP3-targeted siRNAs. Actinin served as a loading control. Right: quantification of the percentage of aggregates (n = 100) with invasive protrusions of EFA6B KO55 cells grown in collagen I for 2 days after transfection with ARP3-targeted siRNAs. N = 3, average ± SEM, one-way ANOVA test with Dunnett’s multiple comparison p-values. Source data are provided as a Source Data file.
Fig. 8
Fig. 8. EFA6B KO in DCIS.com cells stimulates tumor growth and invasion.
a Representative images of HES (hematoxylin–eosin–saffron) coloration and p63 immunohistochemistry staining of the indicated tumor xenograft at the indicated time. Scale bar, 100 μm. b Tumor xenograft curve average ± SEM of WT (blue) and KO EFA6B (red) DCIS.com cells. n = 4 except at 4 weeks n = 6 for WT, n = 5 for KO 55. Two-way ANOVA p-value. Source data are provided as a Source Data file.
Fig. 9
Fig. 9. EFA6B/PSD4 expression is downregulated in human clinical BC samples endowed with invasive properties.
a Expression of the four EFA6 gene isoforms in DCIS (ductal carcinoma in situ) compared to IDC (invasive ductal carcinoma). The p-values are for the Student’s t-test. b Expression of PSD4 is selectively decreased in the epithelial compartment of DCIS (n = 11). The p-values are for the Student’s t-test. c Ontologies associated with PSD4 knock-out in MCF10A cells (blue), and with the comparison of expression profiles of IDC versus DCIS samples in the Lee’s (orange) and Knudsen’s (green) data sets,. d Expression of PSD4 is decreased in the metastatic samples versus the paired primary BC samples (n = 29). The corresponding primary BC–metastasis pairs are connected by thin colored lines. The p-value is for the paired Mann–Whitney test. Source data are provided as a Source Data file.

References

    1. Bray F, et al. Global cancer statistics 2018: GLOBOCAN estimates of incidence and mortality worldwide for 36 cancers in 185 countries. CA Cancer J. Clin. 2018;68:394–424. doi: 10.3322/caac.21492. - DOI - PubMed
    1. Friedl P, Locker J, Sahai E, Segall JE. Classifying collective cancer cell invasion. Nat. Cell Biol. 2012;14:777–783. doi: 10.1038/ncb2548. - DOI - PubMed
    1. Bracke ME, et al. Action mechanisms of anti-invasive agents. Anticancer Res. 1986;6:1273–1277. - PubMed
    1. Nelson CM, Bissell MJ. Of extracellular matrix, scaffolds, and signaling: tissue architecture regulates development, homeostasis, and cancer. Annu. Rev. Cell Dev. Biol. 2006;22:287–309. doi: 10.1146/annurev.cellbio.22.010305.104315. - DOI - PMC - PubMed
    1. Friedl P, Alexander S. Cancer invasion and the microenvironment: plasticity and reciprocity. Cell. 2011;147:992–1009. doi: 10.1016/j.cell.2011.11.016. - DOI - PubMed

Publication types

Substances