. 2021 Apr 13;11(1):8020.
doi: 10.1038/s41598-021-87434-1.

AD Course Map charts Alzheimer's disease progression

Affiliations

AD Course Map charts Alzheimer's disease progression

Igor Koval et al. Sci Rep. .

Abstract

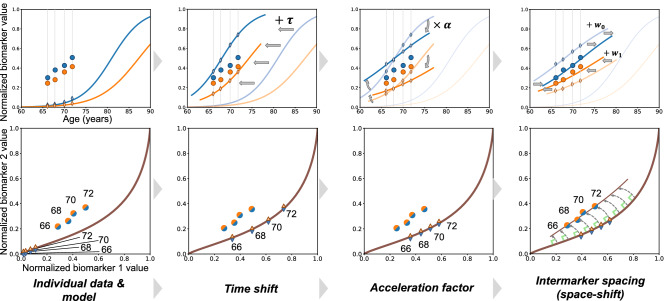
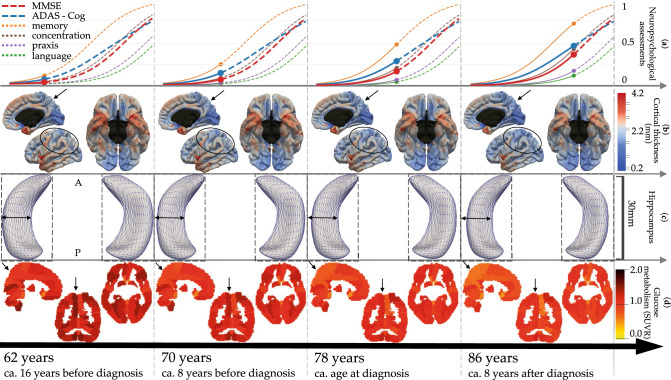
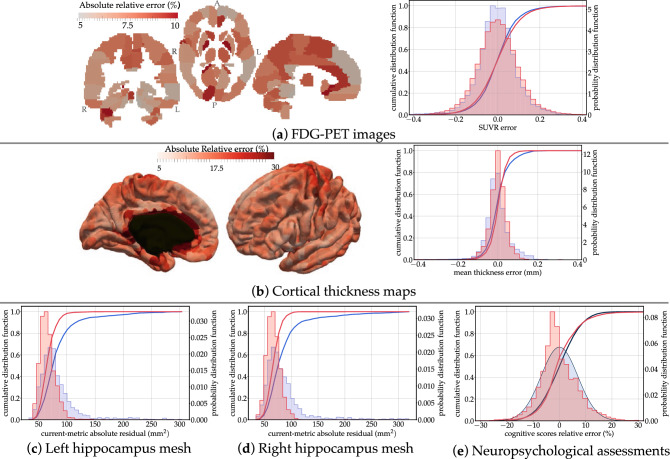
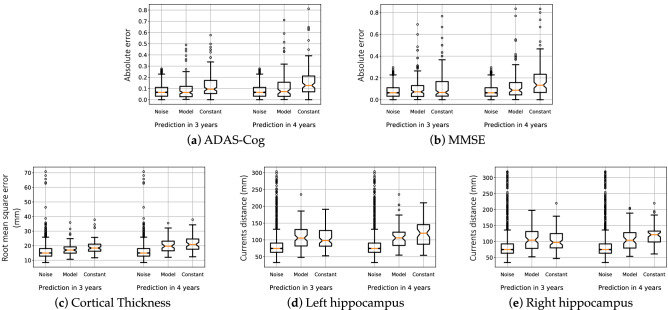
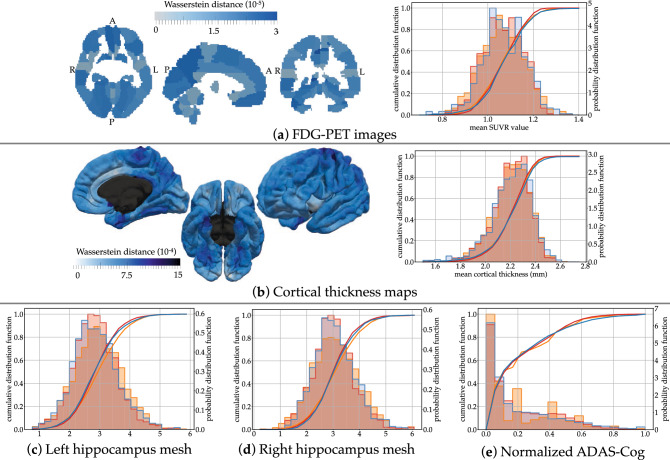
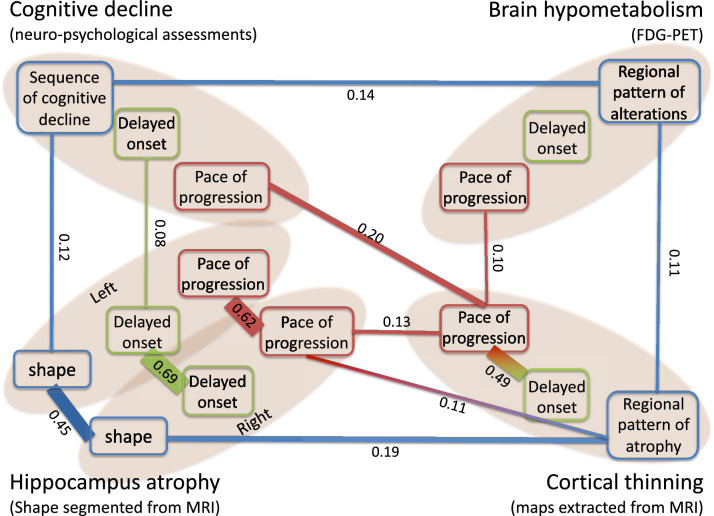
Alzheimer's disease (AD) is characterized by the progressive alterations seen in brain images which give rise to the onset of various sets of symptoms. The variability in the dynamics of changes in both brain images and cognitive impairments remains poorly understood. This paper introduces AD Course Map a spatiotemporal atlas of Alzheimer's disease progression. It summarizes the variability in the progression of a series of neuropsychological assessments, the propagation of hypometabolism and cortical thinning across brain regions and the deformation of the shape of the hippocampus. The analysis of these variations highlights strong genetic determinants for the progression, like possible compensatory mechanisms at play during disease progression. AD Course Map also predicts the patient's cognitive decline with a better accuracy than the 56 methods benchmarked in the open challenge TADPOLE. Finally, AD Course Map is used to simulate cohorts of virtual patients developing Alzheimer's disease. AD Course Map offers therefore new tools for exploring the progression of AD and personalizing patients care.


Conflict of interest statement

A patent has been filed by INSERM Transfer under the reference PCT/IB2016/052699 and is currently under investigation (inventors: J.-B. Schiratti, S. Allassonnière, O. Colliot, S. Durrleman). SD received a Sanofi iDEA award from Sanofi for a collaborative research project. SE is a member of the advisory board and/or does consulting for the following companies: Eli Lilly, Roche, Astellas Pharma, Biogen and GE Healthcare. The authors declare that they have no other competing financial interests.

Figures

Figure 1
Figure 1
Disease course mapping for two biomarker data. Top left panel: the model as plain curves and repeated data of one subject. x-axis is age in years and y-axis is the normalized values of the biomarkers. Top row, three left panels: the three operations used to mapping the model to the individual data: the time-shift translates the curves, the acceleration factor scales the abscissa, the space-shifts change the time interval between both curves. Bottom row shows another representation of the same data as parametric curves. Panels plot the values of one biomarker versus the other one, time being the parameter. Data fall within a unit square, which is a particular case of a Riemannian manifold. The model is a geodesic curve and the transformed curve is a change in the parametric representation of the geodesic followed by exp-parallelisation, a generalisation of translation on manifolds. This construction for two biomarker data extends therefore to any kind of data on a Riemannian manifold.
Figure 2
Figure 2
Normative models of Alzheimer’s disease progression shown at 4 Alzheimer Age with estimated time until/from diagnosis. Bottom to top rows show alteration of brain glucose metabolism, hippocampus atrophy, cortical thinning and onset of cognitive decline. Black arrows and ellipses indicate some areas of great changes. Images were obtained using the freely available software FSLeyes v.0.22.6 (https://fsl.fmrib.ox.ac.uk/fsl/fslwiki/FSLeyes) and Paraview v.5.2.0 (www.paraview.org).
Figure 3
Figure 3
Distributions of reconstruction errors. The empirical distribution of errors (red) is superimposed with the estimated distribution of test / re-test differences (in blue). The absolute relative error is shown in every brain region for FDG-PET images and cortical thickness maps. Mean and standard errors are given in Supplementary Table S1. Images were obtained using the freely available software FSLeyes v.0.22.6 (https://fsl.fmrib.ox.ac.uk/fsl/fslwiki/FSLeyes) and Paraview v.5.2.0 (www.paraview.org).
Figure 4
Figure 4
Prediction errors at the individual level 3 and 4 years ahead of time. Box-plots show medians in orange, quartiles, and 95% confidence intervals for three image data and the ADAS-Cog. Distributions of prediction errors are compared with that of the noise and the errors of the constant prediction.
Figure 5
Figure 5
Statistics of the virtual cohort. Superimposition of empirical distributions for simulated data (blue), reconstructed errors (red, as in Fig. 3) and real data (orange). Images were obtained using the freely available software FSLeyes v.0.22.6 (https://fsl.fmrib.ox.ac.uk/fsl/fslwiki/FSLeyes) and Paraview v.5.2.0 (www.paraview.org).
Figure 6
Figure 6
Graph of conditional correlations among individual parameters. An edge is shown between two parameters if there is a significant correlation between them given all other parameters. The width of the edge is proportional to the value of the conditional correlation, which is also reported on the edge. The color of the parameter denotes its type and its position the modality. The image was obtained using the software Microsoft PowerPoint v.16.43.

References

    1. Fitzmaurice, G., Laird, N. & Ware, J. Applied longitudinal analysis 2nd edn. (John Wiley and sons, 2011).
    1. Durrleman, S., Pennec, X., Trouvé, A., Gerig, G. & Ayache, N. Spatiotemporal atlas estimation for developmental delay detection in longitudinal datasets. In Medical Image Computing and Computer-Assisted Intervention - MICCAI 2009, vol. 5761 of Lecture Notes in Computer Science (eds Yang, G.-Z. et al.) 297–304 (Springer, Berlin, 2009). - PMC - PubMed
    1. Durrleman S, et al. Toward a comprehensive framework for the spatiotemporal statistical analysis of longitudinal shape data. Int. J. Comput. Vis. 2013;103:22–59. doi: 10.1007/s11263-012-0592-x. - DOI - PMC - PubMed
    1. Donohue MC, et al. Estimating long-term multivariate progression from short-term data. Alzheimer’s & Dementia J. Alzheimer’s Assoc. 2014;10:S400–410. doi: 10.1016/j.jalz.2013.10.003. - DOI - PMC - PubMed
    1. Taddé BO, Jacqmin-Gadda H, Dartigues J, Commenges D, Proust-Lima C. Dynamic modeling of multivariate dimensions and their temporal relationships using latent processes: application to alzheimer’s disease. Biometrics. 2020;76:886–899. doi: 10.1111/biom.13168. - DOI - PubMed

Publication types