

Medical records-based chronic kidney disease phenotype for clinical care and "big data" observational and genetic studies
- PMID: 33850243
- PMCID: PMC8044136
- DOI: 10.1038/s41746-021-00428-1
Medical records-based chronic kidney disease phenotype for clinical care and "big data" observational and genetic studies
Abstract
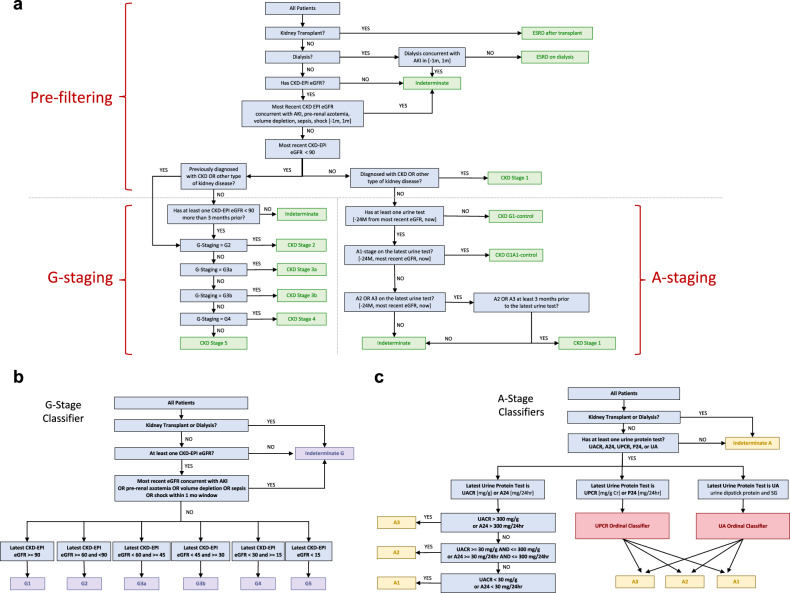
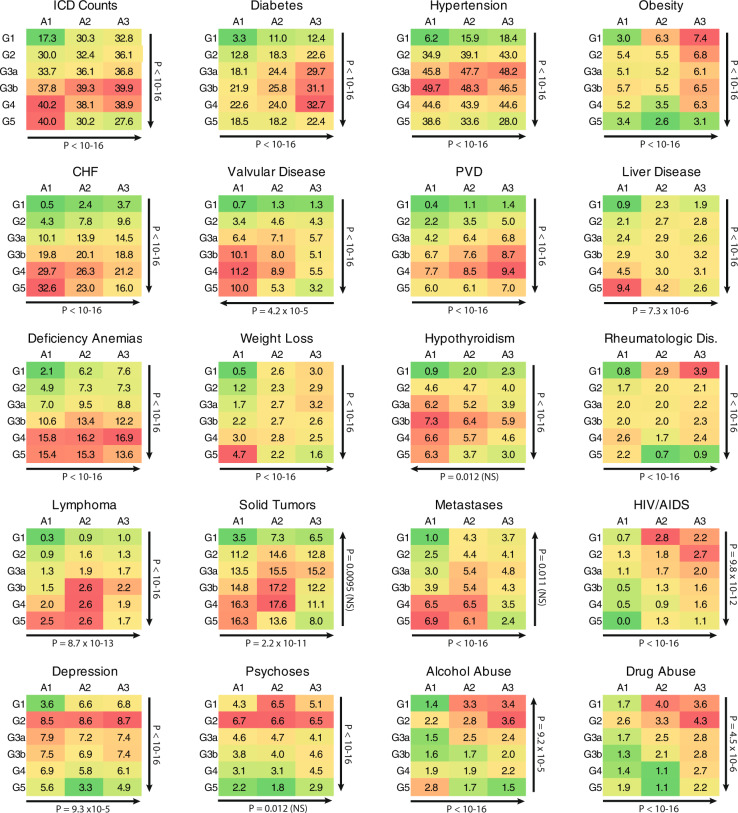
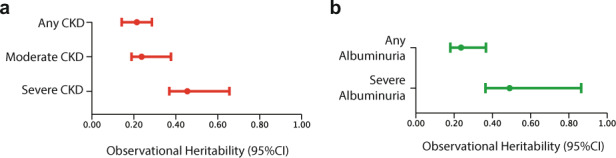
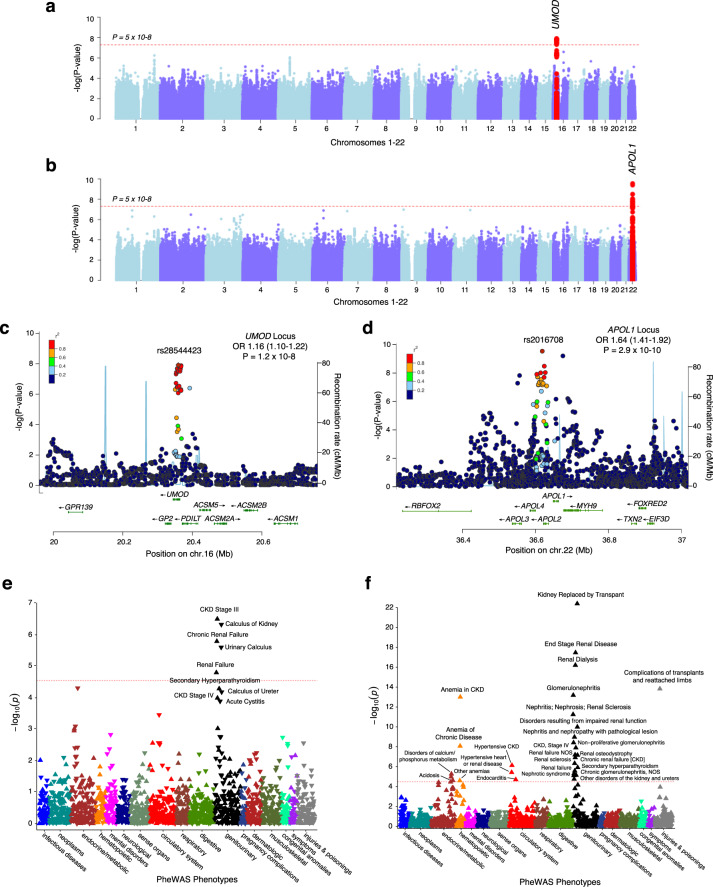
Chronic Kidney Disease (CKD) represents a slowly progressive disorder that is typically silent until late stages, but early intervention can significantly delay its progression. We designed a portable and scalable electronic CKD phenotype to facilitate early disease recognition and empower large-scale observational and genetic studies of kidney traits. The algorithm uses a combination of rule-based and machine-learning methods to automatically place patients on the staging grid of albuminuria by glomerular filtration rate ("A-by-G" grid). We manually validated the algorithm by 451 chart reviews across three medical systems, demonstrating overall positive predictive value of 95% for CKD cases and 97% for healthy controls. Independent case-control validation using 2350 patient records demonstrated diagnostic specificity of 97% and sensitivity of 87%. Application of the phenotype to 1.3 million patients demonstrated that over 80% of CKD cases are undetected using ICD codes alone. We also demonstrated several large-scale applications of the phenotype, including identifying stage-specific kidney disease comorbidities, in silico estimation of kidney trait heritability in thousands of pedigrees reconstructed from medical records, and biobank-based multicenter genome-wide and phenome-wide association studies.
Conflict of interest statement
The authors declare no competing interests.
Figures
References
-
- Centers for Disease Control and Prevention. Chronic Kidney Disease (CKD) Surveillance Project website. https://nccd.cdc.gov/CKD.
-
- United States Renal Data System (USRDS) 2018 Annual Data Report. www.usrds.org.
Grants and funding
- U01 HG008676/HG/NHGRI NIH HHS/United States
- R01 DK105124/DK/NIDDK NIH HHS/United States
- U01 HG008672/HG/NHGRI NIH HHS/United States
- U01 HG008684/HG/NHGRI NIH HHS/United States
- U01 HG008679/HG/NHGRI NIH HHS/United States
- U54 MD007593/MD/NIMHD NIH HHS/United States
- U01 HG008680/HG/NHGRI NIH HHS/United States
- U01 HG008673/HG/NHGRI NIH HHS/United States
- U01 HG008685/HG/NHGRI NIH HHS/United States
- U01 HG008664/HG/NHGRI NIH HHS/United States
- U24 DK114886/DK/NIDDK NIH HHS/United States
- R01 LM013061/LM/NLM NIH HHS/United States
- R01 LM006910/LM/NLM NIH HHS/United States
- U01 HG008657/HG/NHGRI NIH HHS/United States
- U01 HG008666/HG/NHGRI NIH HHS/United States
- UH3 DK114926/DK/NIDDK NIH HHS/United States
- U01 HG006379/HG/NHGRI NIH HHS/United States
- RC2 DK116690/DK/NIDDK NIH HHS/United States
- UL1 TR001873/TR/NCATS NIH HHS/United States
LinkOut - more resources
Full Text Sources
Other Literature Sources
