. 2021 Apr 13;4(1):469.
doi: 10.1038/s42003-021-01991-9.

Variation in personality can substitute for social feedback in coordinated animal movements

Affiliations

Variation in personality can substitute for social feedback in coordinated animal movements

Isaac Planas-Sitjà et al. Commun Biol. .

Abstract

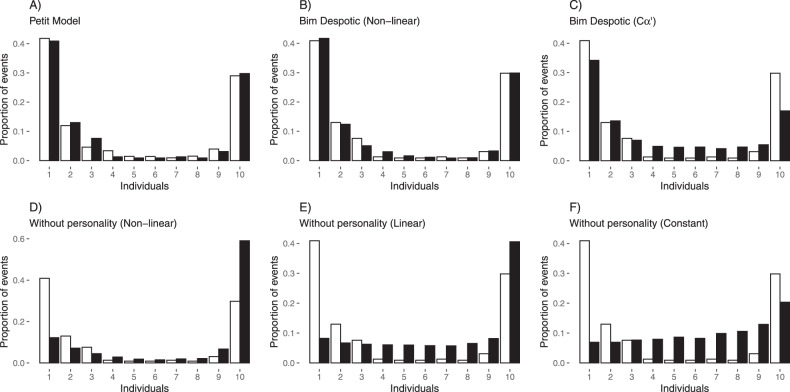
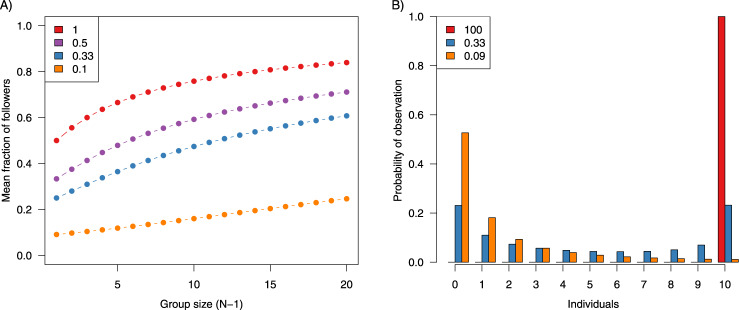
Collective movements are essential for the effective function of animal societies, but are complicated by the need for consensus among group members. Consensus is typically assumed to arise via feedback mechanisms, but this ignores inter-individual variation in behavioural tendency ('personality'), which is known to underpin the successful function of many complex societies. In this study, we use a theoretical approach to examine the relative importance of personality and feedback in the emergence of collective movement decisions in animal groups. Our results show that variation in personality dramatically influences collective decisions and can partially or completely replace feedback depending on the directionality of relationships among individuals. The influence of personality increases with the exaggeration of differences among individuals. While it is likely that both feedback and personality interact in nature, our findings highlight the potential importance of personality in driving collective processes.


Conflict of interest statement

The authors declare no competing interests.

Figures

Fig. 1
Fig. 1. Flow diagram of the model and examples of bimodality index.
A Flow diagram of the model. In the decision nodes, dark-grey = no; white = yes. Initiator (black) starts a movement by departing from the group, and other monkeys (grey) can either join the movement or remain with the rest of the group. B Four examples of bimodality index (BI) for the probability distribution of the number of individuals following a given initiation. Higher index values indicate higher degrees of bimodality, and a BI of zero means that some of the prerequisites are not met (see methods). The U-shaped response arises because initiations typically either fail when they are not joined, or succeed when joined by all group members, while responses in between these extremes are rare.
Fig. 2
Fig. 2. Summary of the components of our full-factorial simulation analysis.
Perspective determines whether the propensity for potential followers to join a movement depends on the personality of the initiator (despotic) or their own personality (democratic). Personality distribution defines the distribution of personality types in the group. Cancellation type models how an initiator’s propensity to give up depends on the number of followers.
Fig. 3
Fig. 3. Scenarios where a bimodal distribution of the number of responders was produced under the Uni condition.
Scenarios where a bimodality was produced under A despotic or B democratic scenario, depending on the cancellation type (y-axis) and the range of difference in α’ values (x-axis). The first column of the x-axis corresponds to the control simulation without personality as α’ = 160 for all individuals. For the following columns the minimum value of α’ = 10 and the maximum value of the distribution is given by x-axis. The probability of joining per second (one timestep) is equal to 1/α’. The colour scale indicates the bimodality index (see Methods for computation details); the higher the index, the higher the degree of bimodality (see also Supplementary Figs. S3 and S6).
Fig. 4
Fig. 4. Scenarios where a bimodal distribution of the number of responders was produced under the Bim condition.
Scenarios where bimodality was produced under A despotic and B democratic scenarios. Y-axis indicates the cancellation type and the x-axis is the range of difference in α’ values. For each condition, we show results for simulations with 1, 5 or 9 leaders (see Supplementary Figs. S2 and S5 for more results). The first column of each graph corresponds to the control simulation without personality as α’ = 160 for all individuals. For the following columns the mean of the low α’ distribution was fixed at 160, while the mean of the highest α’ distribution is shown on the x-axis. The probability of joining per second (one timestep) is equal to 1/α’. The colour scale indicates the bimodality index (see Methods for computation details); the higher the index, the higher the degree of bimodality (see also Supplementary Figs. S1 and S4 and Supplementary Movies 1 and 2).
Fig. 5
Fig. 5. Manhattan distance between the distribution of the number of individuals involved in each initiation generated by our simulations and the one observed in the field for a group of Capuchin monkeys.
The Manhattan distance was obtained by computing the difference between field and simulation data for each bar of the histogram showing the number of individuals moving in each initiation. The lower the index of Manhattan distance, the greater the agreement between both distributions. A Results under a despotic scenario and Uni condition and B under a democratic scenario and Uni condition, both considering non-linear, linear, constant, and Cα’ types of cancellation rate (y-axis). The first column of the x-axis corresponds to the control simulation without personality as α’ = 160 for all individuals. For the following columns the minimum value of α’ = 10 and the maximum value of the distribution is given by the x-axis. The probability of joining per second (one timestep) is equal to 1/α’.
Fig. 6
Fig. 6. Manhattan distance between the distribution of the number of individuals involved in each initiation generated by our simulations and the one observed in the field for a group of Capuchin monkeys.
The Manhattan distance was obtained by computing the difference between field and simulation data for each bar of the histogram. The lower the index of Manhattan distance, the greater the agreement between both distributions. A Results under a despotic scenario and Bim condition and B under a democratic scenario and Bim condition, both considering non-linear, linear, constant and Cα’ types of cancellation rate. The y-axis indicates the number of leaders (number of individuals drawn from the lowest α’ distribution) within a group. The first column of the x-axis corresponds to the control simulation without personality as α’ = 160 for all individuals. For the following columns the mean of the low α’ distribution was fixed at 160, while the mean of the highest α’ distribution is given by x-axis. The probability of joining per second (one timestep) is equal to 1/α’.
Fig. 7
Fig. 7. Distributions of individuals involved in each initiation for key simulations.
Comparison of distributions of individuals involved in each initiation for key simulations (black bars) versus field data of Capuchin monkeys (white bars). A corresponds to the Petit model, including feedback on PC and PJ; B Bim–despotic scenario, with non-linear feedback, ratio of 5:5 leaders:followers and mean of the highest α’ distribution of 3160; C Bim–despotic scenario, with Cα’ cancellation rate, ratio of 6:4 leaders:followers and mean of the highest α’ distribution of 960. Scenarios without personality are depicted with D non-linear, E linear and F constant feedback.
Fig. 8
Fig. 8. Results from the analytical model.
A Relationship between the mean fraction of followers (number of followers/(N – 1)) and group size (N – 1) for different values of PJ/PC0. B Probability of obtaining i followers (individuals) considering a group with ten potential followers (N – 1 = 10). In both figures, colours indicate the ratio PJ/PC0.

Similar articles

Cited by

References

    1. Boinski, S. & Garber, P. A. On the Move: How and Why Animals Travel in Groups (University of Chicago Press, 2000).
    1. Amé J-M, Halloy J, Rivault C, Detrain C, Deneubourg JL. Collegial decision making based on social amplification leads to optimal group formation. Proc. Natl Acad. Sci. USA. 2006;103:5835–5840. doi: 10.1073/pnas.0507877103. - DOI - PMC - PubMed
    1. Bonabeau E, Theraulaz G, Deneubourg J-L, Aron S, Camazine S. Self-organization in social insects. TREE. 1997;12:188–193. - PubMed
    1. Camazine, S. et al. Self-Organization in Biological Systems (Princeton University Press, 2001).
    1. Conradt L, Roper TJ. Democracy in animals: the evolution of shared group decisions. Proc. R. Soc. B Biol. Sci. 2007;274:2317–2326. doi: 10.1098/rspb.2007.0186. - DOI - PMC - PubMed

Publication types

LinkOut - more resources