

An algorithm for the robust estimation of the COVID-19 pandemic's population by considering undetected individuals
- PMID: 33850338
- PMCID: PMC8030733
- DOI: 10.1016/j.amc.2021.126273
An algorithm for the robust estimation of the COVID-19 pandemic's population by considering undetected individuals
Abstract
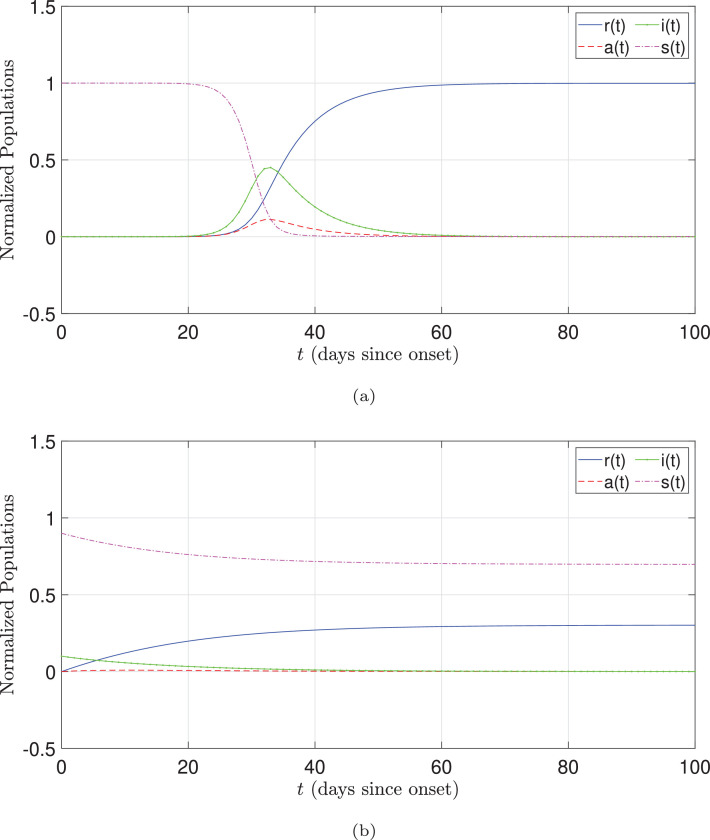
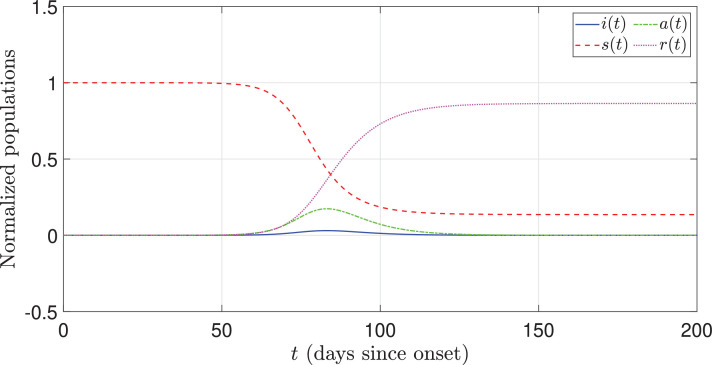
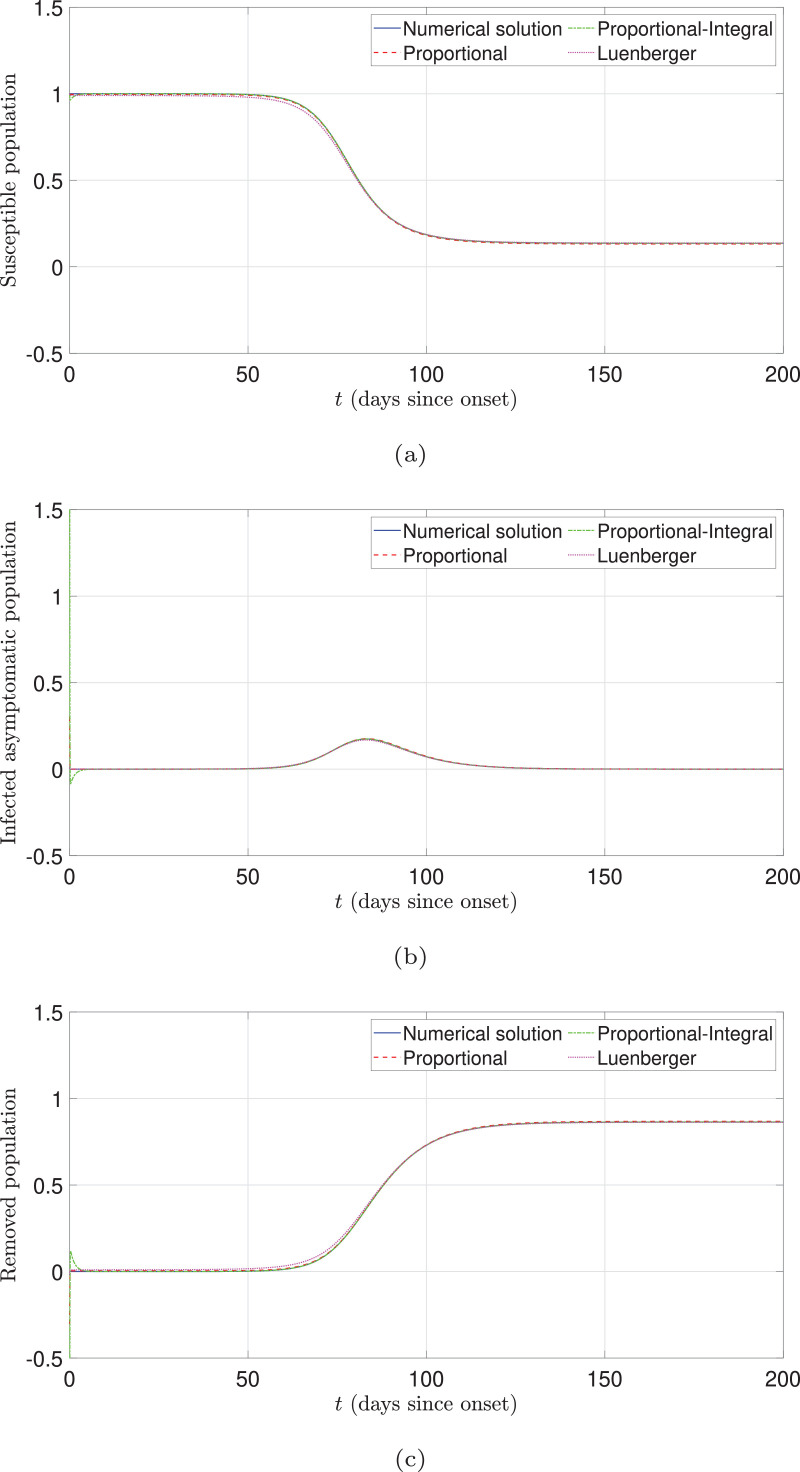
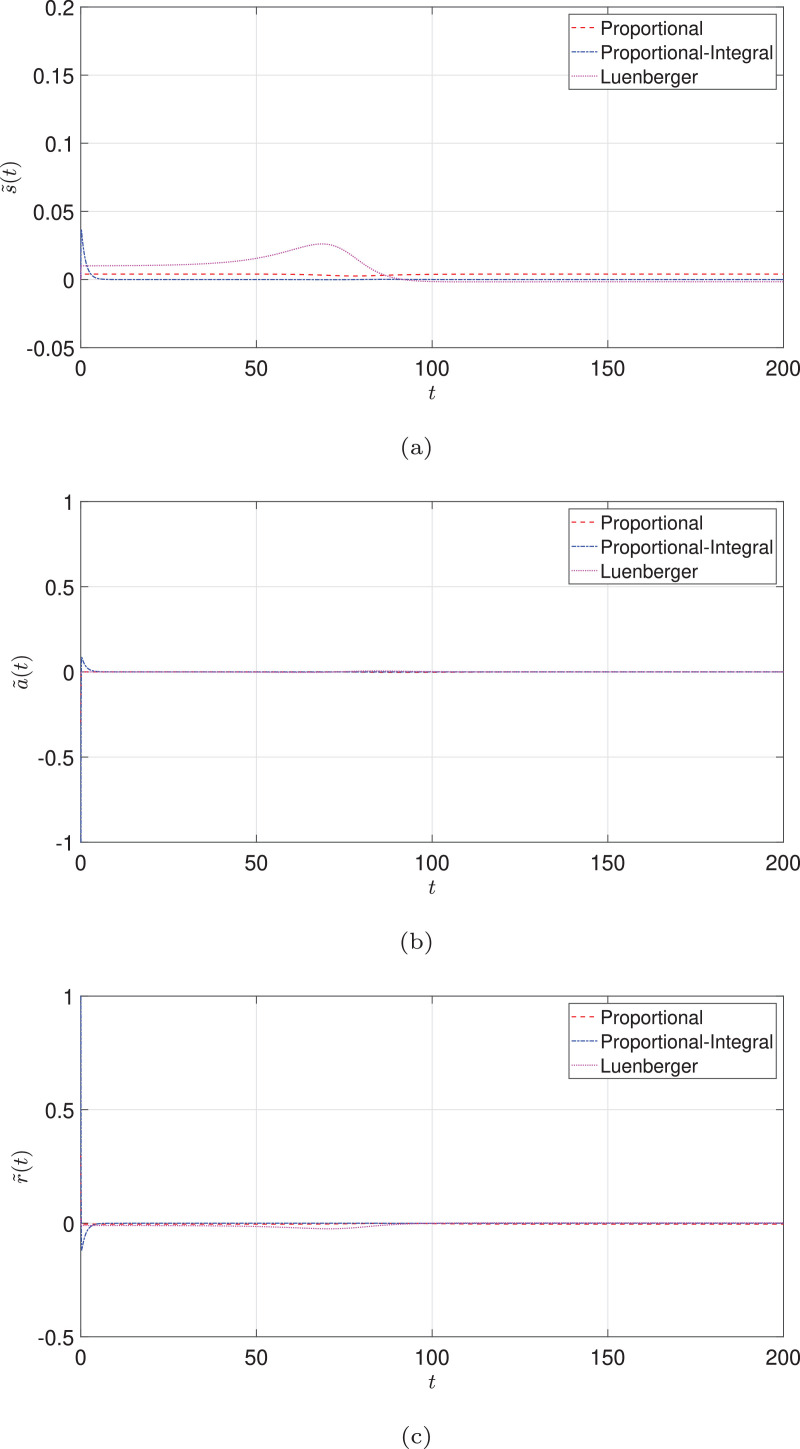
Due to the current COVID-19 pandemic, much effort has been put on studying the spread of infectious diseases to propose more adequate health politics. The most effective surveillance system consists of doing massive tests. Nonetheless, many countries cannot afford this class of health campaigns due to limited resources. Thus, a transmission model is a viable alternative to study the dynamics of the pandemic. The most used are the Susceptible, Infected and Removed type models (SIR). In this study, we tackle the population estimation problem of the A-SIR model, which takes into account asymptomatic or undetected individuals. By means of an algebraic differential approach, we design a model-free (no copy system) reduced-order estimation algorithm (observer) to determine the different non-measured population groups. We study two types of estimation algorithms: Proportional and Proportional-Integral. Both shown fast convergence speed, as well as a minimal estimation error. Additionally, we introduce random fluctuations in our analysis to represent changes in the external conditions and which result in poor measurements. The numerical results reveal that both model-free estimators are robust despite the presence of these fluctuations. As a point of reference, we apply the classical Luenberger type observer to our estimation problem and compare the results. Finally, we consider real data of infected individuals in Mexico City, reported from February 2020 to March 2021, and estimate the non-measured populations. Our work's main goal is to proportionate a simple and therefore, an accessible methodology to estimate the behavior of the COVID-19 pandemic from the available data, such that the competent authorities can propose more adequate health politics.
Keywords: A-SIR model; Asymptomatic individuals estimation; COVID-19 pandemic; Model-free estimation algorithm.
© 2021 Elsevier Inc. All rights reserved.
Conflict of interest statement
None.
Figures

Similar articles
-
Effectiveness and cost-effectiveness of four different strategies for SARS-CoV-2 surveillance in the general population (CoV-Surv Study): a structured summary of a study protocol for a cluster-randomised, two-factorial controlled trial.Trials. 2021 Jan 8;22(1):39. doi: 10.1186/s13063-020-04982-z. Trials. 2021. PMID: 33419461 Free PMC article.
-
Single Parameter Estimation Approach for Robust Estimation of SIR Model With Limited and Noisy Data: The Case for COVID-19.Disaster Med Public Health Prep. 2021 Jun;15(3):e8-e22. doi: 10.1017/dmp.2020.220. Epub 2020 Jun 25. Disaster Med Public Health Prep. 2021. PMID: 32580814 Free PMC article.
-
Mathematical modeling of the spread of the coronavirus disease 2019 (COVID-19) taking into account the undetected infections. The case of China.Commun Nonlinear Sci Numer Simul. 2020 Sep;88:105303. doi: 10.1016/j.cnsns.2020.105303. Epub 2020 Apr 30. Commun Nonlinear Sci Numer Simul. 2020. PMID: 32355435 Free PMC article.
-
An algorithm for the direct estimation of the parameters of the SIR epidemic model from the I(t) dynamics.Eur Phys J Plus. 2022;137(1):57. doi: 10.1140/epjp/s13360-021-02237-7. Epub 2021 Dec 23. Eur Phys J Plus. 2022. PMID: 34961835 Free PMC article.
-
Nonlinear dynamics for the spread of pathogenesis of COVID-19 pandemic.J Infect Public Health. 2021 Jul;14(7):817-831. doi: 10.1016/j.jiph.2021.04.001. Epub 2021 Apr 20. J Infect Public Health. 2021. PMID: 34118731 Free PMC article.
Cited by
-
State estimation of the time-space propagation of COVID-19 using a distributed parameter observer based on a SEIR-type model.J Process Control. 2022 Oct;118:231-241. doi: 10.1016/j.jprocont.2022.08.016. Epub 2022 Sep 12. J Process Control. 2022. PMID: 36118074 Free PMC article.
-
How many asymptomatic cases were unconfirmed in the US COVID-19 pandemic? The evidence from a serological survey.Chaos Solitons Fractals. 2022 Nov;164:112630. doi: 10.1016/j.chaos.2022.112630. Epub 2022 Sep 6. Chaos Solitons Fractals. 2022. PMID: 36091638 Free PMC article.
-
Long-term predictions of current confirmed and dead cases of COVID-19 in China by the non-autonomous delayed epidemic models.Cogn Neurodyn. 2022 Feb;16(1):229-238. doi: 10.1007/s11571-021-09701-1. Epub 2021 Jul 26. Cogn Neurodyn. 2022. PMID: 34335995 Free PMC article.
References
-
- World Health Organization, What do we know about SARS-cov-2 and COVID-19?, 2020, https://www.who.int/docs/default-source/coronaviruse/risk-comms-updates/....
-
- Zhao S., Lin Q., Ran J., Musa S.S., Yang G., Wang W., Lou Y., Gao D., Yang L., He D., et al. Preliminary estimation of the basic reproduction number of novel coronavirus (2019-ncov) in china, from 2019 to 2020: a data-driven analysis in the early phase of the outbreak. Int. J. Infect. Diseases. 2020;92:214–217. - PMC - PubMed
LinkOut - more resources
Full Text Sources
Other Literature Sources
Research Materials