

Sputum microbiota as a potential diagnostic marker for multidrug-resistant tuberculosis
- PMID: 33850462
- PMCID: PMC8040397
- DOI: 10.7150/ijms.53492
Sputum microbiota as a potential diagnostic marker for multidrug-resistant tuberculosis
Abstract
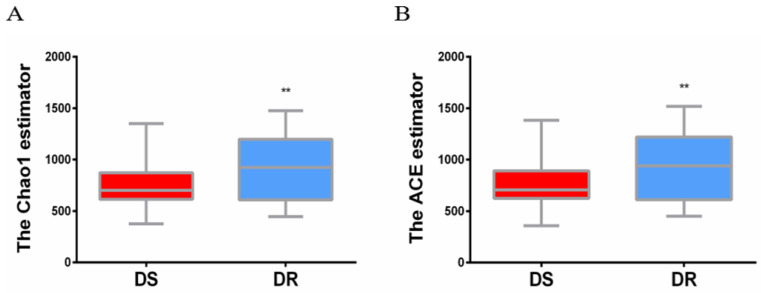
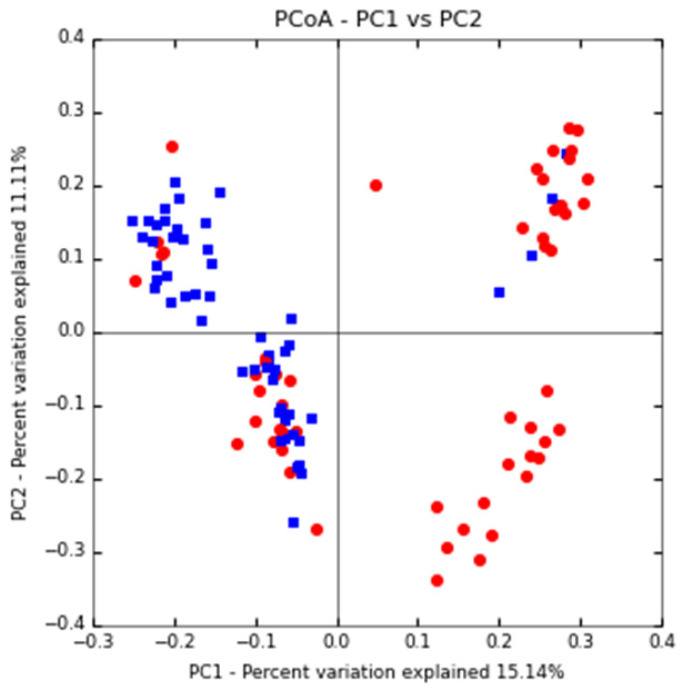
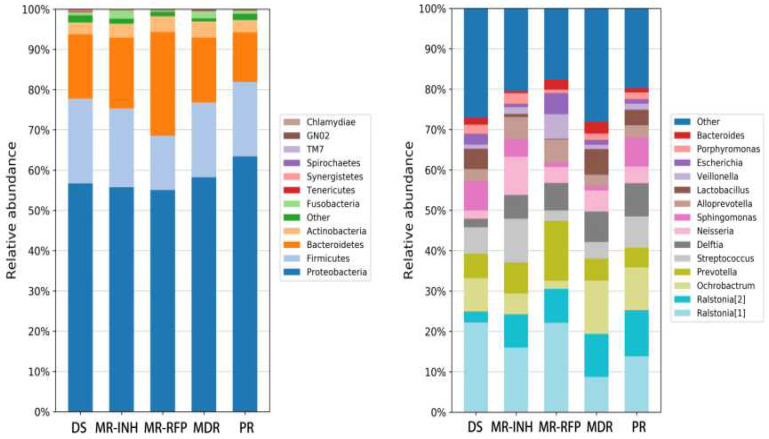
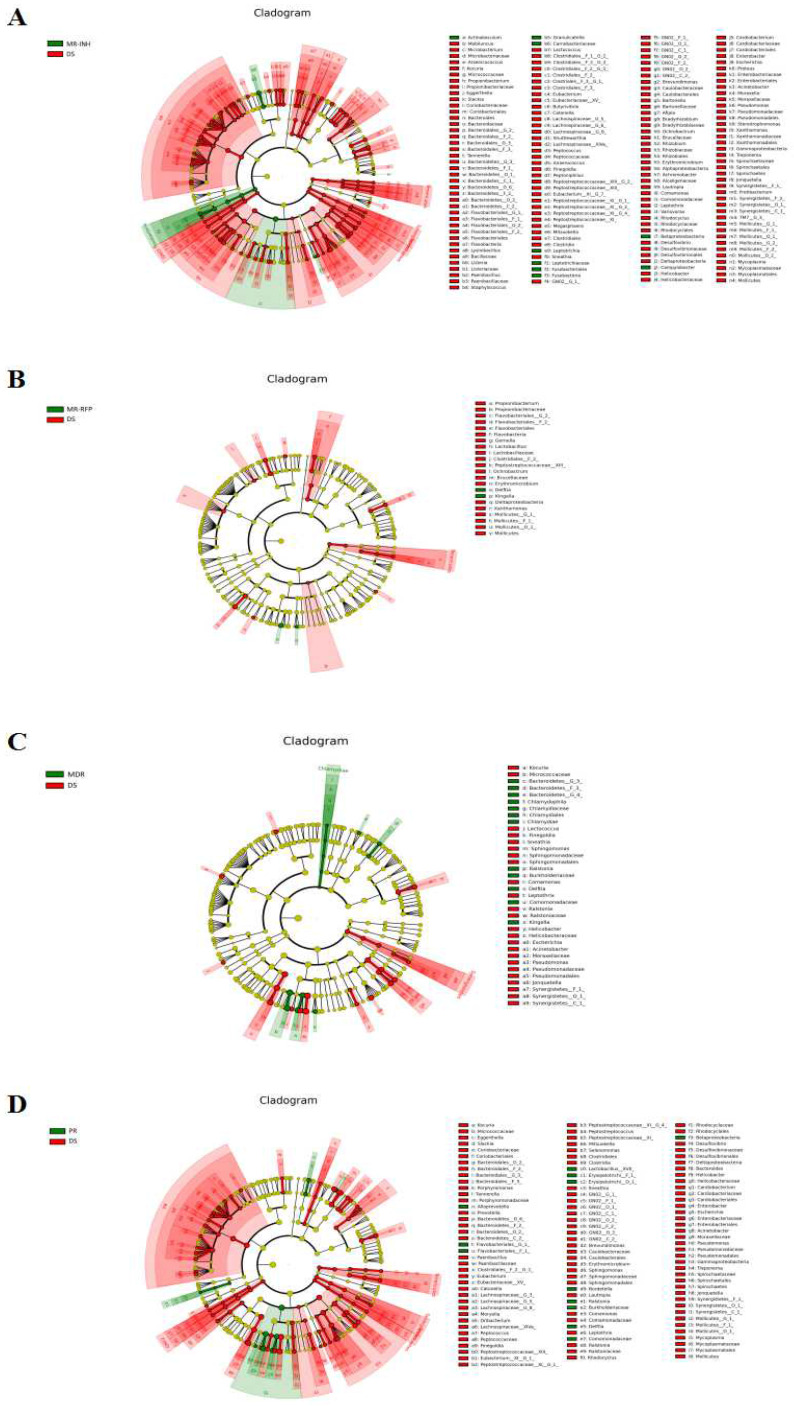
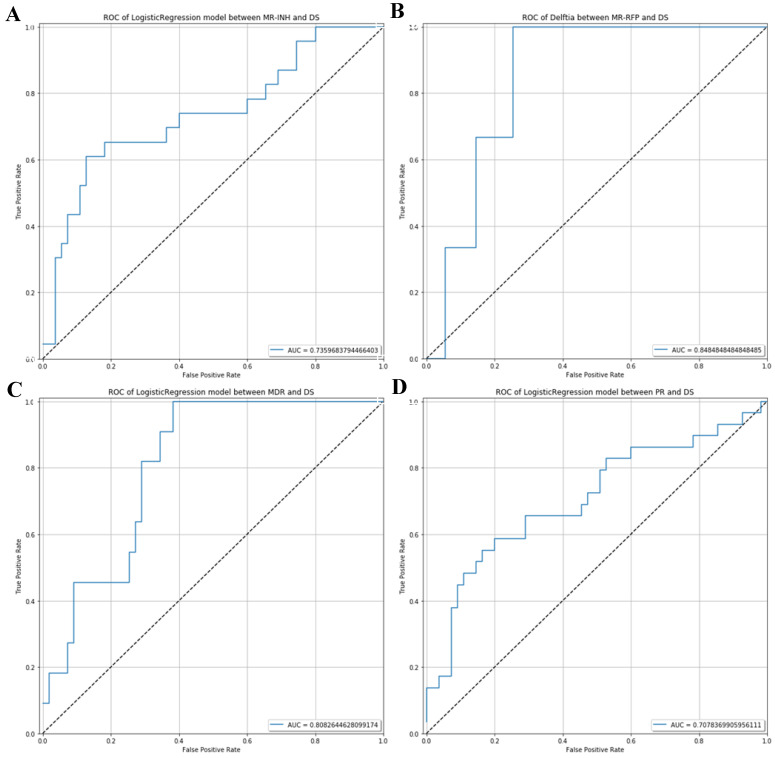
The prevalence of drug-resistant Mycobacterium tuberculosis (Mtb) strains makes disease control more complicated, which is the main cause of death in tuberculosis (TB) patients. Early detection and timely standard treatment are the key to current prevention and control of drug-resistant TB. In recent years, despite the continuous advancement in drug-resistant TB diagnostic technology, the needs for clinical rapid and accurate diagnosis are still not fully met. With the development of sequencing technology, the research of human microecology has been intensified. This study aims to use 16 rRNA sequencing technology to detect and analyze upper respiratory flora of TB patients with anti-TB drug sensitivity (DS, n = 55), monoresistance isoniazide (MR-INH, n = 33), monoresistance rifampin (MR-RFP, n = 12), multidrug resistance (MDR, n = 26) and polyresistance (PR, n = 39) in southern China. Potential microbial diagnostic markers for different types of TB drug resistance are searched by screening differential flora, which provides certain guiding significance for drug resistance diagnosis and clinical drug use of TB. The results showed that the pulmonary microenvironment of TB patients was more susceptible to infection by external pathogens, and the infection of different drug-resistant Mtb leads to changes in different flora. Importantly, seven novel microorganisms (Leptotrichia, Granulicatella, Campylobacter, Delfitia, Kingella, Chlamydophila, Bordetella) were identified by 16S rRNA sequencing as diagnostic markers for different drug resistance types of TB. Leptotrichia, Granulicatella, Campylobacter were potential diagnostic marker for TB patients with INH single-resistance. Delftia was a potential diagnostic marker for TB patients with RFP single drug-resistance. Kingella and Chlamydophila can be used as diagnostic markers for TB patients with PR. Bordetella can be used as a potential diagnostic marker for identification of TB patients with MDR.
Keywords: 16S rRNA sequencing; Tuberculosis; drug resistance; sputum microbiota.
© The author(s).
Conflict of interest statement
Competing Interests: The authors have declared that no competing interest exists.
Figures
Similar articles
-
Diagnostic accuracy and usefulness of the Genotype MTBDRplus assay in diagnosing multidrug-resistant tuberculosis in Cameroon? a cross-sectional study.BMC Infect Dis. 2017 May 31;17(1):379. doi: 10.1186/s12879-017-2489-3. BMC Infect Dis. 2017. PMID: 28569148 Free PMC article.
-
A novel automatic molecular test for detection of multidrug resistance tuberculosis in sputum specimen: A case control study.Tuberculosis (Edinb). 2017 Jul;105:9-12. doi: 10.1016/j.tube.2017.03.008. Epub 2017 Mar 29. Tuberculosis (Edinb). 2017. PMID: 28610793
-
Early detection of multidrug- and pre-extensively drug-resistant tuberculosis from smear-positive sputum by direct sequencing.BMC Infect Dis. 2017 Apr 24;17(1):300. doi: 10.1186/s12879-017-2409-6. BMC Infect Dis. 2017. PMID: 28438132 Free PMC article.
-
Systematic evaluation of line probe assays for the diagnosis of tuberculosis and drug-resistant tuberculosis.Clin Chim Acta. 2022 Aug 1;533:183-218. doi: 10.1016/j.cca.2022.06.020. Epub 2022 Jul 2. Clin Chim Acta. 2022. PMID: 35792161
-
High resolution melting assay as a reliable method for diagnosing drug-resistant TB cases: a systematic review and meta-analysis.BMC Infect Dis. 2021 Sep 22;21(1):989. doi: 10.1186/s12879-021-06708-1. BMC Infect Dis. 2021. PMID: 34551717 Free PMC article.
Cited by
-
The microbiome and the gut-lung axis in tuberculosis: interplay in the course of disease and treatment.Front Microbiol. 2023 Oct 31;14:1237998. doi: 10.3389/fmicb.2023.1237998. eCollection 2023. Front Microbiol. 2023. PMID: 38029121 Free PMC article. Review.
-
The Microbiome as Part of the Contemporary View of Tuberculosis Disease.Pathogens. 2022 May 16;11(5):584. doi: 10.3390/pathogens11050584. Pathogens. 2022. PMID: 35631105 Free PMC article. Review.
-
Dynamic changes of respiratory microbiota associated with treatment outcome in drug-sensitive and drug-resistant pulmonary tuberculosis.Ann Clin Microbiol Antimicrob. 2024 Sep 9;23(1):83. doi: 10.1186/s12941-024-00742-y. Ann Clin Microbiol Antimicrob. 2024. PMID: 39252020 Free PMC article.
-
Insights into the Unique Lung Microbiota Profile of Pulmonary Tuberculosis Patients Using Metagenomic Next-Generation Sequencing.Microbiol Spectr. 2022 Feb 23;10(1):e0190121. doi: 10.1128/spectrum.01901-21. Epub 2022 Feb 23. Microbiol Spectr. 2022. PMID: 35196800 Free PMC article.
-
Altered Microbial Composition of Drug-Sensitive and Drug-Resistant TB Patients Compared with Healthy Volunteers.Microorganisms. 2021 Aug 18;9(8):1762. doi: 10.3390/microorganisms9081762. Microorganisms. 2021. PMID: 34442841 Free PMC article.
References
-
- Krishna P, Jain A, Bisen PS. Microbiome diversity in the sputum of patients with pulmonary tuberculosis. Eur J Clin Microbiol Infect Dis. 2016;35(7):1205–10. - PubMed
Publication types
MeSH terms
Substances
LinkOut - more resources
Full Text Sources
Other Literature Sources
Research Materials
Miscellaneous
