

Role of STAT1 in the resistance of HBV to IFN-α
- PMID: 33850522
- PMCID: PMC8027746
- DOI: 10.3892/etm.2021.9982
Role of STAT1 in the resistance of HBV to IFN-α
Abstract
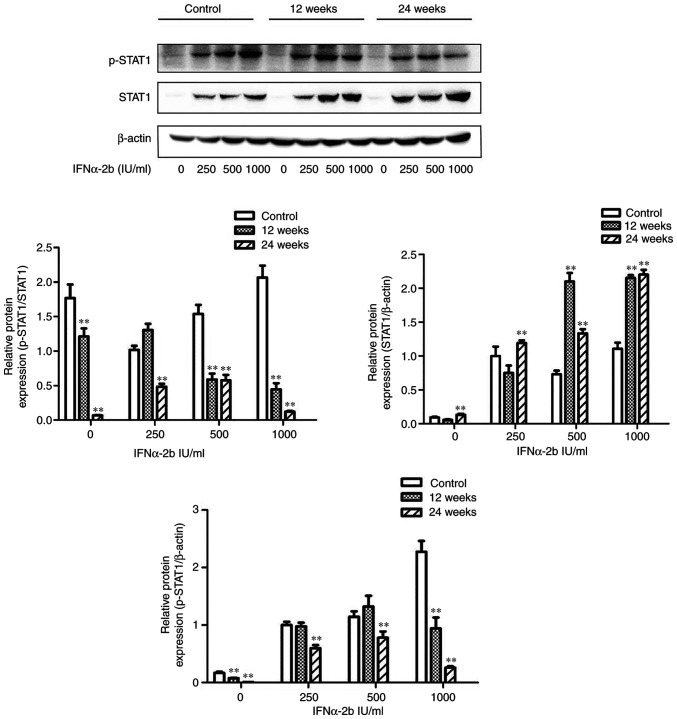
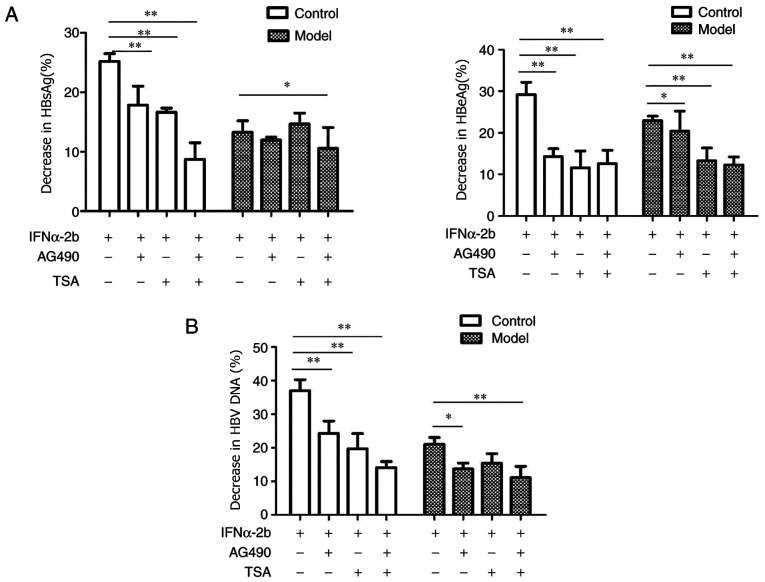
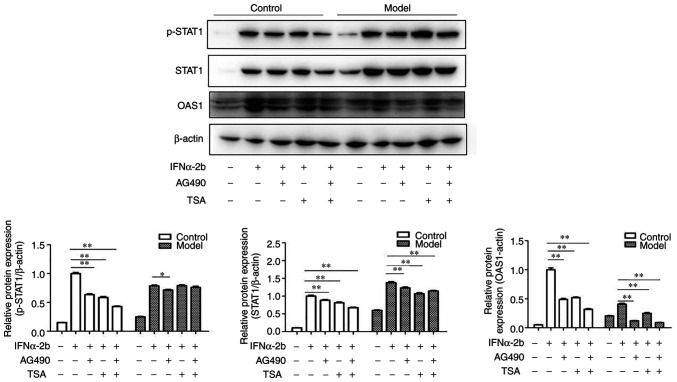
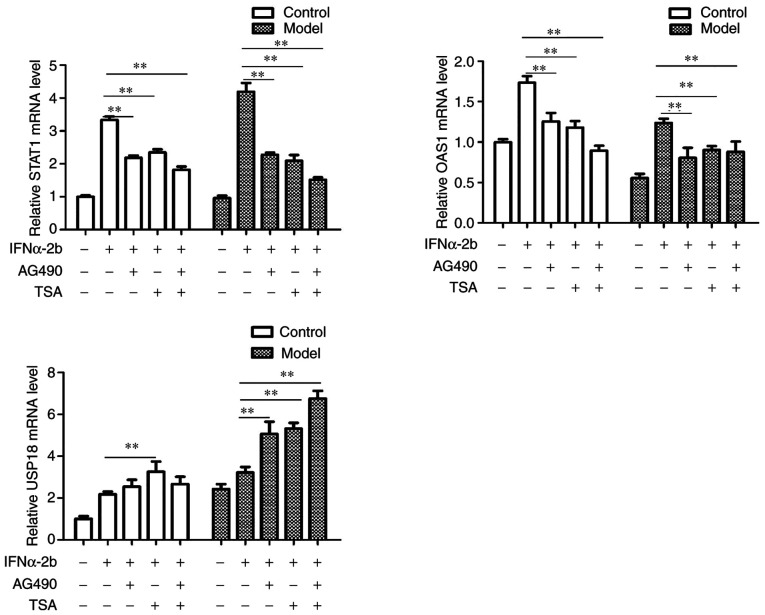
The objective of the present study was to explore the mechanism of hepatitis B virus (HBV) resistance to interferon (IFN), and the role of signal transducer and activator of transcription 1 (STAT1). HepG2.2.15 cells were stimulated with a long-term (6-24 weeks) low-dose interferon (IFN)α-2b (10-70 IU/ml), so as to construct and screen a HepG2.2.15 cell model resistant to IFNα-2b. The changes of STAT1 and other proteins in the JAK-STAT signaling pathway, before and after drug resistance, were compared. The phosphorylation of STAT1 in HepG2.2.15 cells resistant to IFNα-2b was significantly decreased, and the expression level of 2',5'-oligoadenylate synthetase 1 was downregulated. Decreased phosphorylation of STAT1 in the JAK-STAT signaling pathway a contributor to the development of resistance to IFN-α in HBV.
Keywords: Hepatitis B virus; drug resistance; interferon α-2b; phosphorylation; signal transducer and activator of transcription 1.
Copyright: © Xu et al.
Conflict of interest statement
The authors declare that they have no competing interests.
Figures
Similar articles
-
Anti-hepatitis B virus activity and mechanisms of recombinant human serum albumin-interferon-alpha-2b fusion protein in vitro and in vivo.Pharmacology. 2009;83(6):323-32. doi: 10.1159/000215588. Epub 2009 Apr 29. Pharmacology. 2009. PMID: 19407486
-
[The influence of HBV and its antigens on the expressions of JAK-STAT signal transduction pathway molecules and antiviral proteins of IFN alpha].Zhonghua Gan Zang Bing Za Zhi. 2011 Jun;19(6):440-4. Zhonghua Gan Zang Bing Za Zhi. 2011. PMID: 22053375 Chinese.
-
Luteolin sensitizes the antiproliferative effect of interferon α/β by activation of Janus kinase/signal transducer and activator of transcription pathway signaling through protein kinase A-mediated inhibition of protein tyrosine phosphatase SHP-2 in cancer cells.Cell Signal. 2014 Mar;26(3):619-28. doi: 10.1016/j.cellsig.2013.11.039. Epub 2013 Dec 12. Cell Signal. 2014. PMID: 24333668
-
Understanding the molecular mechanism(s) of hepatitis C virus (HCV) induced interferon resistance.Infect Genet Evol. 2013 Oct;19:113-9. doi: 10.1016/j.meegid.2013.06.025. Epub 2013 Jul 5. Infect Genet Evol. 2013. PMID: 23831932 Review.
-
A Positive Feedback Amplifier Circuit That Regulates Interferon (IFN)-Stimulated Gene Expression and Controls Type I and Type II IFN Responses.Front Immunol. 2018 May 28;9:1135. doi: 10.3389/fimmu.2018.01135. eCollection 2018. Front Immunol. 2018. PMID: 29892288 Free PMC article. Review.
Cited by
-
Role of hepatitis B virus non-structural protein HBx on HBV replication, interferon signaling, and hepatocarcinogenesis.Front Microbiol. 2023 Dec 21;14:1322892. doi: 10.3389/fmicb.2023.1322892. eCollection 2023. Front Microbiol. 2023. PMID: 38188582 Free PMC article. Review.
-
Contradictory Mechanisms of rheumatoid arthritis and hepatitis B virus infection activation.Heliyon. 2024 Dec 26;11(1):e41444. doi: 10.1016/j.heliyon.2024.e41444. eCollection 2025 Jan 15. Heliyon. 2024. PMID: 39850429 Free PMC article. Review.
-
IFN-α-2b Reduces Postoperative Arthrofibrosis in Rats by Inhibiting Fibroblast Proliferation and Migration through STAT1/p21 Signaling Pathway.Mediators Inflamm. 2023 Mar 4;2023:1699946. doi: 10.1155/2023/1699946. eCollection 2023. Mediators Inflamm. 2023. PMID: 36915717 Free PMC article.
-
Targeting mitochondrial damage: shining a new light on immunotherapy.Front Immunol. 2024 Jul 22;15:1432633. doi: 10.3389/fimmu.2024.1432633. eCollection 2024. Front Immunol. 2024. PMID: 39104526 Free PMC article. Review.
References
LinkOut - more resources
Full Text Sources
Other Literature Sources
Research Materials
Miscellaneous