

Characterization of extracellular vesicles and synthetic nanoparticles with four orthogonal single-particle analysis platforms
- PMID: 33850608
- PMCID: PMC8023330
- DOI: 10.1002/jev2.12079
Characterization of extracellular vesicles and synthetic nanoparticles with four orthogonal single-particle analysis platforms
Abstract
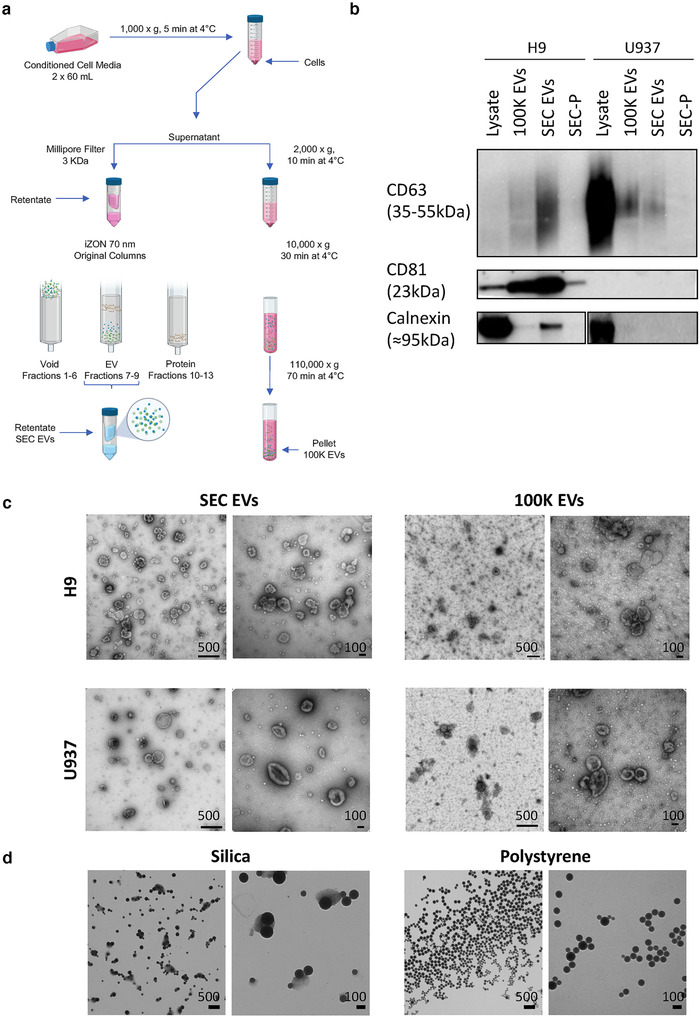
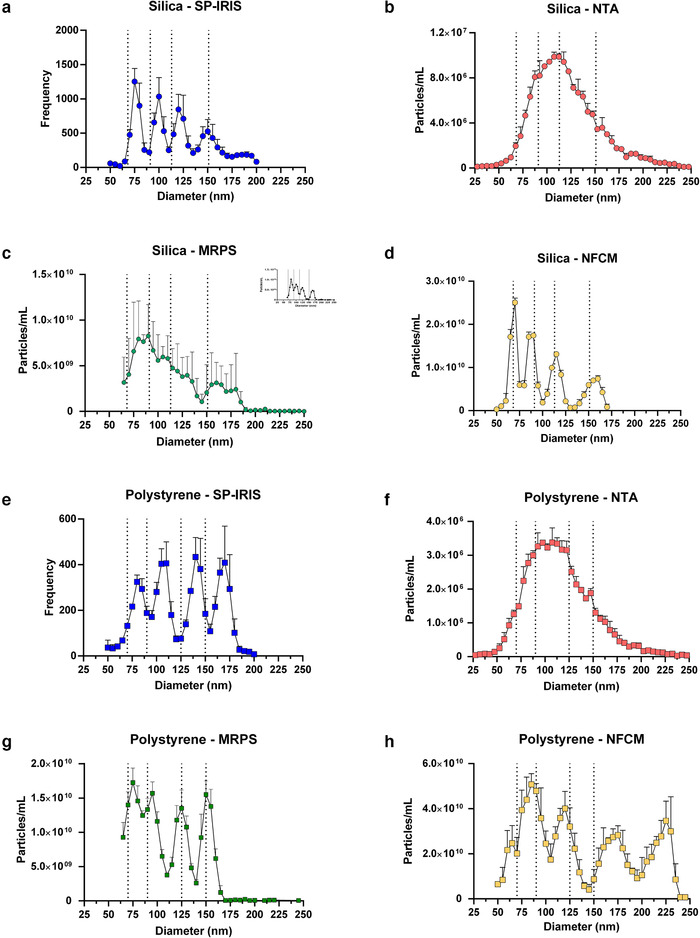
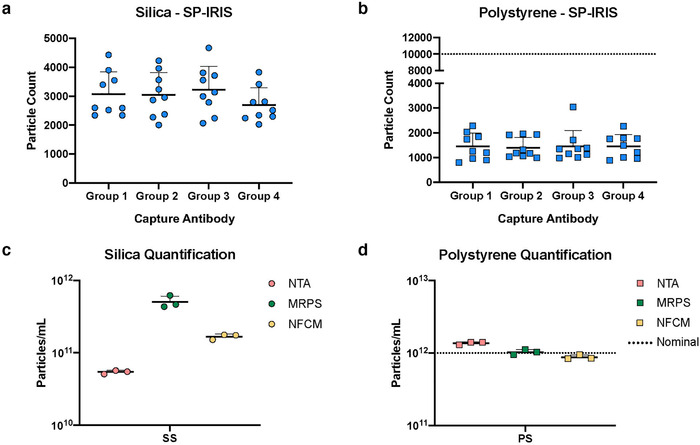
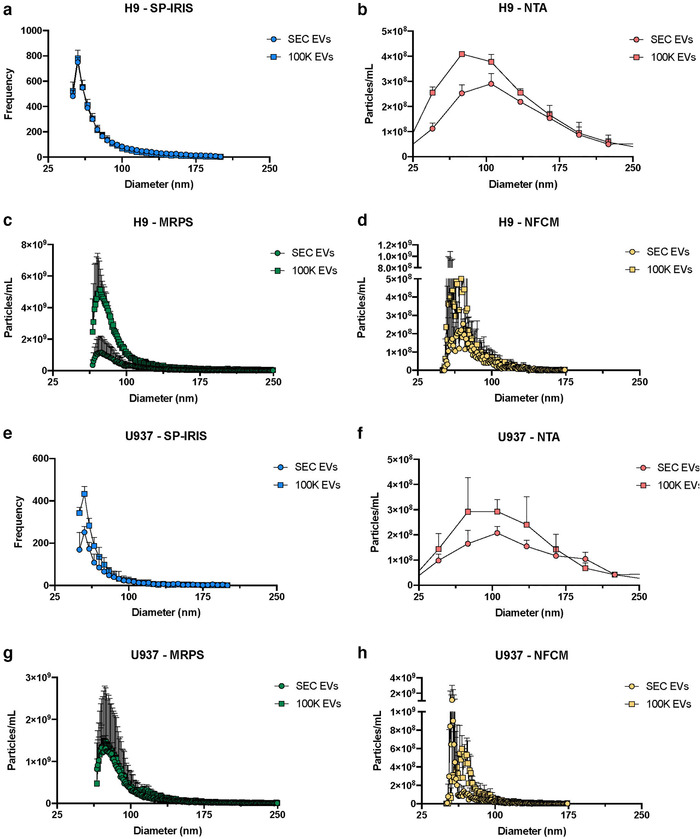
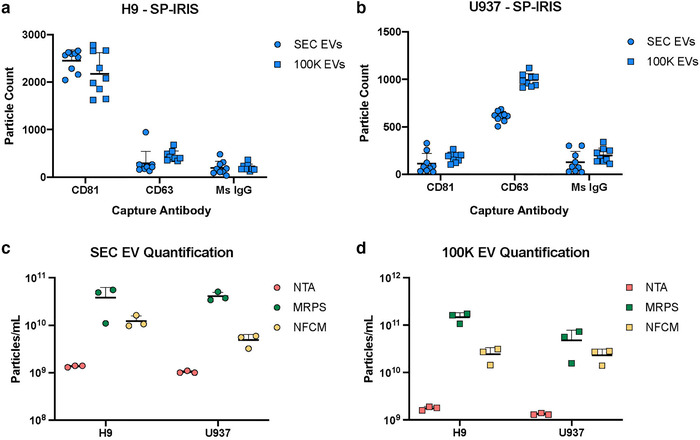
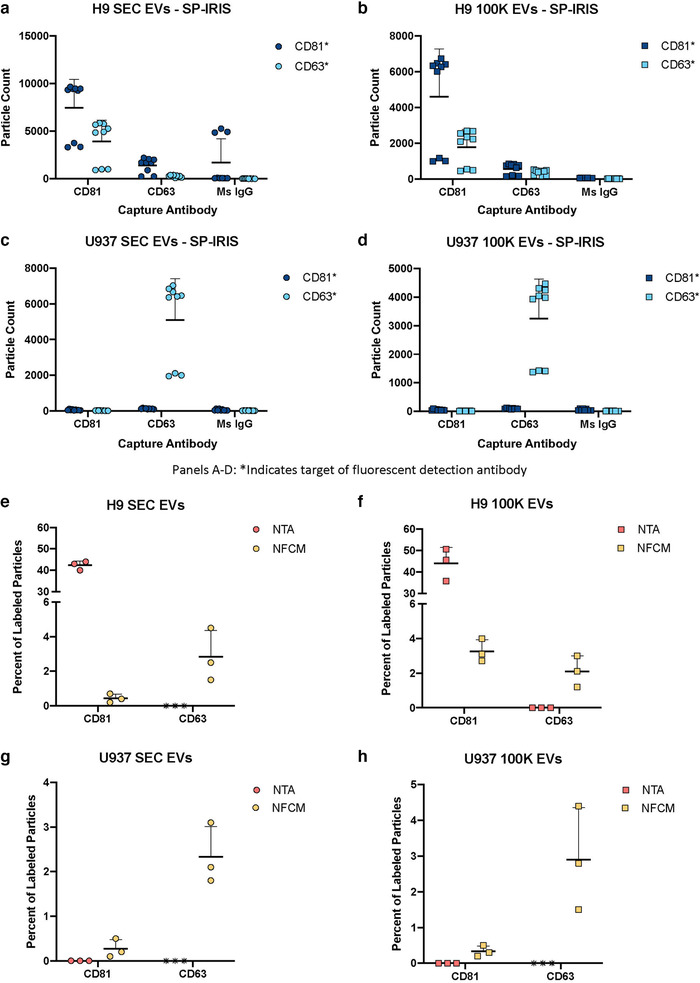
We compared four orthogonal technologies for sizing, counting, and phenotyping of extracellular vesicles (EVs) and synthetic particles. The platforms were: single-particle interferometric reflectance imaging sensing (SP-IRIS) with fluorescence, nanoparticle tracking analysis (NTA) with fluorescence, microfluidic resistive pulse sensing (MRPS), and nanoflow cytometry measurement (NFCM). EVs from the human T lymphocyte line H9 (high CD81, low CD63) and the promonocytic line U937 (low CD81, high CD63) were separated from culture conditioned medium (CCM) by differential ultracentrifugation (dUC) or a combination of ultrafiltration (UF) and size exclusion chromatography (SEC) and characterized by transmission electron microscopy (TEM) and Western blot (WB). Mixtures of synthetic particles (silica and polystyrene spheres) with known sizes and/or concentrations were also tested. MRPS and NFCM returned similar particle counts, while NTA detected counts approximately one order of magnitude lower for EVs, but not for synthetic particles. SP-IRIS events could not be used to estimate particle concentrations. For sizing, SP-IRIS, MRPS, and NFCM returned similar size profiles, with smaller sizes predominating (per power law distribution), but with sensitivity typically dropping off below diameters of 60 nm. NTA detected a population of particles with a mode diameter greater than 100 nm. Additionally, SP-IRIS, MRPS, and NFCM were able to identify at least three of four distinct size populations in a mixture of silica or polystyrene nanoparticles. Finally, for tetraspanin phenotyping, the SP-IRIS platform in fluorescence mode was able to detect at least two markers on the same particle, while NFCM detected either CD81 or CD63. Based on the results of this study, we can draw conclusions about existing single-particle analysis capabilities that may be useful for EV biomarker development and mechanistic studies.
Keywords: ectosomes; exosomes; extracellular vesicles; microvesicles; nanoflow cytometry; nanoparticle tracking analysis; resistive pulse sensing; single particle interferometric reflectance imaging sensing.
© 2021 The Authors. Journal of Extracellular Vesicles published by Wiley Periodicals, LLC on behalf of the International Society for Extracellular Vesicles.
Figures
References
-
- Ahn, J. Y. , Datta, S. , Bandeira, E. , Cano, M. , Mallick, E. , Rai, U. , Powell, B. , Tian, J. , Witwer, K. W. , Handa, J. T. , & Paulaitis, M. E. (2020). Release of extracellular vesicle miR‐494‐3p by ARPE‐19 cells with impaired mitochondria. Biochimica et biophysica acta. General Subjects, 1865, 129598. - PubMed
-
- Anderson, W. , Kozak, D. , Coleman, V. A. , Jämting, Å. K. , & Trau, M. (2013). A comparative study of submicron particle sizing platforms: Accuracy, precision and resolution analysis of polydisperse particle size distributions. Journal of Colloid and Interface Science, 405, 322–330. - PubMed
-
- Arab, T. , Raffo‐Romero, A. , Van Camp, C. , Lemaire, Q. , Le Marrec‐Croq, F. , Drago, F. , Aboulouard, S. , Slomianny, C. , Lacoste, A.‐S. , Guigon, I. , Touzet, H. , Salzet, M. , Fournier, I. , Lefebvre, C. , Vizioli, J. , & Sautière, P.‐E. (2019). Proteomic characterisation of leech microglia extracellular vesicles (EVs): Comparison between differential ultracentrifugation and OptiprepTM density gradient isolation. Journal of Extracellular Vesicles, 8, 1603048. - PMC - PubMed
-
- Bachurski, D. , Schuldner, M. , Nguyen, P.‐H. , Malz, A. , Reiners, K. S. , Grenzi, P. C. , Babatz, F. , Schauss, A. C. , Hansen, H. P. , Hallek, M. , & Pogge Von Strandmann, E. (2019). Extracellular vesicle measurements with nanoparticle tracking analysis–An accuracy and repeatability comparison between NanoSight NS300 and ZetaView. Journal of Extracellular Vesicles, 8, 1596016. - PMC - PubMed
Publication types
MeSH terms
Substances
Grants and funding
LinkOut - more resources
Full Text Sources
Other Literature Sources
Miscellaneous
