A long non-coding RNAs expression signature to improve prognostic prediction of Wilms tumor in children
- PMID: 33850811
- PMCID: PMC8039786
- DOI: 10.21037/tp-20-318
A long non-coding RNAs expression signature to improve prognostic prediction of Wilms tumor in children
Abstract
Background: Wilms tumor (WT) is the most frequent malignancy of the kidney in children, and a subset of patients remains with a poor prognosis. This study aimed to identify key long non-coding RNAs (lncRNAs) related to prognosis and establish a genomic-clinicopathologic nomogram to predict survival in children with WT.
Methods: Clinical data of 124 WT patients and the relevant RNA sequencing data including lncRNAs expression signature of primary WT samples were obtained from the Therapeutically Applicable Research to Generate Effective Treatment (TARGET) Data Matrix. Then, lncRNAs associated with overall survival (OS) were identified through univariate Cox, least absolute shrinkage and selection operator (LASSO), and multivariate Cox regression analyses. The risk scores of 124 participants were calculated, and survival analyses were performed between low- and high-risk groups. A genomic-clinicopathologic nomogram was then developed and evaluated by time-dependent receiver operating characteristic (ROC) curves, including the area under the curve (AUC), calibration curve, and decision curve analysis. Subsequently, bioinformatics analyses were performed to explore the potential molecular mechanisms that affect the prognosis of WT. The package "DESeq2" was used to identify differentially expressed protein-coding genes (DEPCGs) between groups. Gene Set Enrichment Analysis (GSEA) was applied to explore the differences in pathways enrichment. The analytical tools CIBERSORTx and ESTIMATE were used to investigate the discrepancies of the immune microenvironment.
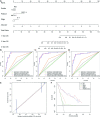
Results: A total of 10 lncRNAs were selected as independent predictors associated with OS (P<0.05). Participants in the high-risk group had a significantly worse OS and event-free survival (EFS) than those in the low-risk group (P<2E-16 and P=2.03E-04, respectively). The risk score and 3 clinicopathological features (gender, cooperative group protocol, and stage) were identified to construct the nomogram (combined model) (P=5.11E-17). The combined model (1-year AUC: 0.9272, 3-year AUC: 0.9428, 5-year AUC: 0.9259) and risk score model (1-year AUC: 0.9285, 3-year AUC: 0.9399, 5-year AUC: 0.9266) displayed higher predictive accuracy than that of the other models. Subsequently, 105 DEPCGs were identified. The GSEA revealed 4 significant pathways. Analysis with CIBERSORTx demonstrated that monocytes, macrophages M1, activated dendritic cells, and resting mast cells had significant infiltration differences between groups.
Conclusions: This study constructed a genomic-clinicopathologic nomogram, which might present a novel and efficient method for treating patients with WT.
Keywords: Wilms tumor (WT); bioinformatics analysis; long non-coding RNA (lncRNA); nomograms; prognosis.
2021 Translational Pediatrics. All rights reserved.
Conflict of interest statement
Conflicts of Interest: All authors have completed the ICMJE uniform disclosure form (available at http://dx.doi.org/10.21037/tp-20-318). The authors have no conflicts of interest to declare.
Figures


Similar articles
-
Identification of a novel defined inflammation-related long noncoding RNA signature contributes to predicting prognosis and distinction between the cold and hot tumors in bladder cancer.Front Oncol. 2023 Mar 29;13:972558. doi: 10.3389/fonc.2023.972558. eCollection 2023. Front Oncol. 2023. PMID: 37064115 Free PMC article.
-
A Genomic-Clinicopathologic Nomogram Predicts Survival for Patients with Laryngeal Squamous Cell Carcinoma.Dis Markers. 2019 Nov 20;2019:5980567. doi: 10.1155/2019/5980567. eCollection 2019. Dis Markers. 2019. PMID: 31827637 Free PMC article.
-
Ferroptosis-related lncRNA signature predicts prognosis and immunotherapy efficacy in cutaneous melanoma.Front Surg. 2022 Jul 21;9:860806. doi: 10.3389/fsurg.2022.860806. eCollection 2022. Front Surg. 2022. PMID: 35937602 Free PMC article.
-
Construction and validation of a prognostic signature for mucinous colonic adenocarcinoma based on N7-methylguanosine-related long non-coding RNAs.J Gastrointest Oncol. 2024 Feb 29;15(1):203-219. doi: 10.21037/jgo-23-980. Epub 2024 Feb 28. J Gastrointest Oncol. 2024. PMID: 38482248 Free PMC article.
-
Construction of a novel mRNA-signature prediction model for prognosis of bladder cancer based on a statistical analysis.BMC Cancer. 2021 Jul 27;21(1):858. doi: 10.1186/s12885-021-08611-z. BMC Cancer. 2021. PMID: 34315402 Free PMC article.
Cited by
-
The Emerging Landscape of Long Non-Coding RNAs in Wilms Tumor.Front Oncol. 2022 Jan 19;11:780925. doi: 10.3389/fonc.2021.780925. eCollection 2021. Front Oncol. 2022. PMID: 35127486 Free PMC article. Review.
References
-
- Brok J, Lopez-Yurda M, Tinteren H V, et al. Relapse of Wilms’ tumour and detection methods: a retrospective analysis of the 2001 Renal Tumour Study Group-International Society of Paediatric Oncology Wilms’ tumour protocol database. Lancet Oncol 2018;19:1072-81. 10.1016/S1470-2045(18)30293-6 - DOI - PubMed
LinkOut - more resources
Full Text Sources
Other Literature Sources
