High-throughput sequencing profile of laryngeal cancers: analysis of co-expression and competing endogenous RNA networks of circular RNAs, long non-coding RNAs, and messenger RNAs
- PMID: 33850880
- PMCID: PMC8039704
- DOI: 10.21037/atm-21-584
High-throughput sequencing profile of laryngeal cancers: analysis of co-expression and competing endogenous RNA networks of circular RNAs, long non-coding RNAs, and messenger RNAs
Abstract
Background: Circular RNAs (circRNAs) and long non-coding RNAs (lncRNAs) have been recently identified as new classes of non-coding RNAs which participate in carcinogenesis and tumor progression. However, the functions of these non-coding RNAs and gene expression patterns are largely unknown.
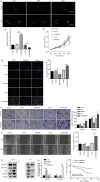
Methods: We carried out high-throughput sequencing to analyze the differential expression of RNAs in 5 coupled laryngeal cancer (LC) and corresponding adjacent noncancerous tissues. Bioinformatics analyses were performed to predict the functions of these non-coding RNAs via co-expression, competing endogenous RNA networks and pathway enrichment analysis. The differential expression of the selected RNAs were confirmed using RT-qPCR. The CCK8, EDU, Transwell, and wound healing assays were conducted to validate the biological functions of SNHG29 in LC. Western blot assay was performed to identify the effects of SNHG29 having on the epithelial to mesenchymal transition process. Kaplan-Meier analysis was used to investigate whether the expression level of SNHG29 correlated with survival in LC patients. One-way ANOVA was used to analyze the correlation between the expression of SNHG29 and clinicopathological parameters of the included patients.
Results: Compared to normal laryngeal tissues, 31,763 non-coding RNAs were upregulated and 11,557 non-coding RNAs were downregulated in cancer tissues. SNHG29 expression was low in the LC cell lines and tissues predicting a better clinical prognosis. SNHG29 was also found to inhibit the proliferation, migration, and invasion ability of LC, exerting a suppressive role in the epithelial to mesenchymal transition process as well. SNHG29 downregulation was significantly correlated with differentiation (P=0.026), T-stage (P=0.041), lymphatic metastasis (P=0.044), and clinical stage (P=0.037). We found that the biological functions of differentially expressed transcripts included cell adhesion, biological adhesion, and migration and invasion related to adherens junction pathways.
Conclusions: Our study was the first to describe the non-coding RNA profile of LC, and suggested that dysregulated non-coding RNAs could be involved in LC tumorigenesis. SNHG29 was demonstrated to play crucial roles in inhibiting the pathogenesis and progression of LC. Our findings provide a new approach for further analyses of pathogenetic mechanisms, the detection of novel transcripts, and the identification of valuable biomarkers for this tumor.
Keywords: Differential expression analysis; biomarker identification; novel transcript detection.
2021 Annals of Translational Medicine. All rights reserved.
Conflict of interest statement
Conflicts of Interest: All authors have completed the ICMJE uniform disclosure form (available at http://dx.doi.org/10.21037/atm-21-584). The authors have no conflicts of interest to declare.
Figures


Similar articles
-
Downregulation of circ-RANBP9 in laryngeal cancer and its clinical significance.Ann Transl Med. 2021 Mar;9(6):484. doi: 10.21037/atm-21-567. Ann Transl Med. 2021. PMID: 33850881 Free PMC article.
-
Transcriptomic analysis of high-throughput sequencing about circRNA, lncRNA and mRNA in bladder cancer.Gene. 2018 Nov 30;677:189-197. doi: 10.1016/j.gene.2018.07.041. Epub 2018 Jul 17. Gene. 2018. PMID: 30025927
-
Excavating novel diagnostic and prognostic long non-coding RNAs (lncRNAs) for head and neck squamous cell carcinoma: an integrated bioinformatics analysis of competing endogenous RNAs (ceRNAs) and gene co-expression networks.Bioengineered. 2021 Dec;12(2):12821-12838. doi: 10.1080/21655979.2021.2003925. Bioengineered. 2021. PMID: 34898376 Free PMC article.
-
MiRNA-related metastasis in oral cancer: moving and shaking.Cancer Cell Int. 2023 Aug 27;23(1):182. doi: 10.1186/s12935-023-03022-5. Cancer Cell Int. 2023. PMID: 37635248 Free PMC article. Review.
-
New insights into the role of circular RNAs in ovarian cancer.Pathol Res Pract. 2022 Oct;238:154073. doi: 10.1016/j.prp.2022.154073. Epub 2022 Aug 13. Pathol Res Pract. 2022. PMID: 36007396 Review.
Cited by
-
Emerging functions of circular RNA in the regulation of adipocyte metabolism and obesity.Cell Death Discov. 2022 May 20;8(1):268. doi: 10.1038/s41420-022-01062-w. Cell Death Discov. 2022. PMID: 35595755 Free PMC article. Review.
-
The landscape of circRNAs in gliomas temozolomide resistance: Insights into molecular pathways.Noncoding RNA Res. 2024 May 21;9(4):1178-1189. doi: 10.1016/j.ncrna.2024.05.010. eCollection 2024 Dec. Noncoding RNA Res. 2024. PMID: 39022676 Free PMC article. Review.
-
Circular RNA CircSHKBP1 accelerates the proliferation, invasion, angiogenesis, and stem cell-like properties via modulation of microR-766-5p/high mobility group AT-hook 2 axis in laryngeal squamous cell carcinoma.Bioengineered. 2022 May;13(5):11551-11563. doi: 10.1080/21655979.2022.2068922. Bioengineered. 2022. PMID: 35502885 Free PMC article.
-
The role of long noncoding RNA SNHG29 in malignant tumors.Discov Oncol. 2025 Jul 15;16(1):1334. doi: 10.1007/s12672-025-03189-5. Discov Oncol. 2025. PMID: 40663245 Free PMC article. Review.
-
Long non-coding RNAs in brain tumors: roles and potential as therapeutic targets.J Hematol Oncol. 2021 May 12;14(1):77. doi: 10.1186/s13045-021-01088-0. J Hematol Oncol. 2021. PMID: 33980320 Free PMC article. Review.
References
LinkOut - more resources
Full Text Sources
Other Literature Sources
