. 2021 Mar 17:21:247-261.
doi: 10.1016/j.omtm.2021.03.009. eCollection 2021 Jun 11.

Discovery of bone morphogenetic protein 7-derived peptide sequences that attenuate the human osteoarthritic chondrocyte phenotype

Affiliations

Discovery of bone morphogenetic protein 7-derived peptide sequences that attenuate the human osteoarthritic chondrocyte phenotype

Marjolein M J Caron et al. Mol Ther Methods Clin Dev. .

Abstract

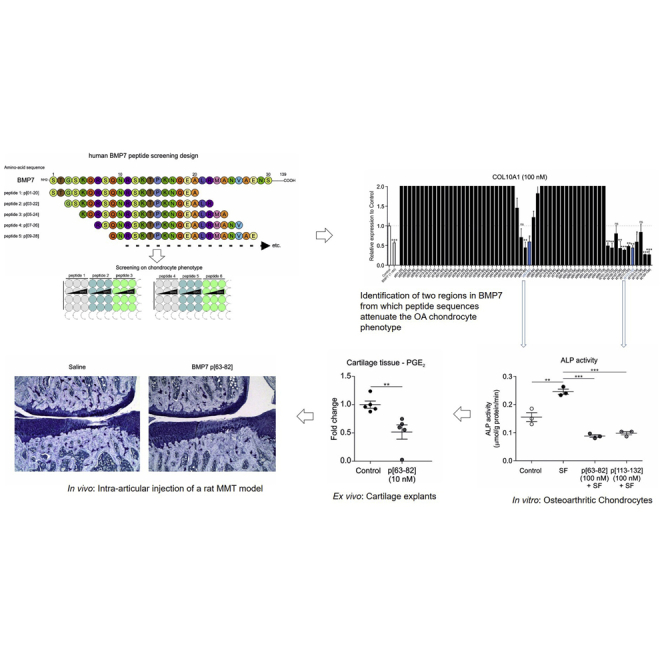
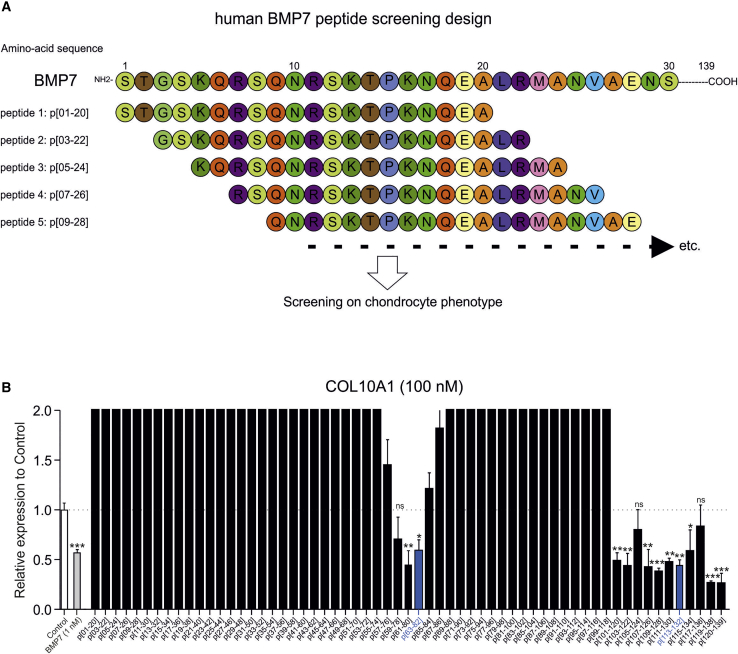
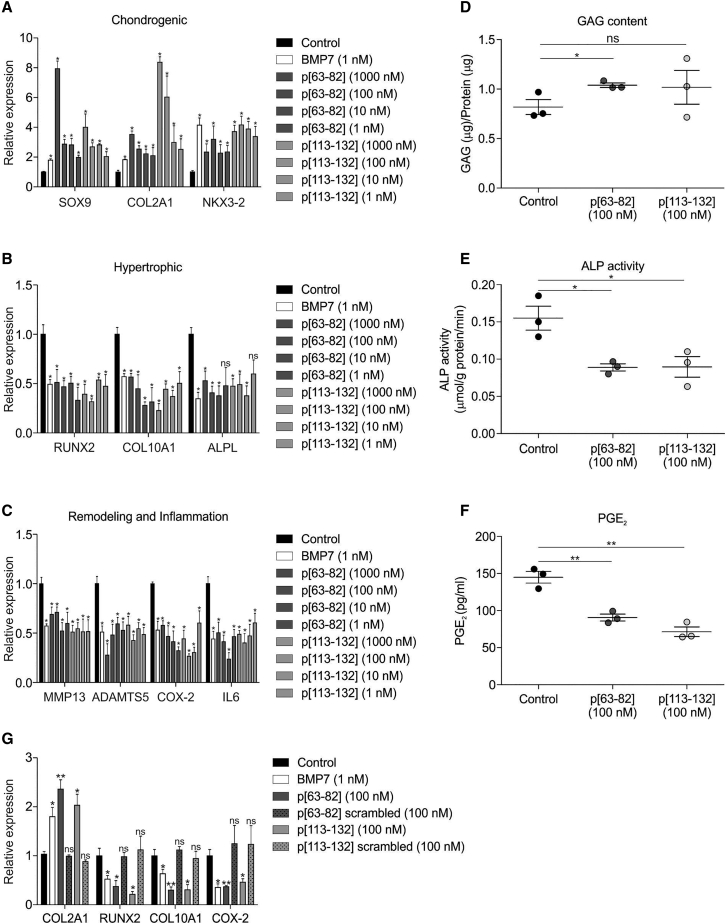
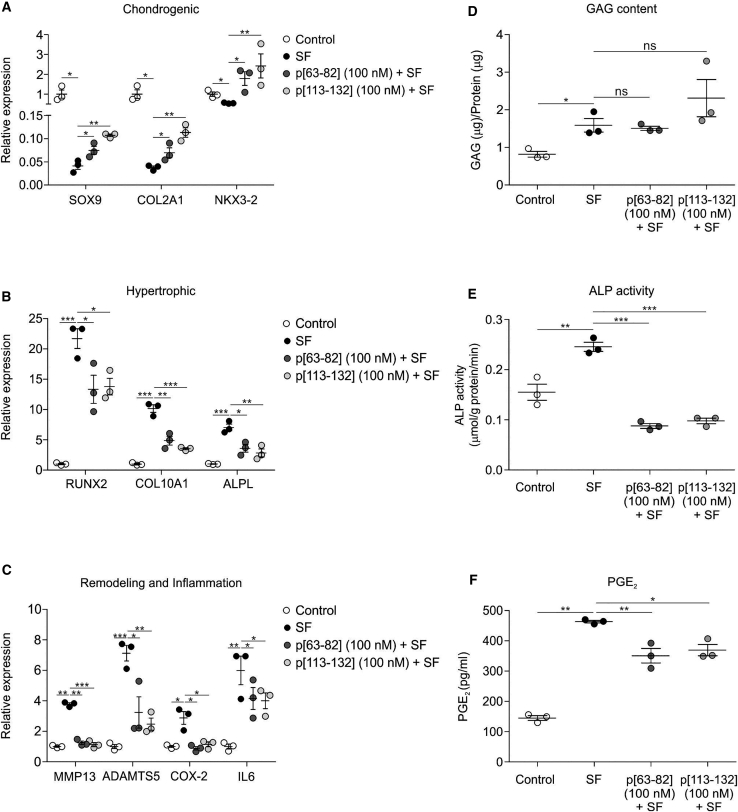
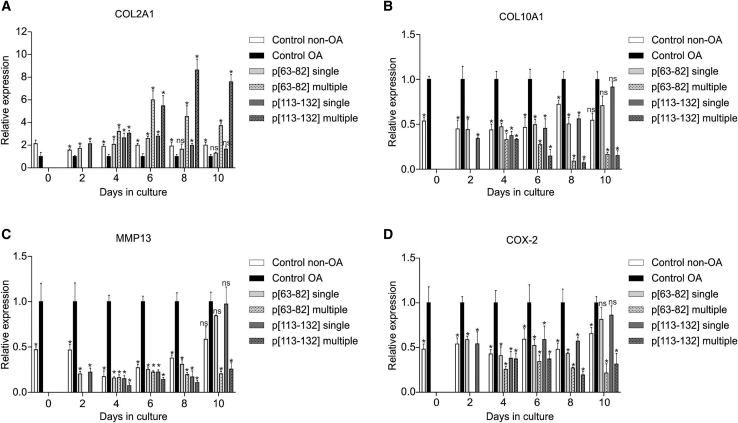
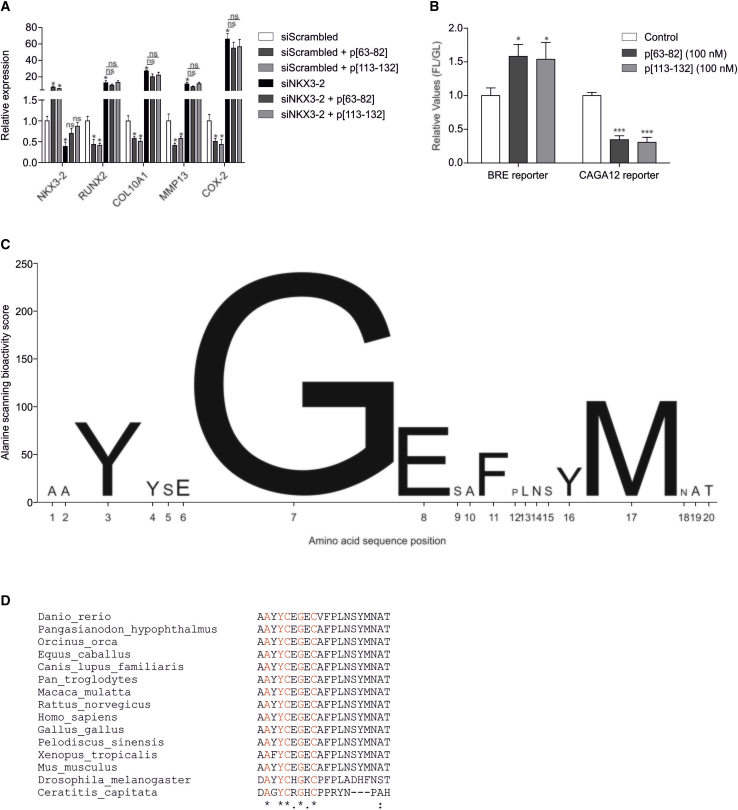
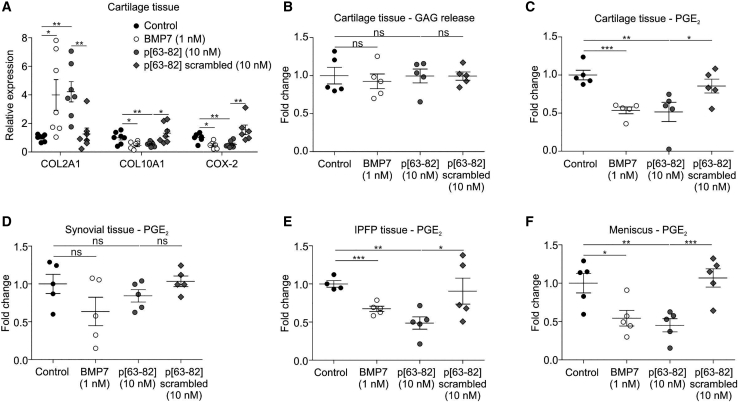
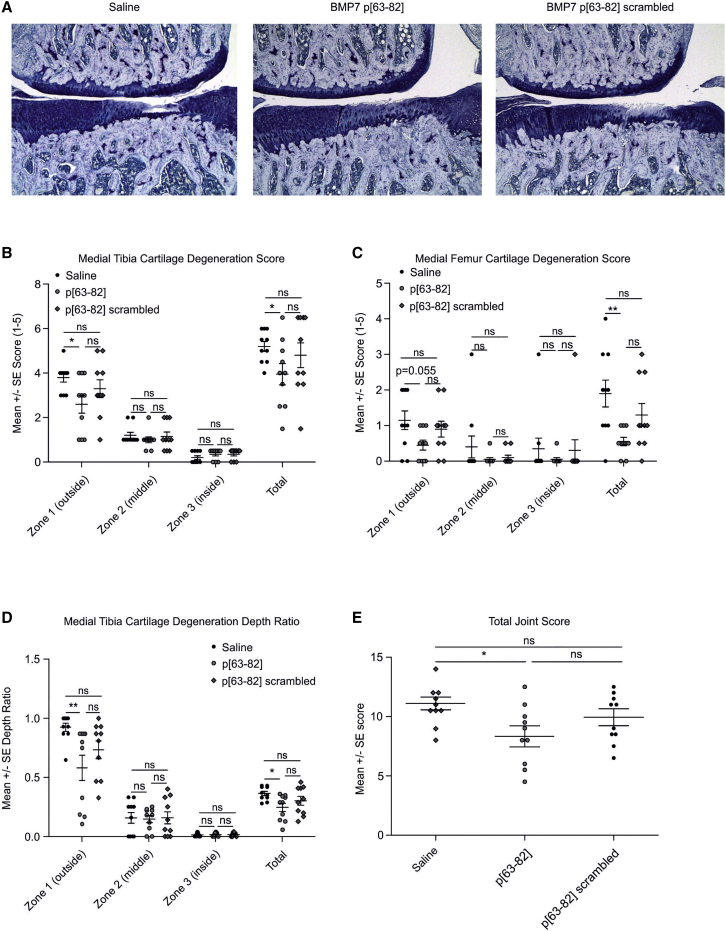
Treatment of osteoarthritis (OA) is mainly symptomatic by alleviating pain to postpone total joint replacement. Bone morphogenetic protein 7 (BMP7) is a candidate morphogen for experimental OA treatment that favorably alters the chondrocyte and cartilage phenotype. Intra-articular delivery and sustained release of a recombinant growth factor for treating OA are challenging, whereas the use of peptide technology potentially circumvents many of these challenges. In this study, we screened a high-resolution BMP7 peptide library and discovered several overlapping peptide sequences from two regions in BMP7 with nanomolar bioactivity that attenuated the pathological OA chondrocyte phenotype. A single exposure of OA chondrocytes to peptides p[63-82] and p[113-132] ameliorated the OA chondrocyte phenotype for up to 8 days, and peptides were bioactive on chondrocytes in OA synovial fluid. Peptides p[63-82] and p[113-132] required NKX3-2 for their bioactivity on chondrocytes and provoke changes in SMAD signaling activity. The bioactivity of p[63-82] depended on specific evolutionary conserved sequence elements common to BMP family members. Intra-articular injection of a rat medial meniscal tear (MMT) model with peptide p[63-82] attenuated cartilage degeneration. Together, this study identified two regions in BMP7 from which bioactive peptides are able to attenuate the OA chondrocyte phenotype. These BMP7-derived peptides provide potential novel disease-modifying treatment options for OA.

Keywords: BMP7; chondrocyte phenotype; hypertrophy; osteoarthritis; peptides.


Conflict of interest statement

The study sponsors had no involvement in study design, collection, analysis, and interpretation of data; the writing of the manuscript; or the decision to submit the manuscript for publication. M.M.J.C. and T.J.M.W. are inventors on patents WO2017178251 and WO2017178253 (owned by Chondropeptix). P.J.E., L.W.v.R., and T.J.M.W. are shareholders in Chondropeptix and are CMO, CDO, and CSO of Chondropeptix, respectively. The other authors declare no competing interests.

Figures

None
Graphical abstract
Figure 1
Figure 1
BMP7 peptide library screening on primary human OA articular chondrocytes (OA-HACs) (A) Schematic representation of the design of the human BMP7 peptide library. (B) COL10A1 mRNA expression in samples from the library screening on a pool of 18 OA-HACs individually exposed for 24 h to the peptides (100 nM) in the library. Data are shown as compared to the control condition (white bar) and full-length BMP7 (1 nM; gray bar). The two blue bars represent candidate peptides p[63−82] and p[113−132]. Data from these two peptides showed significantly downregulated COL10A1 expression but also showed reduced expression of RUNX2, ALPL, COX-2, IL-6, ADAMTS5, and MMP13 and increased expression of SOX9, COL2A1, and NKX3-2 in all tested peptide concentrations. Error bars represent mean ± SEM, and statistical significance for peptide condition or BMP7 versus control condition as determined by unpaired two-tailed Student’s t test is represented as ∗p < 0.05, ∗∗p < 0.01, and ∗∗∗p < 0.001; NS, not significant. Data for other measured mRNAs and peptide concentrations are provided in Figure S2.
Figure 2
Figure 2
Bioactivity of BMP7-derived peptides p[63−82] and p[113−132] on OA-HACs Complete peptide library screening quantitative real-time PCR dataset for peptides p[63−82] and p[113−132] is presented. (A) SOX9, COL2A1, and NKX3-2 mRNA expression in the 18 OA-HAC pool exposed to 1,000, 100, 10, or 1 nM of peptide p[63−82] and p[113−132] is shown and presented relative to control (black bars) and alongside full-length BMP7 (white bars). (B) Similar to (A) but for chondrocyte hypertrophy-associated genes RUNX2, COL10A1, and ALPL. (C) Similar to (A) but for cartilage extracellular matrix remodeling-associated genes MMP13 and ADAMTS5 and inflammation-related genes COX-2 and IL-6. (D) Glycosaminoglycan (GAG) content (normalized to total protein content) on an independent cohort of three individual OA-HAC donors treated with 100 nM peptides p[63−82] and p[113−132] for 24 h. Corresponding gene expression data are shown in Figure S3. (E) Alkaline phosphatase (ALP) activity (normalized to total protein content) in similar samples from (D). (F) Prostaglandin E2 (PGE2) levels in culture supernatant in similar samples from (D). (G) In the same OA-HAC pool of 18 OA-HAC donors from the peptide library screening, sequence dependency of peptides p[63−82] and p[113−132] was determined by exposing the OA-HAC pool to scrambled versions of peptides p[63−82] and p[113−132] (100 nM, 24 h). Expression of COL2A1, RUNX2, COL10A1, and COX-2 mRNAs is shown. Error bars represent mean ± SEM, and statistical significance for peptide conditions or BMP7 versus control condition as determined by unpaired two-tailed Student’s t test is represented as ∗p < 0.05, ∗∗p < 0.01, and ∗∗∗p < 0.001.
Figure 3
Figure 3
Bioactivity of peptides p[63−82] and p[113−132] on OA articular chondrocytes in OA synovial fluid (SF) OA-HACs (n = 3 individual donors, tested in triplicate) were exposed to 100 nM peptide p[63−82] or p[113−132] in the presence of OA SF (20% [v/v]; equal ratio mix from five individual donors). Control is 20% (v/v) 0.9% NaCl. Cells were cultured in these conditions for 24 h and analyzed for mRNA expression of indicated genes (normalized for 28S rRNA expression and relative to control condition). (A) Expression of SOX9, COL2A1, and NKX3-2 mRNAs. (B) Expression of RUNX2, COL10A1, and ALPL mRNAs. (C) Expression of MMP13, ADAMTS5, COX-2, and IL-6 mRNAs. (D) GAG content (normalized to total protein content) was determined in the same conditions. (E) ALP enzyme activity in cell lysates of the same conditions was determined and normalized for total protein content. (F) PGE2 levels in culture supernatants of the same conditions. Error bars represent mean ± SEM, and statistical significance for peptide conditions or control versus SF condition as determined by unpaired two-tailed Student’s t test is represented as ∗p < 0.05, ∗∗p < 0.01, and ∗∗∗p < 0.001.
Figure 4
Figure 4
Duration of chondrocyte phenotype modulation by BMP7-derived peptides A pool of OA-HACs (n = 3 donors) was cultured in the presence or absence of 100 nM peptides p[63−82] or p[113−132] and compared to a pool of human articular chondrocytes from a non-OA source. The medium was changed every 2 days. Peptides were added at the start of the experiment and subsequently at every medium change (multiple) or only at the start of the experiment and not during every subsequent medium change (single). At days 0, 2, 4, 6, 8, and 10 in culture, samples were harvested and analyzed for the expression of the indicated mRNAs by quantitative real-time PCR (normalized for 28S rRNA expression) (A) COL2A1 mRNA expression. (B) COL10A1 mRNA expression. (C) MMP13 mRNA expression. (D) COX-2 mRNA expression. In graphs, error bars represent mean ± SEM; data are presented relative to the “control OA” condition of each time point. Statistical differences were calculated to control conditions. Error bars represent mean ± SEM, and statistical significance for peptide conditions or control non-OA versus control OA condition as determined by unpaired two-tailed Student’s t test is represented as ∗p < 0.05, ∗∗p < 0.01, and ∗∗∗p < 0.001.
Figure 5
Figure 5
Molecular characterization of peptides p[63−82] and p[113−132] (A) A pool of OA-HACs (n = 4 donors) was transfected with a scrambled siRNA or with an NKX3-2 siRNA (100 nM siRNA) and cultured for 24 h. Cultures were then exposed to peptide p[63−82] or p[113−132] (100 nM peptide). Samples were harvested 24 h later and analyzed for the expression of the indicated mRNAs (normalized to 28S rRNA). (B) SW1353 chondrocytic cells were transfected with BRE (SMAD1/5/8 reporter) or CAGA12 (SMAD2/3 reporter) firefly luciferase-reporter plasmids. A CMV-Gaussia plasmid was cotransfected as a transfection control. Cells were then cultured for 24 h and subsequently exposed to control, p[63−82], or p[113−132] for 8 h. Firefly and Gaussia bioluminescence were measured in cells and medium (respectively), and relative light units (RLUs) of firefly luciferase were normalized for the Gaussia luciferase signal. The normalized firefly luciferase signal of the control condition was set at 1, and peptide conditions were calculated relative to the control condition (FL/GL). Error bars represent mean ± SEM; statistical significance for peptide conditions versus siScrambled or siNKX3-2 (A) or control condition (B) as determined by unpaired two-tailed Student’s t test is represented as ∗p < 0.05, ∗∗p < 0.01, and ∗∗∗p < 0.001. (C) An alanine scanning library of peptide p[63−82] was synthesized, and the pool of 18 OA-HACs originally used for the full library scanning (Figure 1) was exposed to individual peptides from the alanine scanning library (100 nM peptide) for 24 h. An alanine-scanning bioactivity score (sum of the fold change gene expression of COL10A1, ALPL, MMP13, and COL2A1 plus NKX3-2 of the alanine-substituted peptides versus the wild-type p[63−82] peptide) was calculated for each alanine substitution in the amino acid sequence of peptide p[63−82] and is represented by the height of each letter on the y axis (data in Figure S4). (D) Multiple sequence alignment of the human BMP7 p[63−82] peptide with the homologous region in BMP7 of other species.
Figure 6
Figure 6
Peptide p[63−82] activity on OA knee joint tissues Human OA knee joint tissues were cultured for 24 h in the presence of BMP7, peptide p[63−82], or the scrambled version of peptide p[63−82] and compared to control conditions. (A) Cartilage tissues (n = 7 individual donors) were exposed to shown conditions and analyzed for COL2A1, COL10A1, and COX-2 mRNA expression by quantitative real-time PCR (normalized for 28S rRNA expression and relative to control conditions). (B) GAG release in medium from cartilage tissues (n = 5 individual donors) was determined, and data were calculated relative to the control condition. (C) PGE2 levels in culture supernatant from synovium (n = 5 donors). (D) PGE2 levels in culture supernatant from cartilage tissues from (B) (n = 5 donors). (E) PGE2 levels in culture supernatant from IPFP (n = 5 donors). (F) PGE2 levels in culture supernatant from the meniscus. Synovium, IPFP, and meniscus tissues were from the same 5 donors as the cartilage tissues in (B) and (C). PGE2 levels in conditions were calculated relative to controls for each donor. In graphs, error bars represent mean ± SEM; data are presented relative to the control condition for each time point. Statistical differences (unpaired two-tailed Student’s t test) were calculated to control condition: ∗p < 0.05, ∗∗p < 0.01, and ∗∗∗p < 0.001.
Figure 7
Figure 7
BMP7-derived peptide p[63−82] in rat MMT model The potency of BMP7 peptide p[63−82] to delay the progression of trauma-induced cartilage degeneration was tested in the rat MMT model. 1 week post-MMT-surgery, rats were two times per week intra-articularly injected with saline, 100 ng peptide p[63−82] in saline, or 100 ng scrambled peptide p[63−82] in saline (10 rats per group). All injection volumes were 50 μL. At 4 weeks post-MMT surgery, rats were sacrificed for histopathological scoring of the MMT knee joints. (A) Representative micrographs of toluidine blue-stained sections of medial aspects of the MMT knee joints. Conditions are indicated. (B) Medial tibia cartilage-degeneration scores. (C) Medial femur cartilage-degeneration scores. (D) Medial tibia cartilage-degeneration depth ratios. Scores and ratios are shown for zones 1, 2, and 3 individually. The total scores/ratio are cumulative for zone 1, 2, and 3. (E) Total joint scores. Individual data points represent individual rats. Error bars represent mean ± SEM. Statistical differences were calculated between groups (Mann-Whitney U test), and ∗p < 0.05, ∗∗p < 0.01, and ∗∗∗p < 0.001. Other data from this MMT experiment are shown in Figure S5.

References

    1. Loeser R.F., Goldring S.R., Scanzello C.R., Goldring M.B. Osteoarthritis: a disease of the joint as an organ. Arthritis Rheum. 2012;64:1697–1707. - PMC - PubMed
    1. Sofat N. Analysing the role of endogenous matrix molecules in the development of osteoarthritis. Int. J. Exp. Pathol. 2009;90:463–479. - PMC - PubMed
    1. Felson D.T., Lawrence R.C., Dieppe P.A., Hirsch R., Helmick C.G., Jordan J.M., Kington R.S., Lane N.E., Nevitt M.C., Zhang Y. Osteoarthritis: new insights. Part 1: the disease and its risk factors. Ann. Intern. Med. 2000;133:635–646. - PubMed
    1. Dreier R. Hypertrophic differentiation of chondrocytes in osteoarthritis: the developmental aspect of degenerative joint disorders. Arthritis Res. Ther. 2010;12:216. - PMC - PubMed
    1. Tchetina E.V. Developmental mechanisms in articular cartilage degradation in osteoarthritis. Arthritis (Egypt) 2011;2011:683970. - PMC - PubMed

LinkOut - more resources