. 2021 Mar 6;24(4):102277.
doi: 10.1016/j.isci.2021.102277. eCollection 2021 Apr 23.

Comprehensive characterization of migration profiles of murine cerebral cortical neurons during development using FlashTag labeling

Affiliations

Comprehensive characterization of migration profiles of murine cerebral cortical neurons during development using FlashTag labeling

Satoshi Yoshinaga et al. iScience. .

Abstract

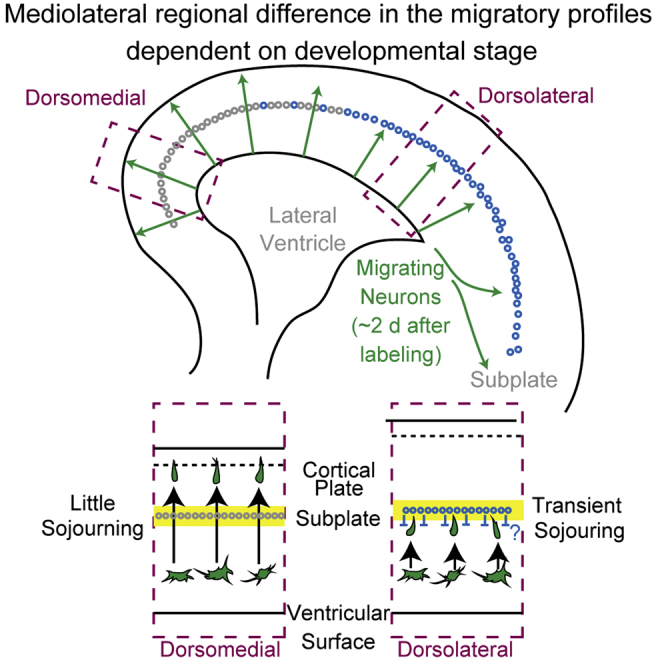
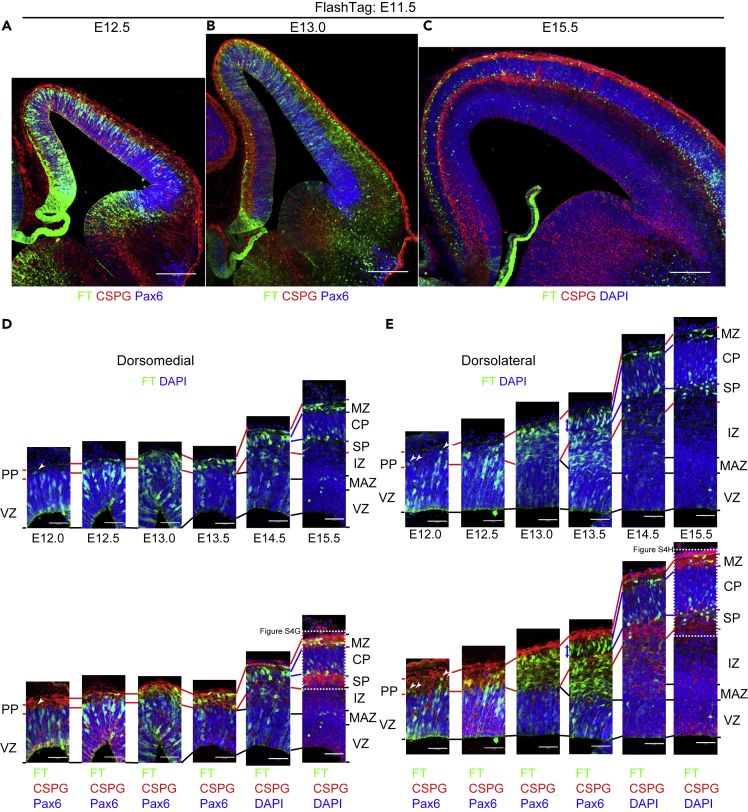
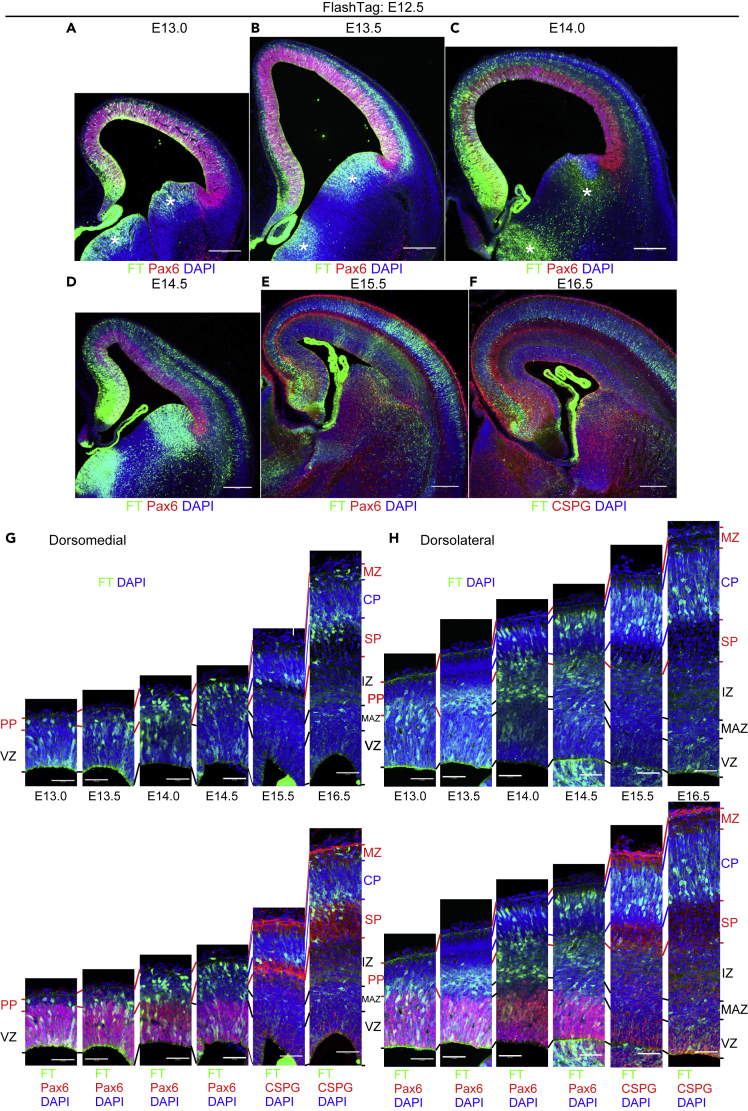
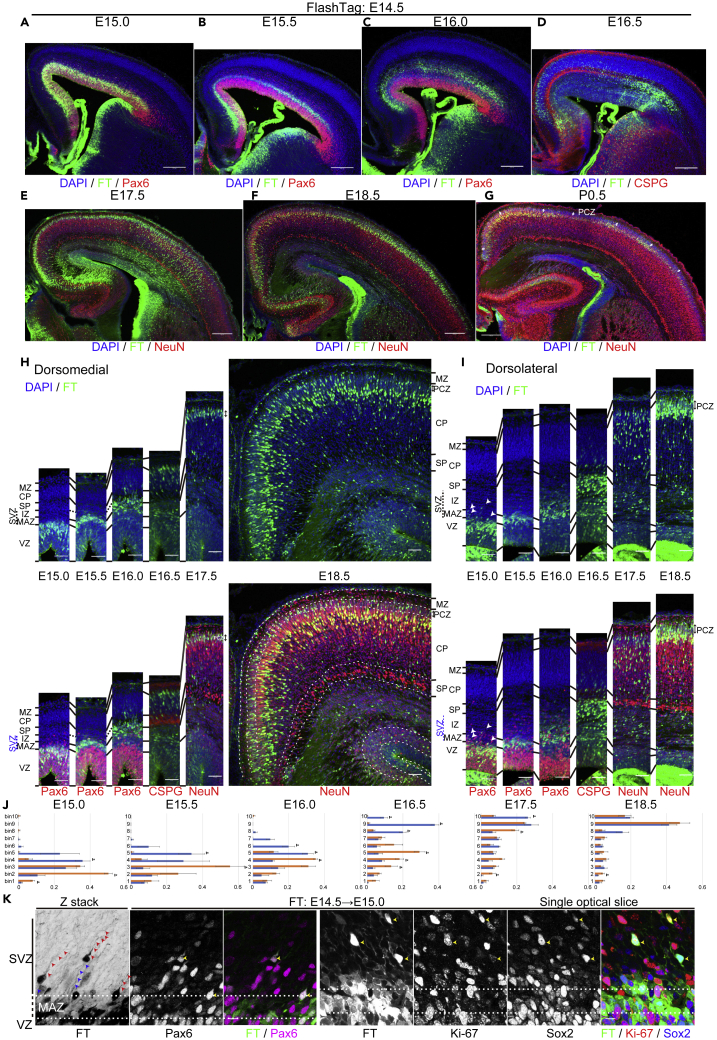
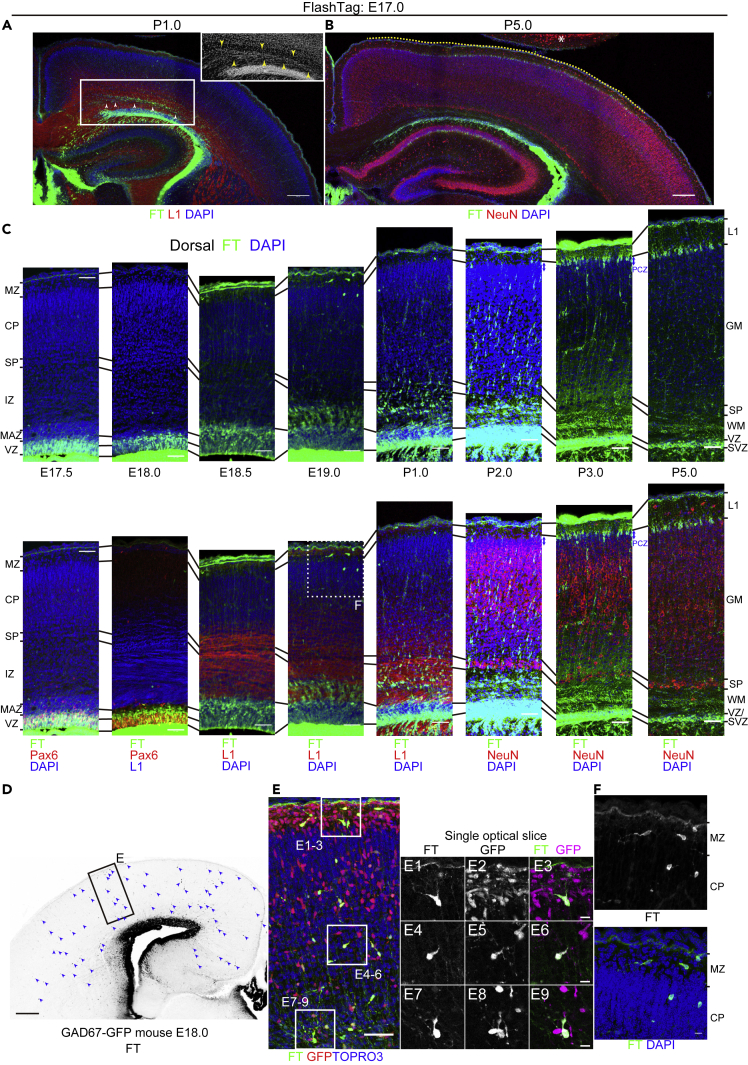
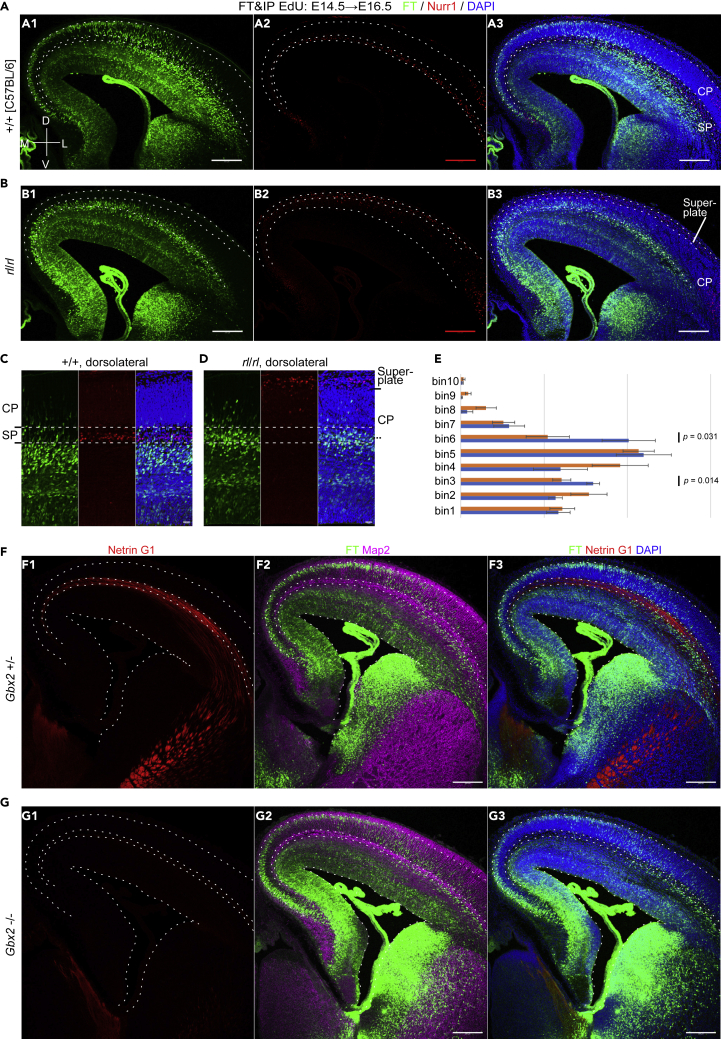
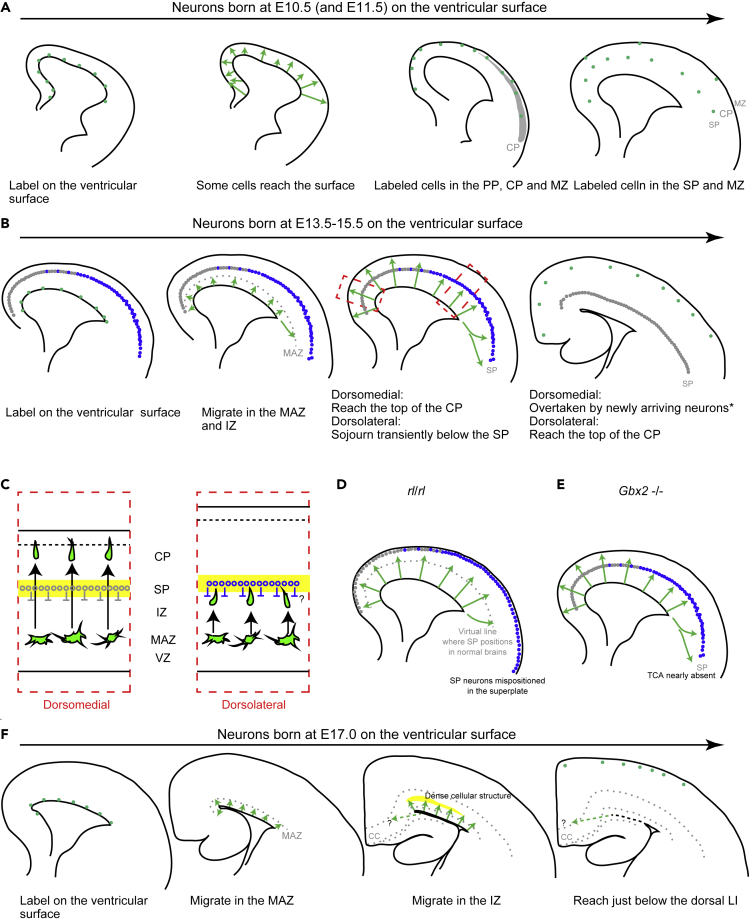
In the mammalian cerebral neocortex, different regions have different cytoarchitecture, neuronal birthdates, and functions. In most regions, neuronal migratory profiles are speculated similar based on observations using thymidine analogs. Few reports have investigated regional migratory differences from mitosis at the ventricular surface. In this study, we applied FlashTag technology, in which dyes are injected intraventricularly, to describe migratory profiles. We revealed a mediolateral regional difference in the migratory profiles of neurons that is dependent on developmental stage; for example, neurons labeled at embryonic day 12.5-15.5 reached their destination earlier dorsomedially than dorsolaterally, even where there were underlying ventricular surfaces, reflecting sojourning below the subplate. This difference was hardly recapitulated by thymidine analogs, which visualize neurogenic gradients, suggesting a biological significance different from the neurogenic gradient. These observations advance our understanding of cortical development and the power of FlashTag in studying migration and are thus resources for future neurodevelopmental studies.

Keywords: Biological Sciences; Developmental Neuroscience; Neuroanatomy; Neuroscience; Techniques in Neuroscience.


Conflict of interest statement

The authors declare no competing interests.

Figures

None
Graphical abstract
Figure 1
Figure 1
Characterization of cell populations labeled with the FlashTag (FT) technology (A–G) 1 mM 5- or 6-(N-succinimidyloxycarbonyl) fluorescein 3′,6′-diacetate (CFSE) was injected into the lateral ventricles (LV) at embryonic day (E)14 of ICR mice and fixed 0.5 (A), 3.5 (B), 6.5 (C), and 9.5 (D) h later. Intraperitoneal bolus injection of 5-ethynyl-2′-deoxyuridine (EdU) was performed maternally 0.5 h before fixation. Photomicrographs from the dorsolateral cortex are shown. In (A), FT-labeled cells are positioned most apically and are often positive for phospho-histone H3 (pH3) (F, −0.5 h, dorsolateral: 36.1% ± 4.0%, 339 cells from five brains; dorsomedial: 35.2% ± 4.7%, 249 cells from 5 brains, t test, p = 0.82) but negative for EdU administered at the same time (G, −0.5 h, dorsolateral: 0.0% ± 0.0%, 339 cells from 5 brains; dorsomedial: 0.0% ± 0.0%, 249 cells from 5 brains, t test not applicable). The nuclei of EdU-positive cells are positioned basally in the VZ. 3.5 h after FT injection, FT-labeled cells have left the ventricular surface but are still near it and are no longer positive for pH3 (B) (F, pH3, −3.5 h, dorsolateral: 2.8% ± 0.7%, 530 cells from 5 brains; dorsomedial: 1.1% ± 0.5%, 415 cells from 5 brains, t test, p = 0.22) (G, EdU, −3.5 h, dorsolateral: 0.76% ± 0.58%, 530 cells from 5 brains; dorsomedial: 2.3% ± 1.2%, 415 cells from 5 brains, t test, p = 0.38). At 6.5 h after labeling, almost no cells are adjacent to the lateral ventricle (C) (F, pH3, −6.5 h, dorsolateral: 0.48% ± 0.34%, 695 cells from 5 brains; dorsomedial: 0.17% ± 0.17%, 501 cells from 5 brains, t test, p = 0.52) (G, EdU, −0.5 h, dorsolateral: 5.6% ± 0.87%, 695 cells from 5 brains; dorsomedial: 5.1% ± 1.3%, 501 cells from 5 brains, t test, p = 0.83). At 9.5 h after labeling, most of the labeled cells are in about the basal two-thirds of the VZ and some are double-labeled for EdU, suggesting that some re-enter the S-phase (D, G) (F, pH3, -9.5 h, dorsolateral: 0.0% ± 0.0%, 711 cells from 5 brains; dorsomedial: 0.37% ± 0.23%, 546 cells from 5 brains, t test, p = 0.19) (G, EdU, −9.5 h, dorsolateral: 15.9% ± 2.5%, 711 cells from 5 brains; dorsomedial: 33.4% ± 6.6%, 546 cells from 5 brains, t test, p = 0.025). A schematic representation of these experiments is shown in (E). In (F), percentages of pH3+ cells based on all FT-labeled cells are shown. Magenta, pH3+ FT+/FT+ in the dorsolateral cortex. Green, pH3+ FT+/FT+ in the dorsomedial cortex. In (G), percentages of EdU+ cells of all FT-labeled cells are shown. Orange, EdU+ FT+/FT+ in the dorsolateral cortex. Blue, EdU+ FT+/FT+ in the dorsomedial cortex. (H–L) EdU was administered 3 (I), 6 (J), and 9 (K) h before FT labeling. At 0.5 h after FT labeling, the brains were harvested. A schematic representation of these experiments is shown in (H). Nuclei of the EdU-labeled cells are positioned more apically in brains in which EdU was administered 3.5 h before fixation (I) compared with (A), and some of the EdU-labeled cells are positioned at the ventricular surface to enter the M phase (interkinetic nuclear migration). In brains in which EdU was administered 6.5 (J) and 9.5 (K) h before fixation, EdU-labeled cells positioned even more apically. In mice treated with EdU 3–9 h before FT, FT-labeled cells are often co-labeled with EdU (I–K) (L, −9.5 h: dorsolateral, 76.6% ± 2.4%, 328 cells from 5 brains, dorsomedial, 65.1% ± 1.5%, 369 cells from 5 brains, t test, p = 0.014; −6.5 h: dorsolateral, 96.1% ± 0.5%, 304 cells from 5 brains, dorsomedial, 96.7% ± 1.2%, 217 cells from 5 brains, t test, p = 0.58; −3.5 h: dorsolateral, 81.2% ± 1.9%, 263 cells from 6 brains, dorsomedial, 81.5% ± 1.9%, 287 cells from 6 brains, t test, p = 0.92). Note that EdU and FT never co-label when administered simultaneously (A). In the graph in (L), the percentage of EdU+ cells based on all FT-labeled cells is shown. Data for −0.5 h in (L) correspond to those for −0.5 h in (G). Orange, EdU+ FT+/FT+ in the dorsolateral cortex. Blue, EdU+ FT+/FT+ in the dorsomedial cortex. (M–O) CytoTell Blue was injected into the LV of the E12.5 (M–N) and 15.5 (O) GAD67-GFP brains. In the E15.5 dorsolateral cortex labeled at E12.5, most of the labeled cells (red) are in the deep part of the cortical plate (CP) (M, N). The majority of the labeled cells are negative for GFP (E12.5–15.5 dorsolateral cortex, 93.3% ± 2.5%, 1,653 cells from 3 brains) (N, N1–3). In postnatal day (P)1 dorsolateral cortex labeled at E15.5 (O), most of the labeled cells are found in the superficial gray matter (GM). Again, most of the labeled cells are negative for GFP (E15.5–P1, 95.5% ± 0.5%, 1,455 cells from 5 brains) (O, O1–3). Arrowheads in (N) and (O) show rare examples of cells positive for both FT and GFP. Scale bars: 20 μm in (A–D, I–K, N3, O3), 50 μm in (N, O), and 200 μm in (M). See also Figure S1. Data are presented as mean ± standard error of the mean (SEM). The sample numbers in the statistical analyses refer to the number of brains.
Figure 2
Figure 2
Regional differences in neuronal migration in the cerebral cortex revealed by FT (A–C) To visualize the migration profile of the whole telencephalon, CFSE was injected into the ventricles of the E14.5 embryos, and 5-ethynyl-2′-deoxyuridine (EdU) was injected into the peritoneal cavity of the mother at the end of the surgery. Harvested at E16.5, many cells labeled with FT reach the superficial part of the CP in the dorsomedial cortex (cyan dotted line), whereas almost no cells reach the CP in the dorsolateral cortex (A, C). In the dorsolateral cortex, many neurons are just below the subplate (SP) (yellow dotted line). Such a clear difference in neuronal migration is not detected by EdU (B, C). (D) FT labeling was performed at E14.0, and slice culture was prepared at E14.5. Labeled cells left the VZ and migrate in the MAZ in multipolar morphology (10:08–25:21). They gradually acquire polarity and migrate in the intermediate zone (IZ) (20:17–30:25), reaching points just below the SP (the relatively dark band in the transmitted light channel, highlighted by white arrows). Neurons in the dorsomedial cortex (more medial than the magenta arrow) migrate smoothly to reach the most superficial part of the cortical plate (25:21–30:25), whereas in the dorsolateral cortex (more lateral than the magenta arrow), neurons seem to sojourn transiently below the SP (clear in the regions lateral to the magenta arrow; 30:25–35:29). These cells subsequently migrate into the CP in locomotion mode (35:29–40:34). (E) FAST 3D imaging of E16.5 brains in which FT labeling was performed at E14.5. Anterior and posterior representative sections are shown in addition to a section at the interventricular foramen. Video S1 shows a 3D video taken from this brain. M, medial; L, lateral; D, dorsal; V, ventral. Scale bars: 200 μm in (A–C and E) and 100 μm in (D). See also Figure S2.
Figure 3
Figure 3
Cohort of cells born at E10.5 (A–E) Coronal sections of 12.5 (A), 13.5 (B), and 16.5 (C) brains labeled at E10.5. See also Figure S2 for coronal sections from E11.5 to 16.5, shown with FT and 4′,6-diamidino-2-phenylindole (DAPI). Higher-magnification micrographs from the dorsomedial cortex and dorsolateral cortices from E11.5 to 16.5 are shown in (D) and (E), respectively. As early as E11.5, some cells are found in the preplate (PP), which is very thin in the dorsomedial cortex, as well as in the VZ (D, E, Figure S3A). At E12.5, many cells are in the PP, sometimes in a tangential morphology (A, D, and E). At E13.5, CSPG and nuclear staining show that PP splitting proceeds in a lateral-to-medial direction, and the CP (asterisks) is observed in the dorsolateral cortex but not in the dorsomedial cortex (B). In the dorsomedial cortex, labeled cells are in the PP, often with a somewhat rounded morphology (D). In the dorsolateral cortex, on the other hand, many labeled cells are in the CP (shown with blue arrows) and MZ (E). Note that few cells are found below the CP, as identified by nuclear and CSPG staining (B, E, Figure S3C). At E14.5, a thin CP is also identified in the dorsomedial cortex (D, E, Figure S2D). Some labeled cells are seen in the deep part of the CP in the dorsomedial cortex, but many labeled cells are still in the MZ (D). In the dorsolateral cortex, many labeled cells are found near the boundary between the CP and SP (E, Figure S3D). At E15.5, labeled cells are found at the boundary between the SP and CP as well as in the MZ in the dorsomedial cortex (D, Figures S3E and S3E′), which is similar to the dorsolateral cortex of E14.5 (E, Figure S3D). In the E15.5 dorsolateral cortex, many labeled cells are in the CSPG-positive SP (D, E, Figures S3E and S3E′). At E16.5, in both the dorsomedial and dorsolateral cortices, labeled cells are mainly found in the SP (C, D, and E). Some cells are also found in the MZ (D, E, Figure S3G). Note that CSPG staining in the SP shows some double-track immunoreactivity strongly just above and below a distinct cell layer in the SP in the dorsal and dorsolateral cortex at E15.5–E16.5 (E). The emergence of the labeled cells in the SP seems to coincide with the emergence of a distinct layer. Scale bars: 200 μm in (A–C) and 50 μm in (D, E).
Figure 4
Figure 4
Cohort of cells born at E11.5 (A–E) Coronal sections of E12.5 (A), 13.0 (B), and 15.5 (C) brains, all labeled at E11.5. Higher-magnification micrographs from the dorsomedial and dorsolateral cortices of E12.5 through E15.5 are shown in (D) and (E), respectively. See also Figure S4 for low-magnification micrographs of brains fixed at E12.5 through E15.5. At E12.0, most of the labeled cells are in the VZ, and some cells are in the CSPG-positive PP in both the dorsomedial and dorsolateral cortices (D, E, arrowheads, Figure S4A). At E12.5 and 13.0, more labeled cells are found in the PP in both dorsomedial (A, B, D, Figures S4B and S4C) and dorsolateral cortices (A, B, E, Figures S4B and S4C). At E13.5, in the dorsomedial cortex, where PP splitting does not occur at this stage, many neurons reach the PP just beneath the meninges (D, Figure S4D). Many labeled cells are in the newly formed CP and intermediate zone (IZ) in the dorsolateral cortex (E, Figure S4D). At E14.5, many cells are in the newly formed CP in both the dorsomedial and dorsolateral cortices (D, E, Figure S4E). At E15.5, many cells are in the lower part of CP and, to a lesser extent, the MZ (C, D, E, Figures S4F–S4H). Some cells are also found in the SP in the dorsolateral cortex (C, E, Figures S4F and S4H). Scale bars, 200 μm in (A–C) and 50 μm in (D, E).
Figure 5
Figure 5
Cohort of cells born at E12.5 (A–H) Coronal sections of E13.0 (A), 13.5 (B), 14.0 (C), 14.5 (D), 15.5 (E), and 16.5 (F), all brains labeled at E12.5. Higher-magnification micrographs from the dorsomedial cortex and dorsolateral cortex are shown in (G) and (H), respectively. In the dorsomedial cortex at E13.0, many labeled cells are in the VZ, but a small number of labeled cells are also found in the PP (A, G, Figure S5G). At E13.5, more labeled cells are in the PP in addition to the VZ in the dorsomedial cortex (B, G). At this stage, the incipient CP appears in the dorsolateral cortex, and many labeled neurons are migrating in the IZ (B, H). In the dorsomedial cortex of E14.0, when the incipient CP is beginning to form, some labeled cells reach points just beneath the meningeal surface, whereas others seem to be still migrating (C, G). In the dorsolateral cortex, many neurons reach the superficial part of the CP, whereas others continue migrating in the IZ and CP (C, H). At E14.5, labeled cells in the dorsomedial cortex begin to be oriented radially just beneath the MZ (D, G). In the dorsolateral cortex, many strongly labeled cells are in the CP in addition to the IZ (D, H). At E15.5, most of the labeled cells distribute not only the superficial CP but also in the deep part of the CP in both the dorsomedial and dorsolateral CP, suggesting that some begin to move deeper (E, G, H). At E16.5, the main population of the labeled cells is in the somewhat deeper part of the CP in both the dorsomedial and dorsolateral cortices. In the dorsomedial cortex, many labeled cells are also distributed in the SP. Scale bars: 200 μm in (A–F) and 50 μm in (G, H).
Figure 6
Figure 6
Cohort of cells born at E14.5 (A–K) Coronal sections of E15.0 (A), 15.5 (B), 16.0 (C), 16.5 (D), 17.5 (E), 18.5 (F), and P0.5 (G) brains, all labeled at E14.5. Higher-magnification micrographs from the dorsomedial and dorsolateral cortices are shown in (H) and (I), respectively. Quantitative data of migratory profiles of the dorsolateral and dorsomedial cortices are shown in (J). Higher magnification of the apical part of the dorsolateral cortical wall of E15.0 (0.5 days after injection) brains is shown in (K). At E15.0, most of the labeled cells are in the VZ in both the dorsomedial and dorsolateral cortices (A, H, and I). Some labeled cells are located outside the VZ in the dorsolateral cortex (A, I, and K), but such cells are not frequently found in the dorsomedial cortex (A, H). The labeled cells located basally often have a long ascending process (red arrowheads, K, left) as well as some retraction bulbs (blue arrowheads) and are immunoreactive for Pax6, Sox2, and Ki-67 (yellow arrowheads, K, right). Note that the ascending processes are so long that it is difficult to observe their full length in the IZ crowded with radial fibers, which are also labeled with FT. At E15.5, most of the labeled neurons are in the MAZ with multipolar morphology in both the dorsomedial and dorsolateral cortices (B, H, and I). At E16.0, most of the labeled cells are in the IZ (C, H, and I). At E16.5 in the dorsomedial cortex, many cells reach the most superficial part of the CP (D, H). On the other hand, in the dorsolateral CP, most of the labeled cells migrate in the IZ just beneath the SP (D, I; see also Figures 2A and 2C). At E17.5, the vast majority of the labeled cells in the dorsomedial cortex are in the PCZ, which is the most superficial part of the CP (E, H). In the dorsolateral cortex, most of the labeled cells continue migrating in the CP (E, I). At E18.5, the labeled cells in the dorsomedial cortex are distributed not only in the PCZ but also in the slightly deeper part of the CP as NeuN-positive mature neurons (F, H). In the dorsolateral cortex, most of the labeled cells are in the PCZ (F, I). At P0.5, in the dorsolateral cortex, many labeled cells are distributed in the slightly deeper part of the CP as NeuN-positive mature neurons (G). Small double-headed arrows show the PCZ. A bin analysis was performed for these migration profiles by dividing the cortical wall between the top of the MZ and the ventricular surface into 10 equal areas (10 bins), and the proportion of FT-labeled cells in each bin was calculated from three or more different brains (J) (E15.0, n = 4 brains; E15.5, n = 3; E15.5, n = 3; E16.5, n = 4; E17.5, n = 3; E18.5, n = 3). ∗p < 0.05 (t test). Data are presented as mean ± SEM. At earlier stages, such as E15.0, cellular positions in the dorsomedial cortex are biased superficially because the dorsomedial cortex is thinner (Figure S8J). Scale bars: 200 μm in (A–G), 50 μm in (H, I), and 10 μm in (K). See also Figures S6–S11.
Figure 7
Figure 7
Cohort of cells labeled at E17.0 (A–C) Coronal sections of P1.0 (A) and P5.0 (B) brains labeled at E17.0. See also Figure S12 for lower-magnification micrographs of E17.5 through P5. Higher-magnification images of E17.5 through P5 from the dorsal cortex are shown in (C). At E17.5, most of the labeled cells are in the VZ (C). At E18.0, most of the labeled cells are in the VZ and MAZ (C). A small number of labeled cells are also found throughout the cortex sparsely (D). At E18.5, many labeled cells are found in the MAZ (C). Some labeled cells are sparsely distributed throughout the cortex. At E19.0, many cells enter the L1-positive IZ dorsally (C). A small number of cells are also found in the MZ and CP (F). At P1.0, many labeled cells are migrating in the IZ/white matter (WM) (A, C). Migrating cells form a slightly denser cellular structure (inset in A) sandwiched between L1-positive axon bundles (arrowheads in A). At P2.0, many neurons are migrating in the CP/cortical gray matter (GM) with a locomotion morphology (C). At P3.0, many labeled cells reach the dorsal PCZ (C). At P5.0, most of the labeled cells are in the most superficial part of the GM (B, C). Note that many cells are in the dorsal (and dorsolateral) cortex (yellow dotted line), and few cells are in the dorsomedial and lateral cortices. (D–F) Analyses of GABAergic interneurons. Cells labeled with FT (CytoTell Blue) at E17.0 are sparsely distributed throughout the cortex at E18.0 (D, E), and they are mostly positive for GFP in GAD67-GFP mice (E). Labeled cells with similar morphologies are found in the MZ/Layer I and in the CP at E19.0 before the main population of labeled cells reaches the CP (F). Scale bars: 200 μm in (A, B, and D), 50 μm in (C, E), and 10 μm in (E3, E6, E9, F). ∗ indicates another brain on the same slide.
Figure 8
Figure 8
Regional differences in neuronal migration in reeler mutants and Gbx2 −/− mice (A–E) In wild-type brains, Nurr1+ cells are observed in the SP (A), whereas in reeler mice, Nurr1+ cells are mostly observed in the superplate or beneath the meninges (B). FT was performed at E14.5, and the brains were fixed at E16.5. In contrast to wild-type mice, which clearly show regional differences in neuronal migration (A), regional differences are not clear in reeler mice (B). The main population of labeled cells in the dorsolateral cortex is observed below the SP in the controls (C). In reeler mice, many neurons migrate in a zone that roughly corresponds to the deep part of the CP where SP neurons should normally position (D). Quantitatively, we observed more labeled neurons in bin 6 (E) of reeler mice (rl/rl: 20.2% ± 3.2%, 10 brains; control: 10.5% ± 2.6%, 8 brains [3 +/+ brains and 5 rl/+ brains] from 4 mother mice; p = 0.031, t test). Bins other than bin 6 and bin 3 (p = 0.014) did not reach statistical significance (p > 0.05). The sample numbers in the statistical analyses are the number of brains. (F and G) In Gbx2 +/− brain, Netrin G1-positive thalamocortical axons run through the SP (F1). In Gbx2 −/− brain, Netrin G1-positive thalamocortical axons are almost absent in the cortex (F2). In both cases, many neurons are observed just beneath the SP. FT labeling was performed at E14.5, and the brains were fixed 50 h later. Coronal sections slightly caudal to the main part of the interventricular foramina are shown to confirm Netrin G1 immunoreactivity in the dorsal thalamus of Gbx2 −/− brains, where cortical Netrin G1 immunoreactivity was almost absent (positive control of Netrin G1 staining). M, medial; L, lateral; D, dorsal; V, ventral. Scale bars: 200 μm in (A, B, F, G) and 50 μm in (C, D). See also Figures S13. Data are presented as mean ± SEM.
Figure 9
Figure 9
Schematic representation of migratory profiles of the main population labeled at different embryonic stages (A) Cells labeled at very early stages (E10.5–E11.5) enter the PP soon after they leave the VZ. They next position in the incipient CP and MZ. They then move down their somata deeply to locate below the CP, or in the SP, in a lateral-early to medial-late fashion. At these stages, Cajal-Retzius cells are also labeled. (B) Cells labeled at early to late stages (E13.5–E15.5) enter and accumulate in the MAZ. Neurons labeled at E14.5, for example, migrate in the IZ superficially and reach the CP early in the dorsomedial cortex. In the dorsolateral cortex, they sojourn transiently below the SP before entering the CP. After reaching the PCZ, labeled neurons are overtaken by newly arriving neurons. This is not clear in the dorsomedial neurons labeled at E15.5 (Figure S10A), probably because few neurons labeled later distribute in this region (Figure 7B, ∗). (C) A hypothetical mechanism of regional differences in neuronal migration at these stages. The SP neurons (or some other structures in the SP) transiently decelerate the migration of neurons in the dorsolateral cortex. (D) Migratory profiles in reeler brains labeled at E14.5; the SP neurons are mispositioned above the CP as superplate neurons. (E) Migratory profiles in Gbx2 −/− brains labeled at E14.5. The thalamocortical axons are almost absent in the cortex of Gbx2 −/− brains. (F) Cells labeled at very late stages (E17.0) migrate slowly through the MAZ and a dense cellular structure in the dorsal IZ or WM. Most of the labeled cells settle in the most superficial part of the dorsal GM.

Similar articles

Cited by

References

    1. Anderson S.A., Eisenstat D.D., Shi L., Rubenstein J.L. Interneuron migration from basal forebrain to neocortex: dependence on Dlx genes. Science. 1997;278:474–476. - PubMed
    1. Angevine J.B., Jr., Sidman R.L. Autoradiographic study of cell migration during histogenesis of cerebral cortex in the mouse. Nature. 1961;192:766–768. - PubMed
    1. Arlotta P., Molyneaux B.J., Chen J., Inoue J., Kominami R., Macklis J.D. Neuronal subtype-specific genes that control corticospinal motor neuron development in vivo. Neuron. 2005;45:207–221. - PubMed
    1. Bayer S.A., Altman J. Raven Press; 1991. Neocortical Development.
    1. Bicknese A.R., Sheppard A.M., Leary D.D., Pearlman A.L. Thalamocortical axons extend along a chondroitin sulfate proteoglycan- enriched pathway coincident with the neocortical subplate and distinct from the efferent path. J. Neurosci. 1994;14:3500–3510. - PMC - PubMed

LinkOut - more resources