. 2021 Jul 1;321(1):L65-L78.
doi: 10.1152/ajplung.00421.2020. Epub 2021 Apr 14.

Lung immune tone via gut-lung axis: gut-derived LPS and short-chain fatty acids' immunometabolic regulation of lung IL-1β, FFAR2, and FFAR3 expression

Affiliations

Lung immune tone via gut-lung axis: gut-derived LPS and short-chain fatty acids' immunometabolic regulation of lung IL-1β, FFAR2, and FFAR3 expression

Qing Liu et al. Am J Physiol Lung Cell Mol Physiol. .

Abstract

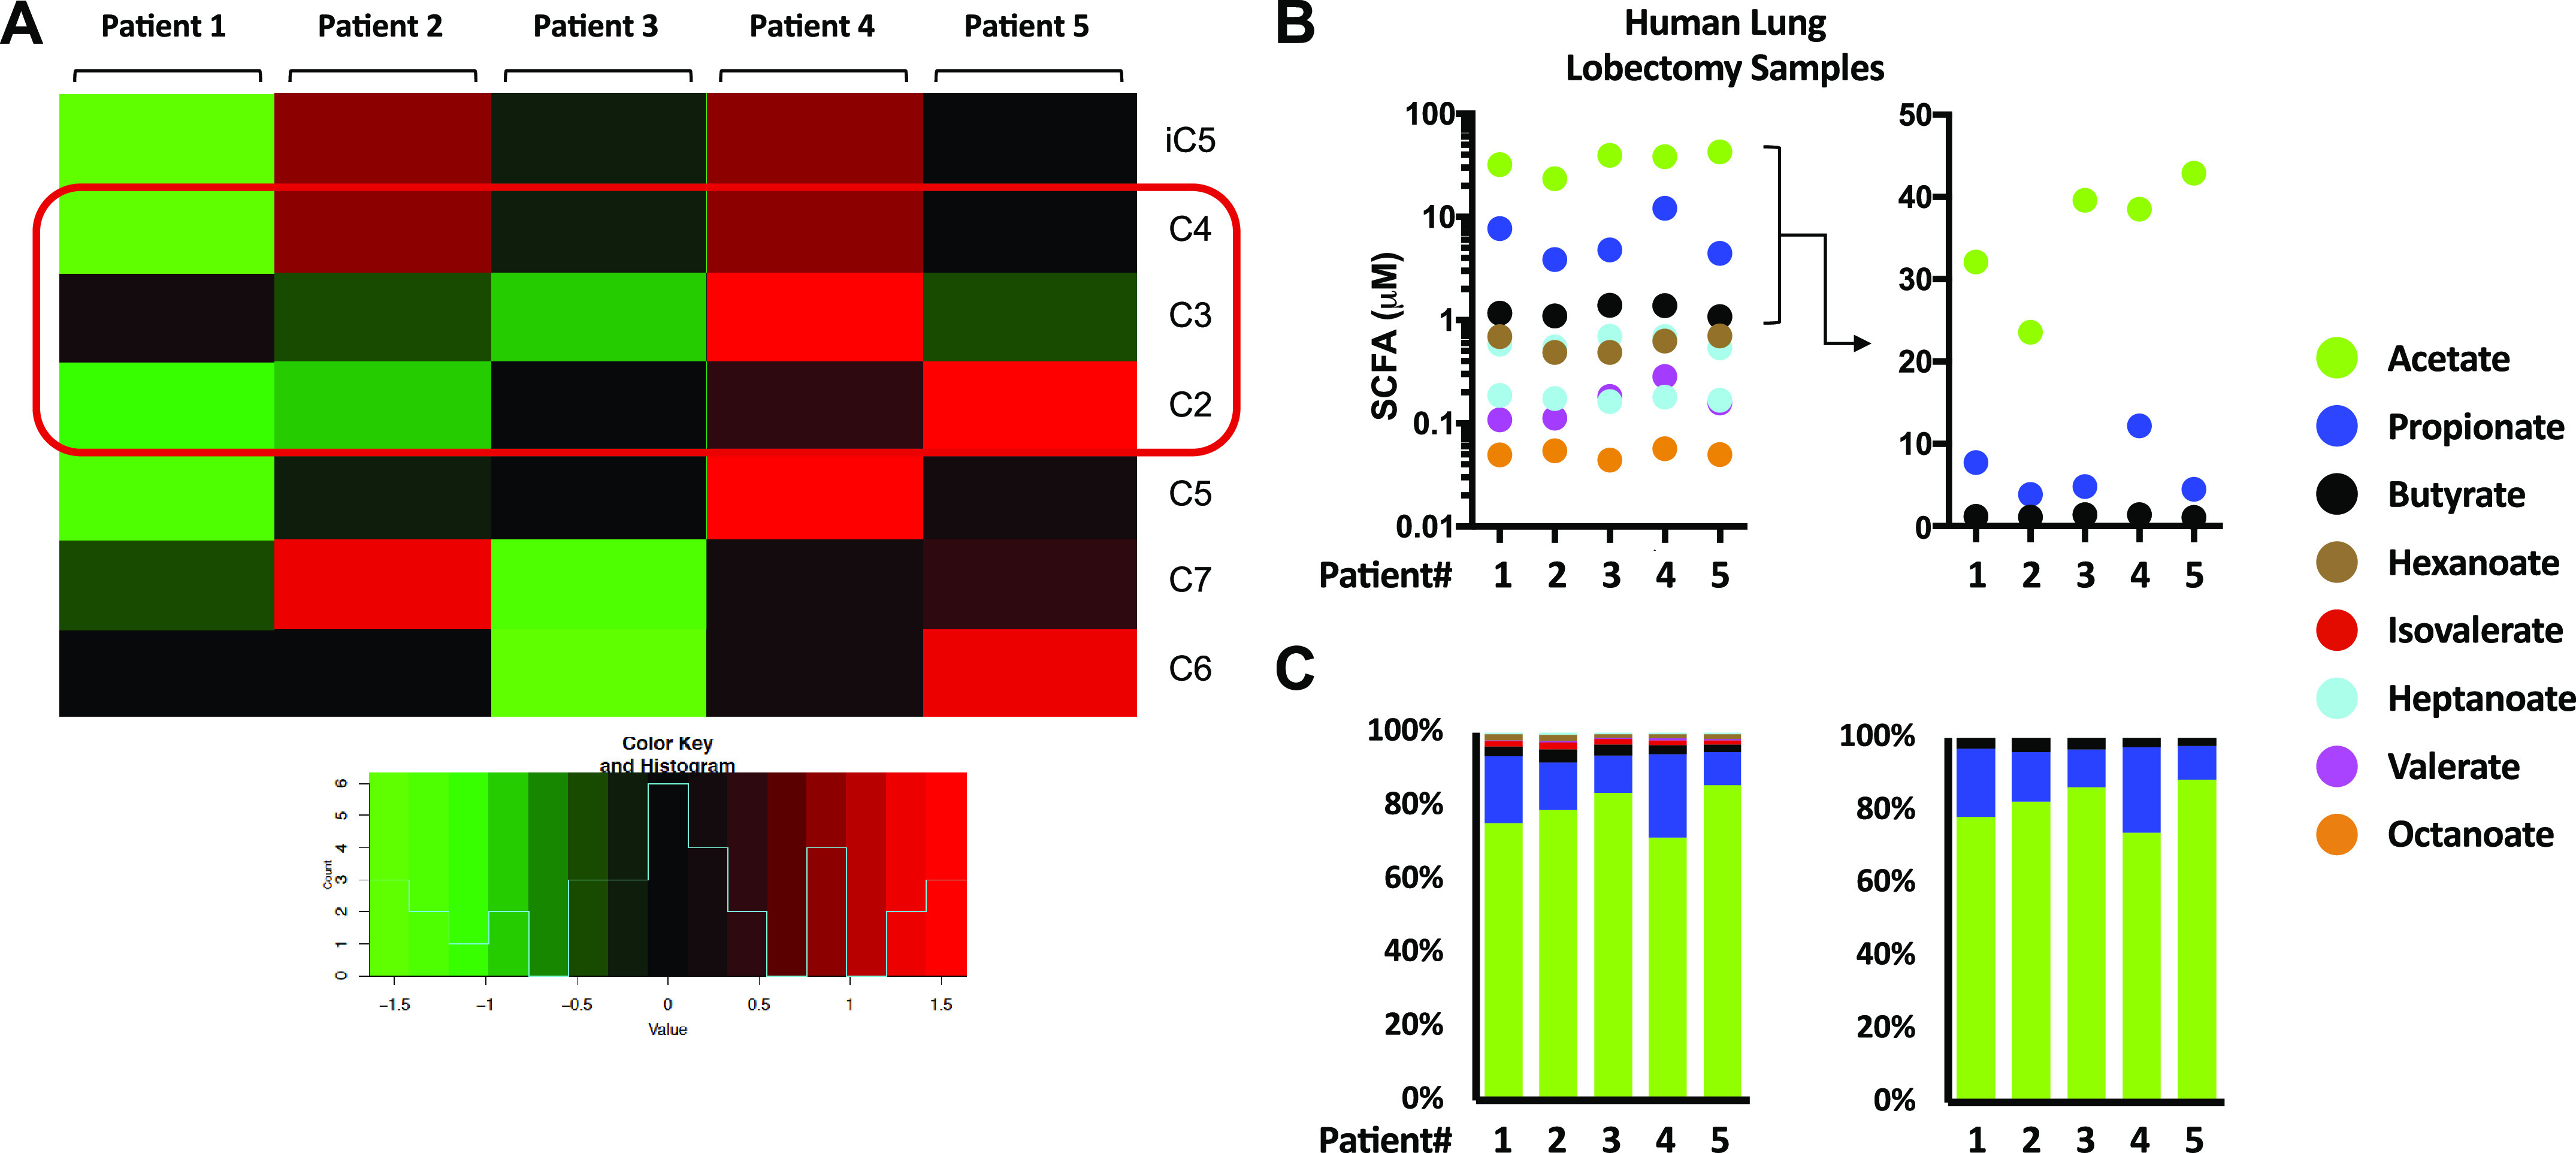
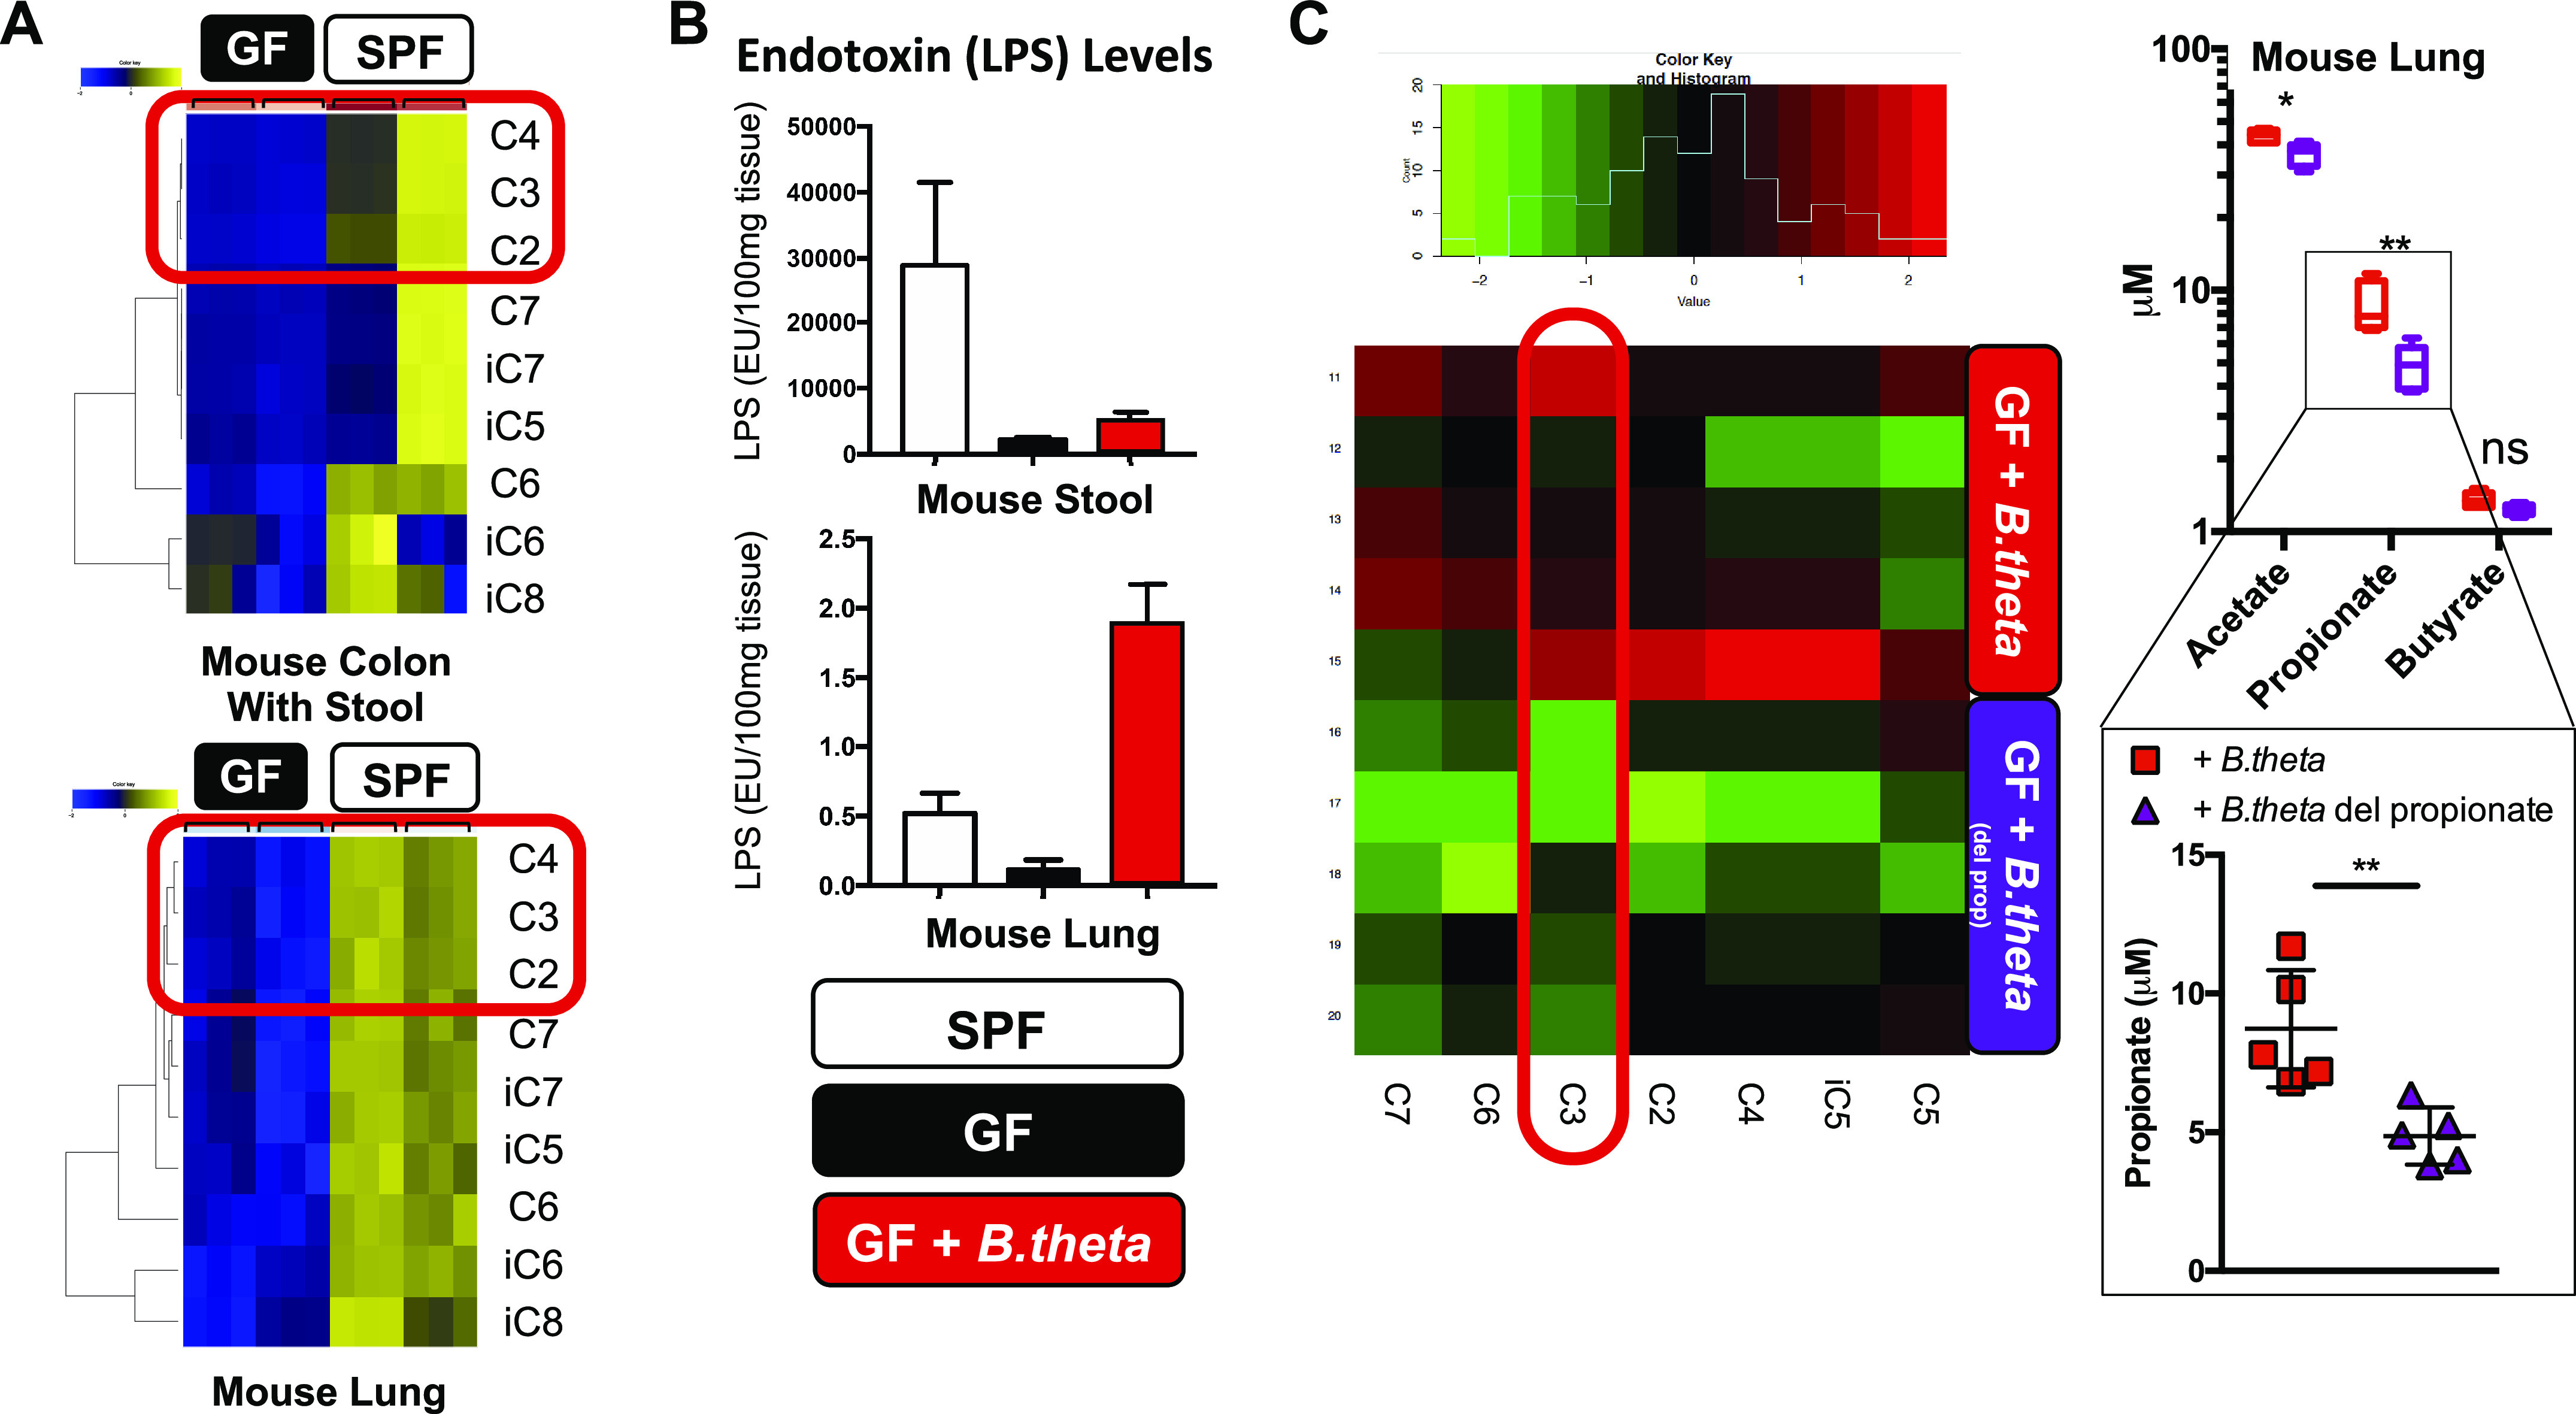
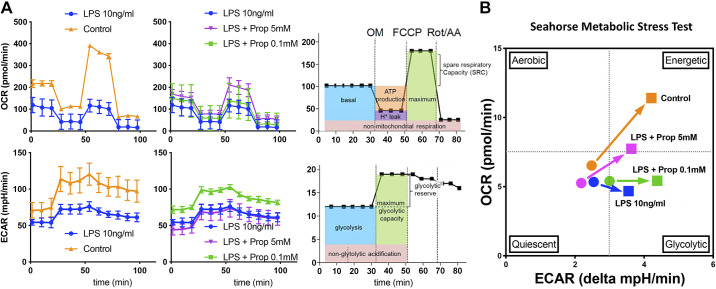
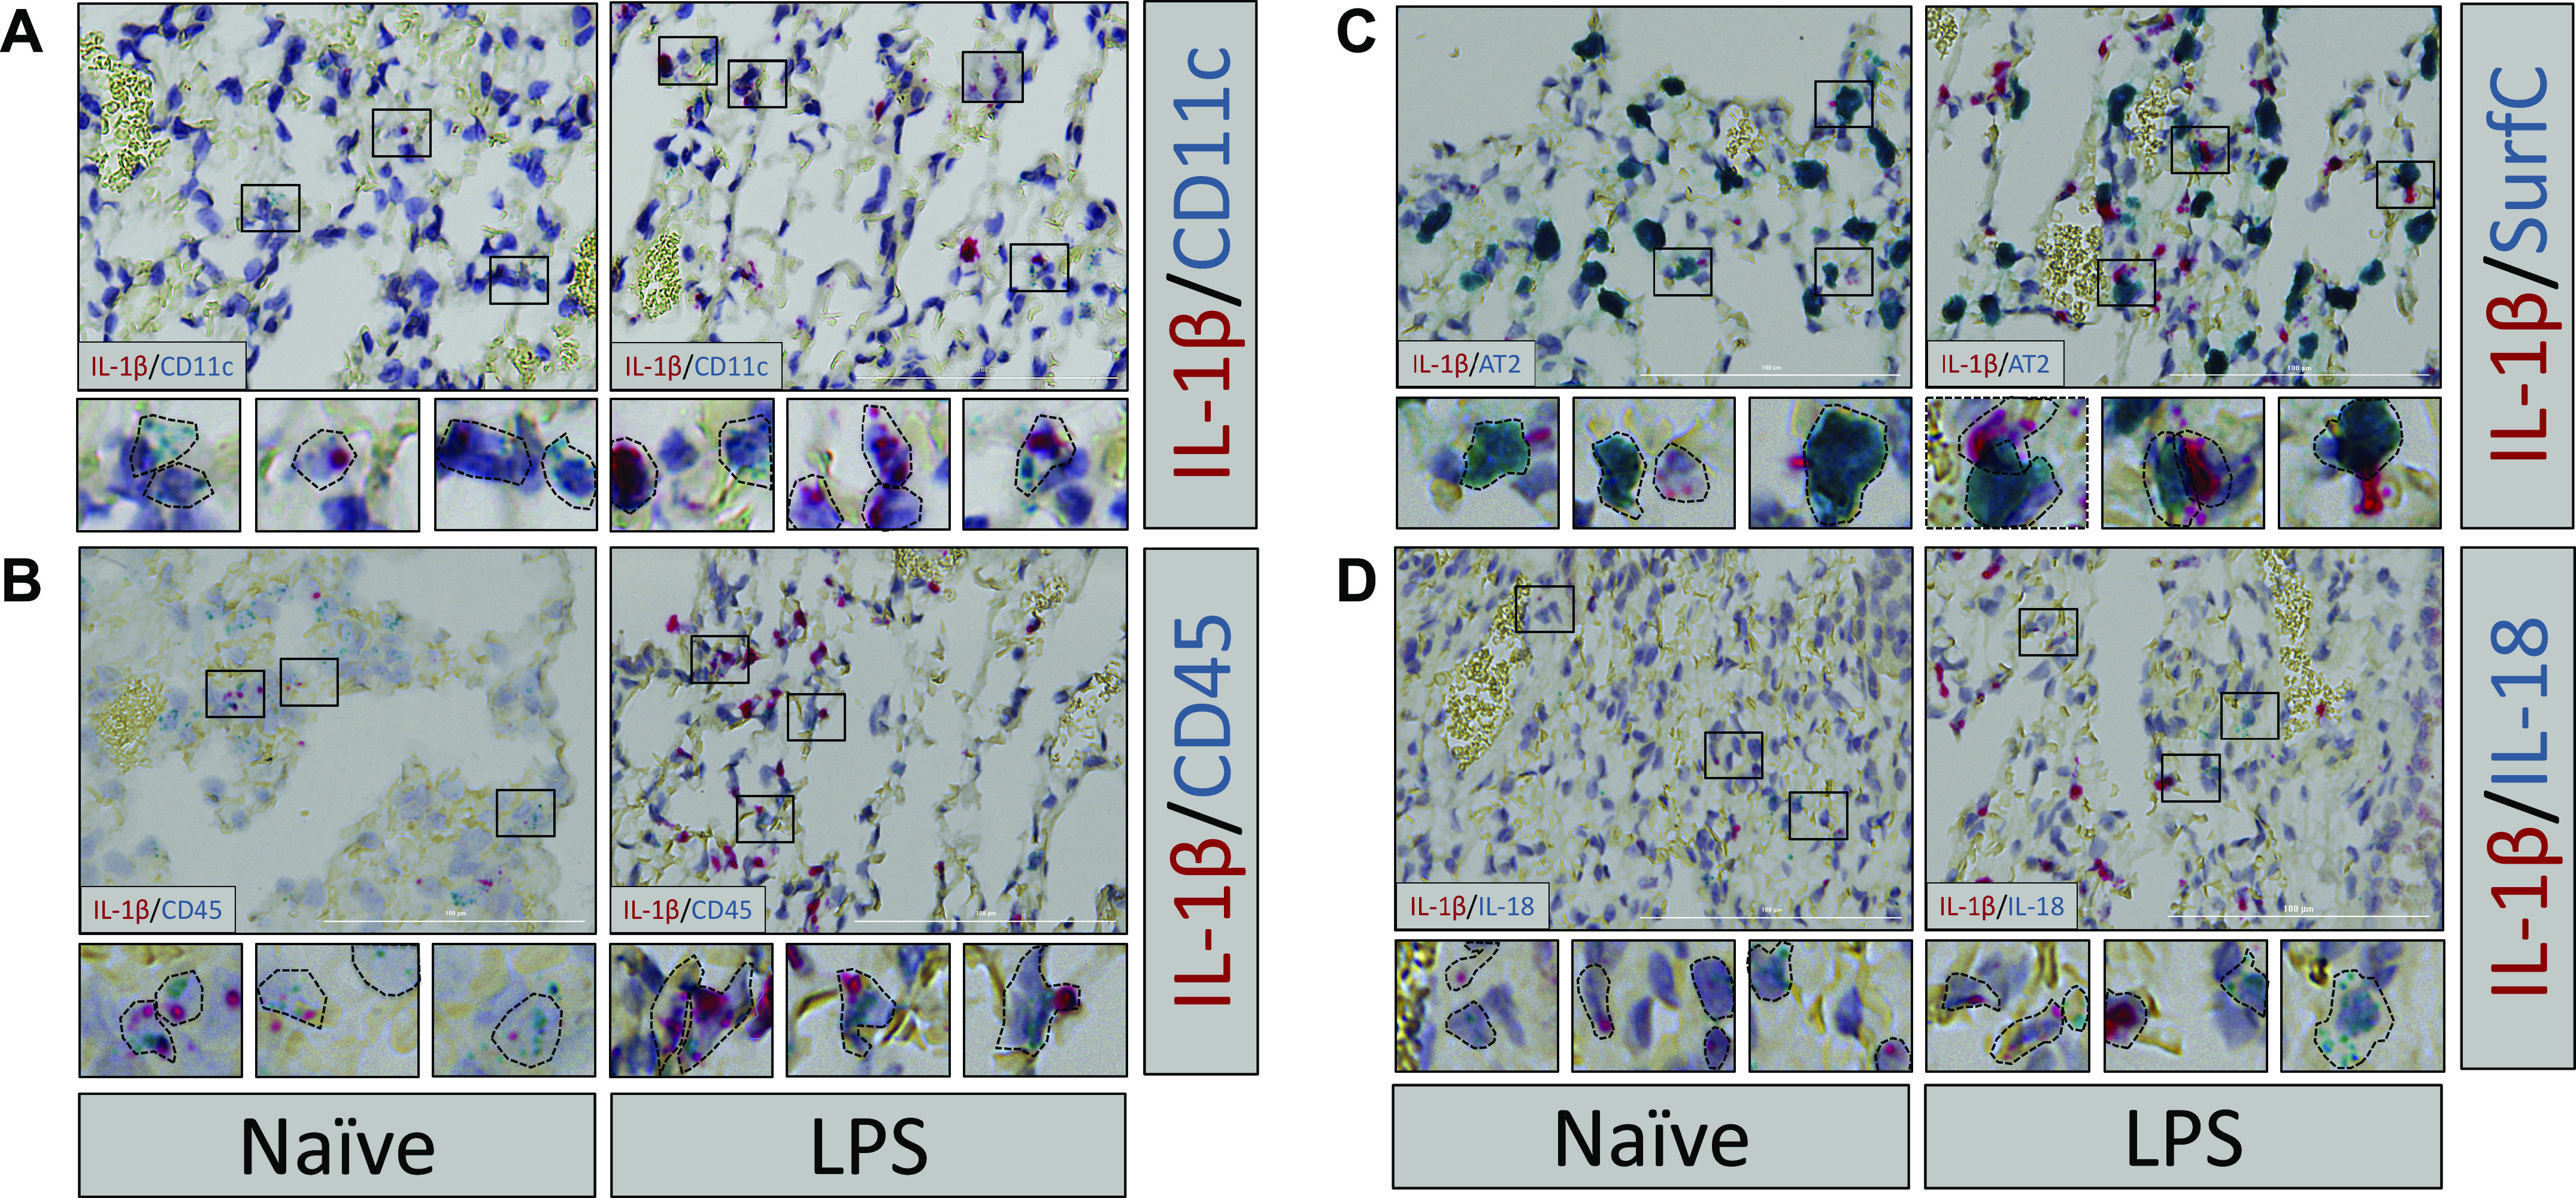
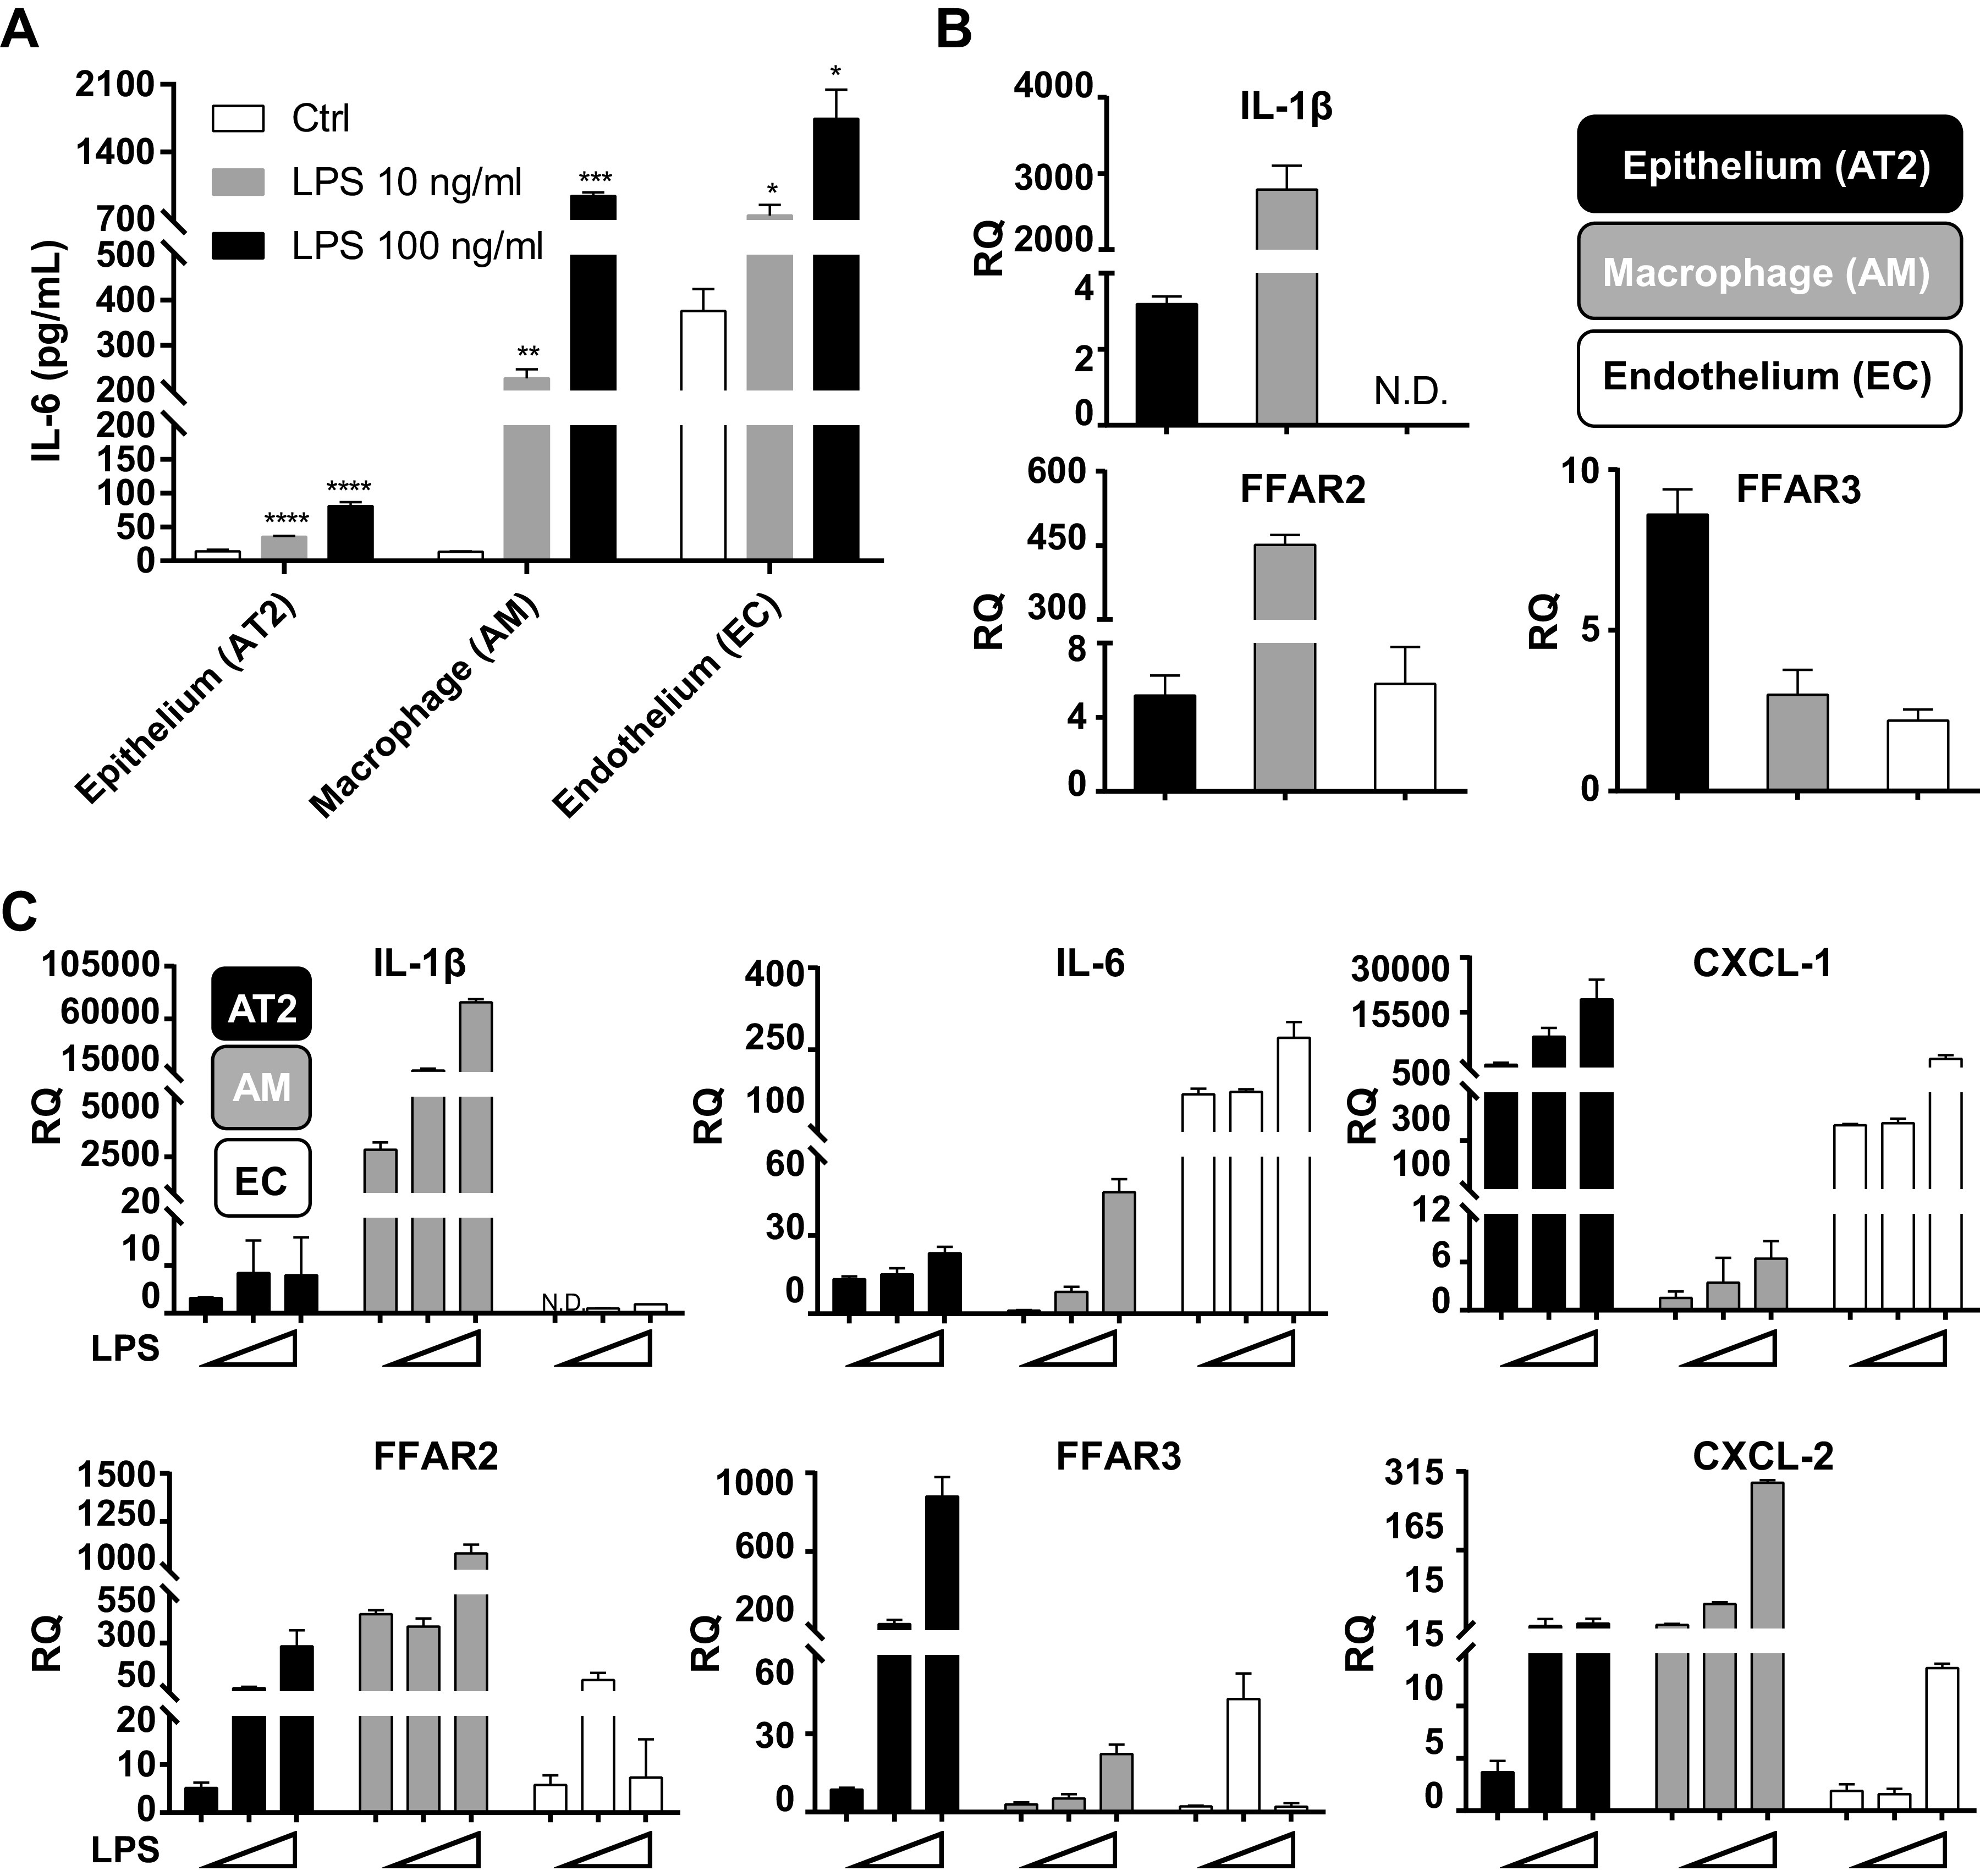
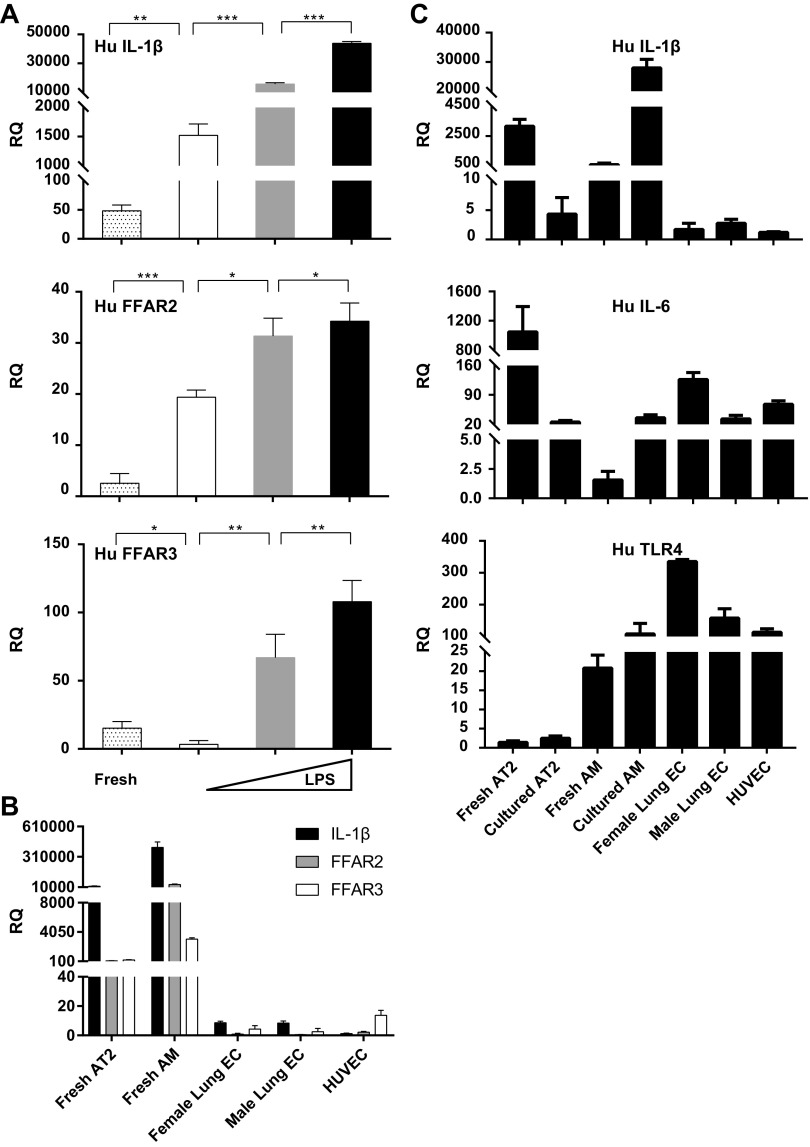
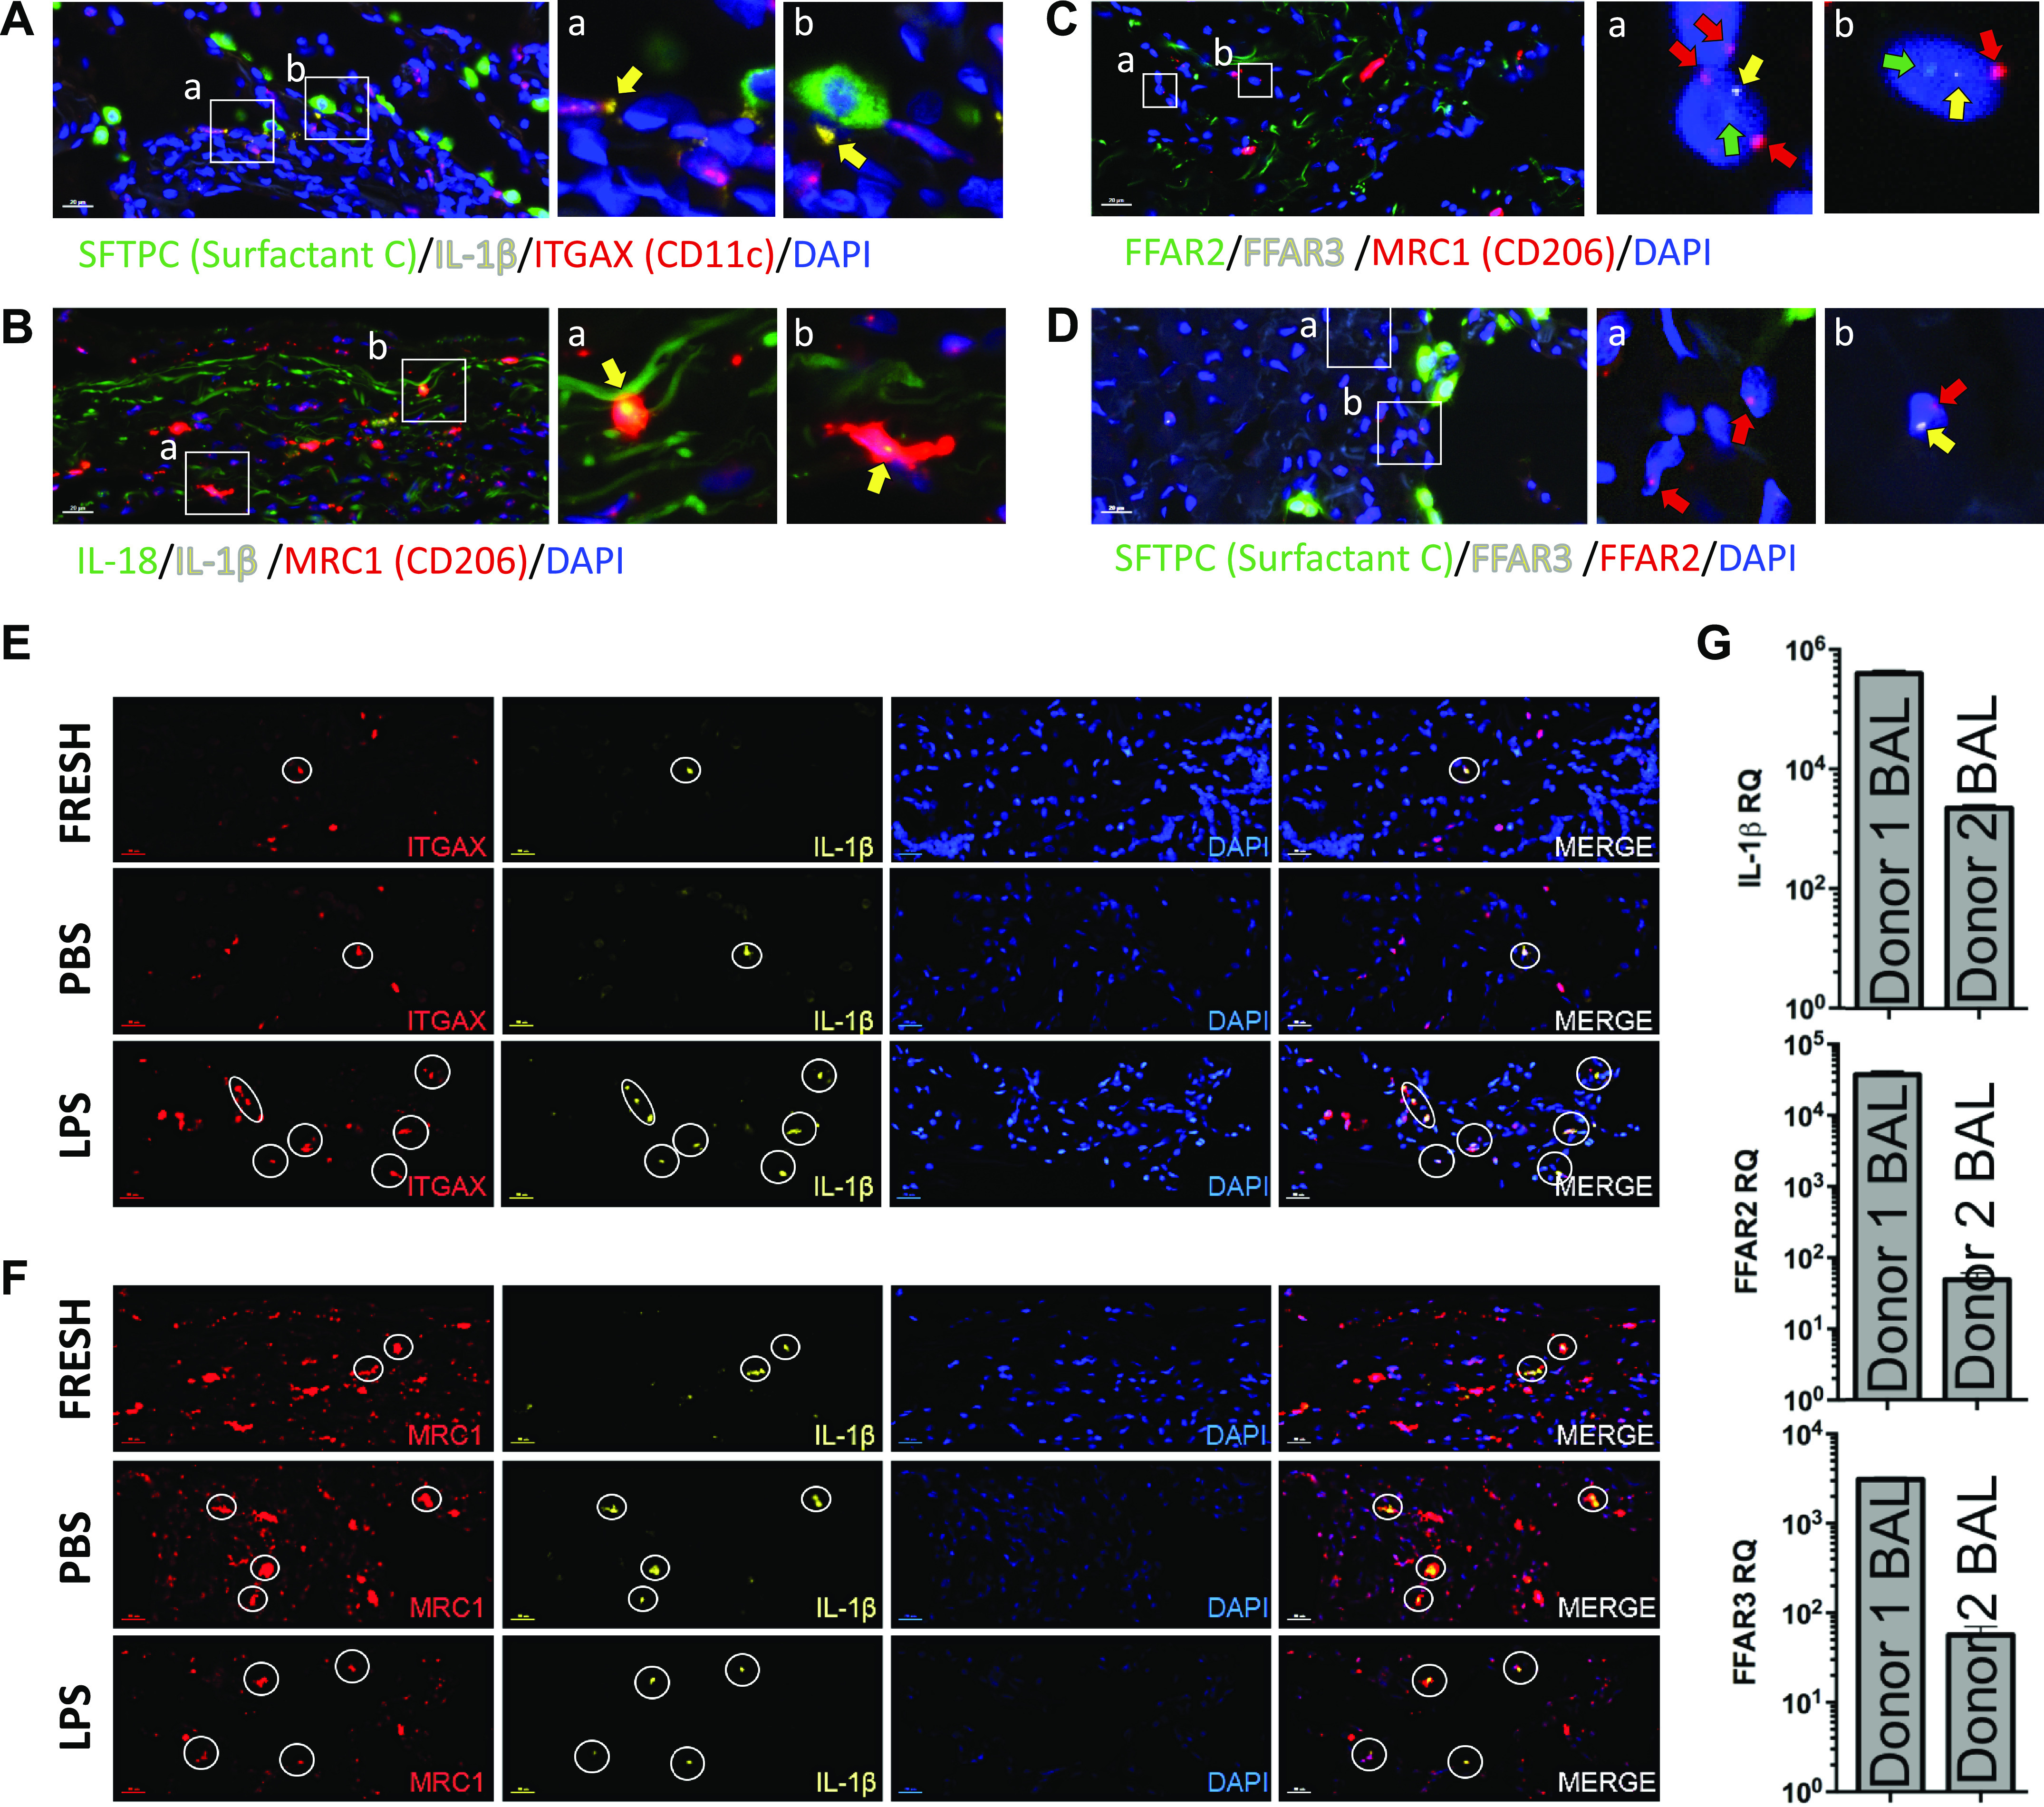
Microbial metabolites produced by the gut microbiome, e.g. short-chain fatty acids (SCFA), have been found to influence lung physiology and injury responses. However, how lung immune activity is regulated by SCFA is unknown. We examined fresh human lung tissue and observed the presence of SCFA with interindividual variability. In vitro, SCFA were capable of modifying the metabolic programming in LPS-exposed alveolar macrophages (AM). We hypothesized that lung immune tone could be defined by baseline detection of lung intracellular IL-1β. Therefore, we interrogated naïve mouse lungs with intact gut microbiota for IL-1β mRNA expression and localized its presence within alveolar spaces, specifically within AM subsets. We established that metabolically active gut microbiota, which produce SCFA, can transmit LPS and SCFA to the lung and thereby could create primed lung immunometabolic tone. To understand how murine lung cells sensed and upregulated IL-1β in response to gut microbiome-derived factors, we determined that, in vitro, AM and alveolar type II (AT2) cells expressed SCFA receptors, free fatty acid receptor 2 (FFAR2), free fatty acid receptor 3 (FFAR3), and IL-1β but with distinct expression patterns and different responses to LPS. Finally, we observed that IL-1β, FFAR2, and FFAR3 were expressed in isolated human AM and AT2 cells ex vivo, but in fresh human lung sections in situ, only AM expressed IL-1β at rest and after LPS challenge. Together, this translational study using mouse and human lung tissue and cells point to an important role for the gut microbiome and their SCFA in establishing and regulating lung immune tone.

Keywords: SCFA; gut microbiome; gut-lung axis; lung immune tone; lung injury.


Conflict of interest statement

No conflicts of interest, financial or otherwise, are declared by the authors.

Figures

Figure 1.
Figure 1.
SCFA levels in human lung tissue vary from patient to patient. A: relative levels of measured SCFA from human lung tissue (n = 5 patients) obtained from surgical resections (lung lobectomies) for isolated tumor nodules. Tissue sections used for metabolomic analysis were the furthest sections away from the tumor nodules so as to be representative of patients’ steady state lung metabolome. B: absolute concentrations of all measured SCFA in each of the lung sections (left) and focusing only on C2–4 SCFA (right). C: data presented as a percentage of total SCFA (all SCFA, left; only C2–4, right). SCFA (C2–4) are highlighted in red. C2, acetate; C3, propionate; C4, butyrate; C5, valerate; C6, hexanoate; C7, heptanoate; C8, octanoate; iC5, isovalerate; SCFA, short-chain fatty acid.
Figure 2.
Figure 2.
SCFA and LPS levels in mouse lung tissue depend on the presence of metabolically active gut microbiota. A: profiling of SCFA from germ-free (GF) and SPF mice (n = 2 littermates, and three independent colon/stool and lung tissue samples/mouse). C2–4 are highlighted in red. B: endotoxin (LPS) levels measured in stool and lungs from three of each of the following mice: SPF, GF, and GF mice colonized with WT gram-negative B. theta (∼109 CFU). C: relative levels of SCFA were profiled from lung tissue from GF mice (5 mice each) 2 wk after mono-colonization with either WT B. theta (GF + B. theta) or a mutant B. theta deficient in propionate-production (GF + B. theta del propionate; ∼109 CFU) (left). C3 is highlighted in red. Measured absolute levels of only C2–4 (acetate, propionate, and butyrate) are shown (right top) with a focus on C3 levels (right bottom). *P < 0.5, **P < 0.01. CFU, colony-forming unit; C2, acetate; C3, propionate; C4, butyrate; C5, valerate; C6, hexanoate; C7, heptanoate; iC5, isovalerate; iC6, isocaproic; iC7, isoheptanoate; iC8, isooctanoate; SCFA, short-chain fatty acid; SPF, specific pathogen free.
Figure 3.
Figure 3.
Propionate can metabolically reprogram LPS-exposed AM in a dose dependent manner. A: control MH-S cells (AM cell line) or after challenged with LPS (10 ng/mL) with or without 0.1 mM propionate (C3) or 5 mM propionate were assessed for oxygen consumption rate (OCR, top) and extracellular acidification rage (ECAR, bottom) using the Seahorse XFe24 analyzer platform. Top and bottom left panels compare control conditions (orange) against LPS (10 ng/mL) treatment (blue). Top and bottom middle panels compare LPS treatment (blue) against LPS + 0.1 mM propionate (green) and LPS + 5 mM propionate (purple). Top and bottom right sided panels represent reference schematic for metabolic measurements. B: metabolic stress tests were run to measure maximal levels of mitochondrial respiration and glycolysis and basal and stressed states plotted as shown within the four denoted quadrants: quiescent, glycolytic, aerobic, and energetic. Circular symbols represent the basal metabolic state, and square symbols represent the metabolic stressed state. Experiment was repeated twice and representative data shown. AM, alveolar macrophages; MH-S, wild-type BALB/c alveolar macrophage; Prop, propionate; OM, oligomycin; FCCP, carbonyl cyanide-4 (trifluoromethoxy) phenylhydrazone; Rot, rotenone; AA, antimycin.
Figure 4.
Figure 4.
Basal IL-1β levels detected in naïve mouse AM subsets and in same AM subsets after LPS challenge. Lungs from naïve WT C3H mice (left) or WT C3H mice after LPS in vivo challenge (10 mg/kg IV for 1 h, right) were harvested, fixed, and stained using specific mouse RNAscope probes for IL-1β in combination with (A) CD11c (AM and dendritic cells), (B) CD45 (hematopoietic cells), (C) surfactant C (SurfC; AT2 cells), and (D) IL-18. Dashed lines represent approximate estimations of cellular outlines of positively staining cells. Three naïve and three LPS challenged lungs were probed and representative images are shown. AM, alveolar macrophages; AT2, alveolar type II; CD11c, AM and dendritic cells; CD45, hematopoietic cells; WT, wild-type.
Figure 5.
Figure 5.
In vitro mouse AM and AT2 cells express IL-1β, FFAR2, and FFAR3 but with differential expression patterns at baseline and after LPS challenge. A: MLE 12 (epithelial AT2), MH-S (WT AM), and EOMA (EC) cell lines were treated with 10 ng/mL or 100 ng/mL LPS for 24 h and concentration of IL-6 in cell culture supernatant were measured by ELISA. B: in separate experiments, total RNA was extracted from these three cell types and basal expression of IL-1β, FFAR2, and FFAR3 was measured by RT-qPCR. C: similar to B, the three cell types were challenged with 10 ng/mL or 100 ng/mL LPS for 24 h and IL-1β, FFAR2, FFAR3, IL-6, CXCL-1, and CXCL-2 mRNA levels were measured by RT-qPCR. Experiments were repeated at least thrice and representative data shown. *P < 0.5, **P < 0.01, ***P < 0.001. AM, alveolar macrophages; AT2, alveolar type II; CXCL, chemokine (C-X-C motif) ligand; EC, endothelial cell; FFAR, free fatty acid receptors; RQ, relative quantification.
Figure 6.
Figure 6.
A: human AM express IL-1β, FFAR2, and FFAR3. Freshly isolated AM (from BAL performed on human donor lungs) were assayed without further manipulation (fresh, gray dots) or cultured for 24 h under control conditions (white), 10 ng/mL LPS (grey), or 100 ng/mL LPS (black). Total RNA was isolated and assayed for levels of IL-1β (top), FFAR2 (middle), and FFAR3 (bottom) by RT-qPCR. B: freshly isolated (from different human donor lungs) AT2 cells (fresh AT2), BAL AM (fresh AM), and commercially obtained primary human pulmonary microvascular endothelial cells—male or female (female or male lung EC) or primary human umbilical vein endothelial cells (HUVEC) were assayed for expression of IL-1β, FFAR2, and FFAR3 by RT-qPCR. C: human BAL AM (either freshly isolated or after 24 h in culture, from the same donor lung), and AT2 (either freshly isolated or after 24 h in culture, from the same donor lung), female and male lung EC, and HUVEC were assayed for IL-1β (Hu IL-1β), IL-6 (Hu IL-6), and TLR-4 (Hu TLR4) expression by RT-qPCR. Experiments were repeated at least thrice and representative data shown. *P < 0.5, **P < 0.01, ***P < 0.001. AM, alveolar macrophages; AT2, alveolar type II; BAL, bronchoalveolar lavage; EC, endothelial cell; FFAR, free fatty acid receptors; Hu, human; RQ, relative quantification; TLR4, toll like receptor 4.
Figure 7.
Figure 7.
Human IL-1β, FFAR2, and FFAR3 are expressed in AM in vivo and lung immune tone can vary greatly between individuals. AD: freshly obtained human lung tissue was fixed in formalin immediately after surgical excision and then later probed with fluorescent probes for DAPI (blue) and combinations of (A) surfactant C (AT2 cells, green), IL-1β (yellow), and ITGAX/CD11c (AM and dendritic cells, red); or (B) IL-18 (green), IL-1β (yellow), and CD206/MRC1 (macrophages, red); or (C) FFAR2 (green), FFAR3 (yellow), MRC1/CD206 (macrophages, red); or (D) SFTPC (Surfactant C, green), FFAR2 (yellow), and FFAR3 (red). E and F: human tissue from the same patient was simultaneously either formalin fixed immediately (FRESH, as in AD) or first incubated with PBS or LPS for 2 h prior to fixation and then stained/probed with fluorescent probes for DAPI (blue) and (E) ITGAX/CD11c (red channel) and IL-1β (yellow channel) or (F) MRC1/CD206 (red channel) and IL-1β (yellow channel). G: human IL-1β, FFAR2, and FFAR3 mRNA relative expression were determined by RT-qPCR in freshly isolated BAL alveolar macrophages (AM) from two different human donor lungs. AM, alveolar macrophages; AT2, alveolar type II; BAL, bronchoalveolar lavage; FFAR, free fatty acid receptors.

References

    1. Dickson RP, Huffnagle GB. The lung microbiome: new principles for respiratory bacteriology in health and disease. PLoS Pathog 11: e1004923, 2015. doi: 10.1371/journal.ppat.1004923. - DOI - PMC - PubMed
    1. Gollwitzer ES, Marsland BJ. Microbiota abnormalities in inflammatory airway diseases - potential for therapy. Pharmacol Ther 141: 32–39, 2014. doi: 10.1016/j.pharmthera.2013.08.002. - DOI - PubMed
    1. Korpela K, Salonen A, Virta LJ, Kekkonen RA, Forslund K, Bork P, De Vos WM. Intestinal microbiome is related to lifetime antibiotic use in Finnish pre-school children. Nat Commun 7: 1–8, 2016. doi: 10.1038/ncomms10410. - DOI - PMC - PubMed
    1. Man WH, De Steenhuijsen Piters WAA, Bogaert D. The microbiota of the respiratory tract: gatekeeper to respiratory health. Nat Rev Microbiol 15: 259–270, 2017. doi: 10.1038/nrmicro.2017.14. - DOI - PMC - PubMed
    1. Sender R, Fuchs S, Milo R. Revised estimates for the number of human and bacteria cells in the body. PLoS Biol 14: e1002533, 2016. doi: 10.1371/journal.pbio.1002533. - DOI - PMC - PubMed

Publication types