

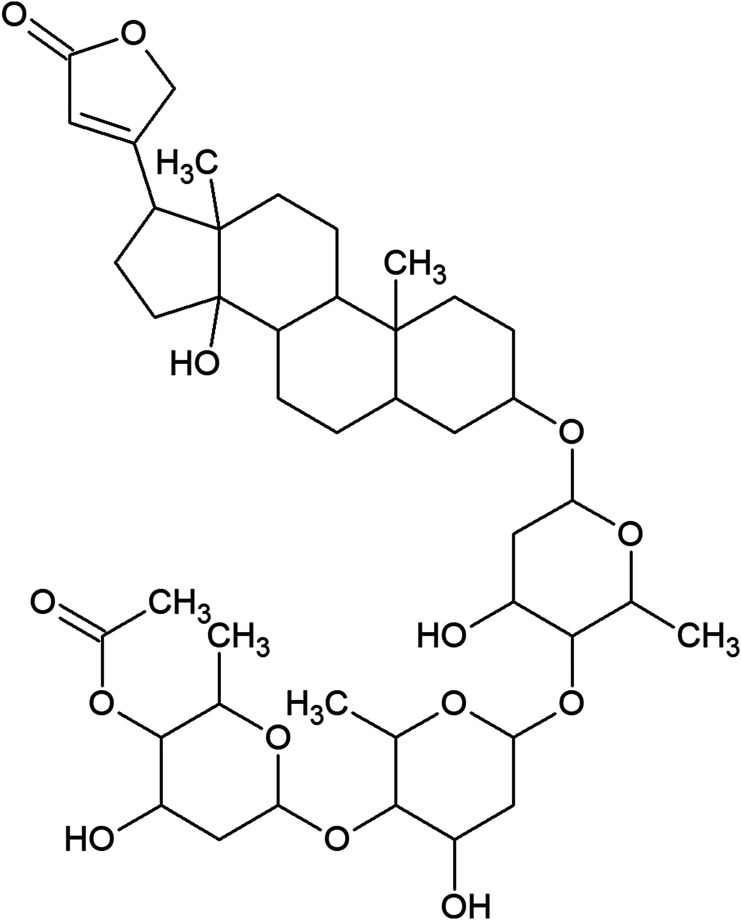
In vitro and in vivo antileishmanial activity of β-acetyl-digitoxin, a cardenolide of Digitalis lanata potentially useful to treat visceral leishmaniasis
- PMID: 33851916
- PMCID: PMC8045677
- DOI: 10.1051/parasite/2021036
In vitro and in vivo antileishmanial activity of β-acetyl-digitoxin, a cardenolide of Digitalis lanata potentially useful to treat visceral leishmaniasis
Abstract
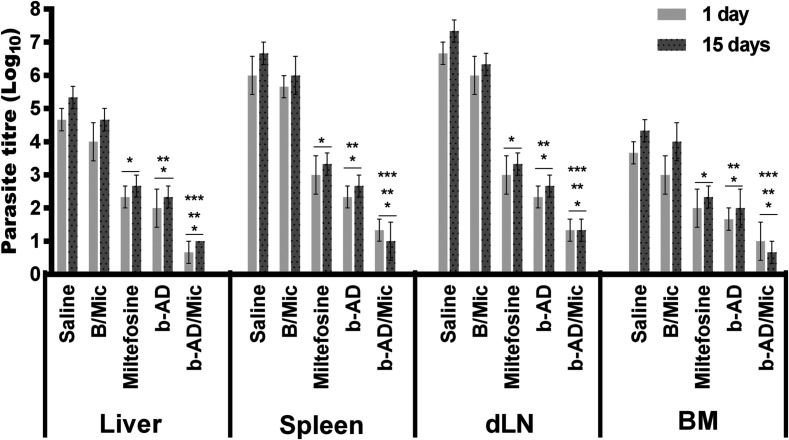
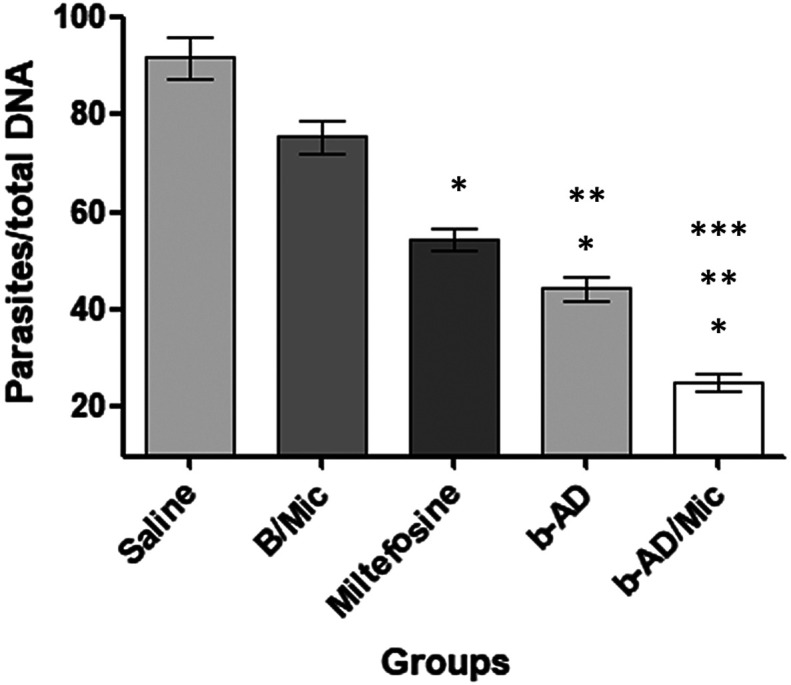
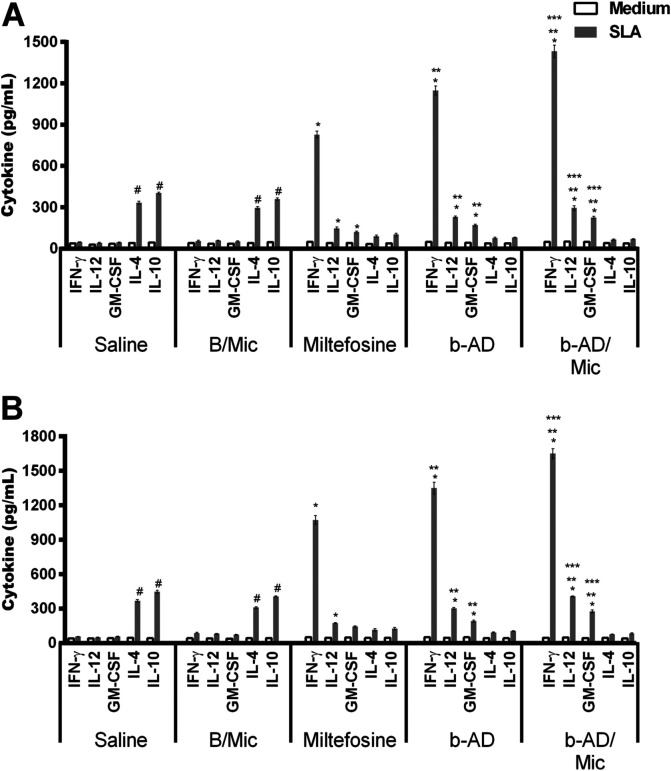
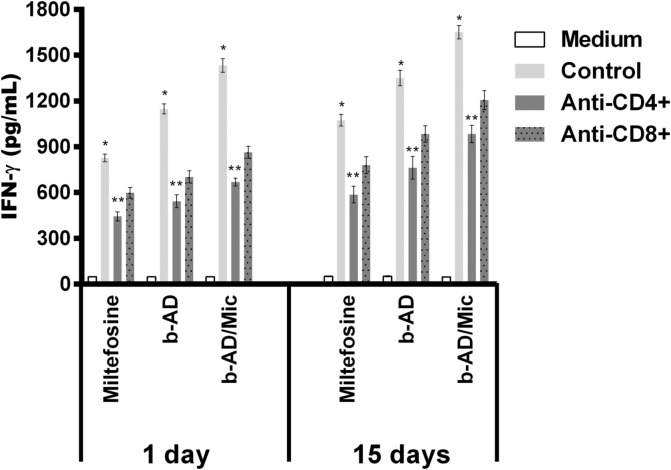
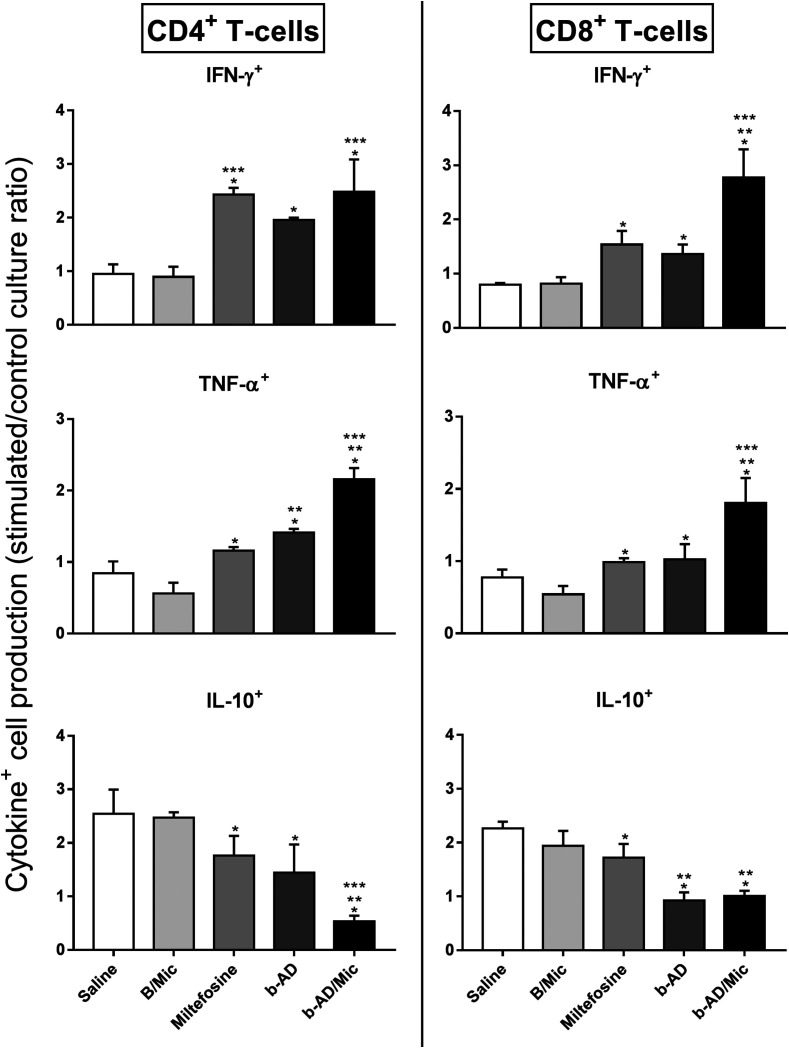
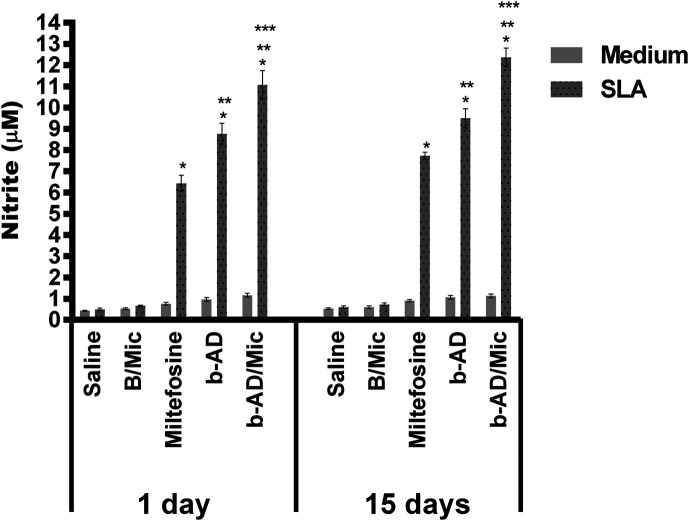
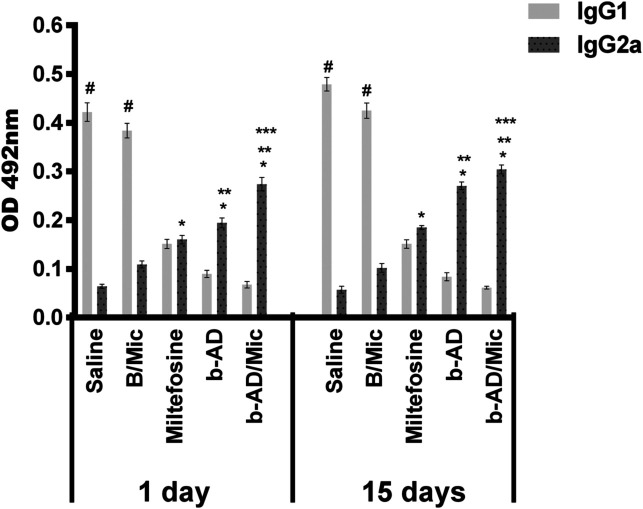
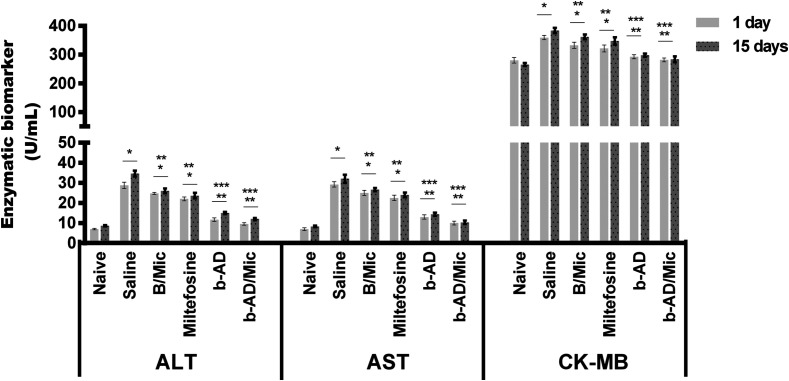
Current treatments of visceral leishmaniasis face limitations due to drug side effects and/or high cost, along with the emergence of parasite resistance. Novel and low-cost antileishmanial agents are therefore required. We report herein the antileishmanial activity of β-acetyl-digitoxin (b-AD), a cardenolide isolated from Digitalis lanata leaves, assayed in vitro and in vivo against Leishmania infantum. Results showed direct action of b-AD against parasites, as well as efficacy for the treatment of Leishmania-infected macrophages. In vivo experiments using b-AD-containing Pluronic® F127 polymeric micelles (b-AD/Mic) to treat L. infantum-infected mice showed that this composition reduced the parasite load in distinct organs in more significant levels. It also induced the development of anti-parasite Th1-type immunity, attested by high levels of IFN-γ, IL-12, TNF-α, GM-CSF, nitrite and specific IgG2a antibodies, in addition to low IL-4 and IL-10 contents, along with higher IFN-γ-producing CD4+ and CD8+ T-cell frequency. Furthermore, low toxicity was found in the organs of the treated animals. Comparing the therapeutic effect between the treatments, b-AD/Mic was the most effective in protecting animals against infection, when compared to the other groups including miltefosine used as a drug control. Data found 15 days after treatment were similar to those obtained one day post-therapy. In conclusion, the results obtained suggest that b-AD/Mic is a promising antileishmanial agent and deserves further studies to investigate its potential to treat visceral leishmaniasis.
Title: Activité antileishmaniale in vitro et in vivo de la β-acétyl-digitoxine, un cardénolide de Digitalis lanata potentiellement utile pour traiter la leishmaniose viscérale.
Abstract: Les traitements actuels de la leishmaniose viscérale font face à des limitations dues aux effets secondaires des médicaments et/ou à leur coût élevé, ainsi qu’à l’émergence d’une résistance parasitaire. Des agents antileishmaniaux nouveaux et peu coûteux sont donc nécessaires. Nous rapportons ici l’activité antileishmaniale de la β-acétyl-digitoxine (b-AD), un cardénolide isolé à partir de feuilles de Digitalis lanata, mesurée in vitro et in vivo contre Leishmania infantum. Les résultats ont montré une action directe de la b-AD contre les parasites, ainsi qu’une efficacité pour le traitement des macrophages infectés par Leishmania. Des expériences in vivo utilisant des micelles polymériques Pluronic® F127 contenant de la b-AD (b-AD/Mic) pour traiter des souris infectées par L. infantum ont montré que cette composition réduisait à des niveaux plus significatifs la charge parasitaire dans différents organes, ainsi que le développement d’une immunité antiparasitaire de type Th1, attestée par les taux élevés d’IFN-γ, d’IL-12, de TNF-α, de GM-CSF, de nitrite et d’anticorps IgG2a spécifiques, en plus des faibles taux d’IL-4 et IL-10, ainsi qu’une fréquence plus élevée des cellules T CD4+ and CD8+ productrices d’ IFN-γ. De plus, une faible toxicité a été trouvée dans les organes des animaux traités. En comparant l’effet thérapeutique des traitements, b-AD/Mic était le plus efficace pour protéger les animaux contre l’infection, par rapport aux autres groupes comprenant la miltefosine utilisée comme contrôle médicamenteux. Les données trouvées 15 jours après le traitement étaient similaires à celles obtenues un jour après le traitement. En conclusion, les résultats obtenus suggèrent que b-AD/Mic est un agent antileishmanial prometteur et mérite des études supplémentaires pour étudier son potentiel à traiter la leishmaniose viscérale.
Keywords: Drug repositioning; Miltefosine; Toxicity; Treatment; Visceral leishmaniasis; β-acetyl-digitoxin.
© C.S. Freitas et al., published by EDP Sciences, 2021.
Figures
References
-
- Akbari M, Oryan A, Hatam G. 2017. Application of nanotechnology in treatment of leishmaniasis: a review. Acta Tropica, 172, 86–90. - PubMed
-
- Alonso-Garrido M, Manyes L, Pralea IE, Iuga CA. 2020. Mitochondrial proteomics profile points oxidative phosphorylation as main target for beauvericin and enniatin B mixture. Food and Chemical Toxicology, 141, 111432. - PubMed
-
- Andrade-Neto VV, Cunha-Junior EF, Santos Faioes V, Pereira TM, Silva RL, Leon LL, Torres-Santos EC. 2018. Leishmaniasis treatment: update of possibilities for drug repurposing. Frontiers in Bioscience, 23, 967–996. - PubMed
MeSH terms
Substances
LinkOut - more resources
Full Text Sources
Other Literature Sources
Research Materials