

Can social vulnerability indices predict county trauma fatality rates?
- PMID: 33852559
- PMCID: PMC8375410
- DOI: 10.1097/TA.0000000000003228
Can social vulnerability indices predict county trauma fatality rates?
Abstract
Background: Social vulnerability indices were created to measure resiliency to environmental disasters based on socioeconomic and population characteristics of discrete geographic regions. They are composed of multiple validated constructs that can also potentially identify geographically vulnerable populations after injury. Our objective was to determine if these indices correlate with injury fatality rates in the US.
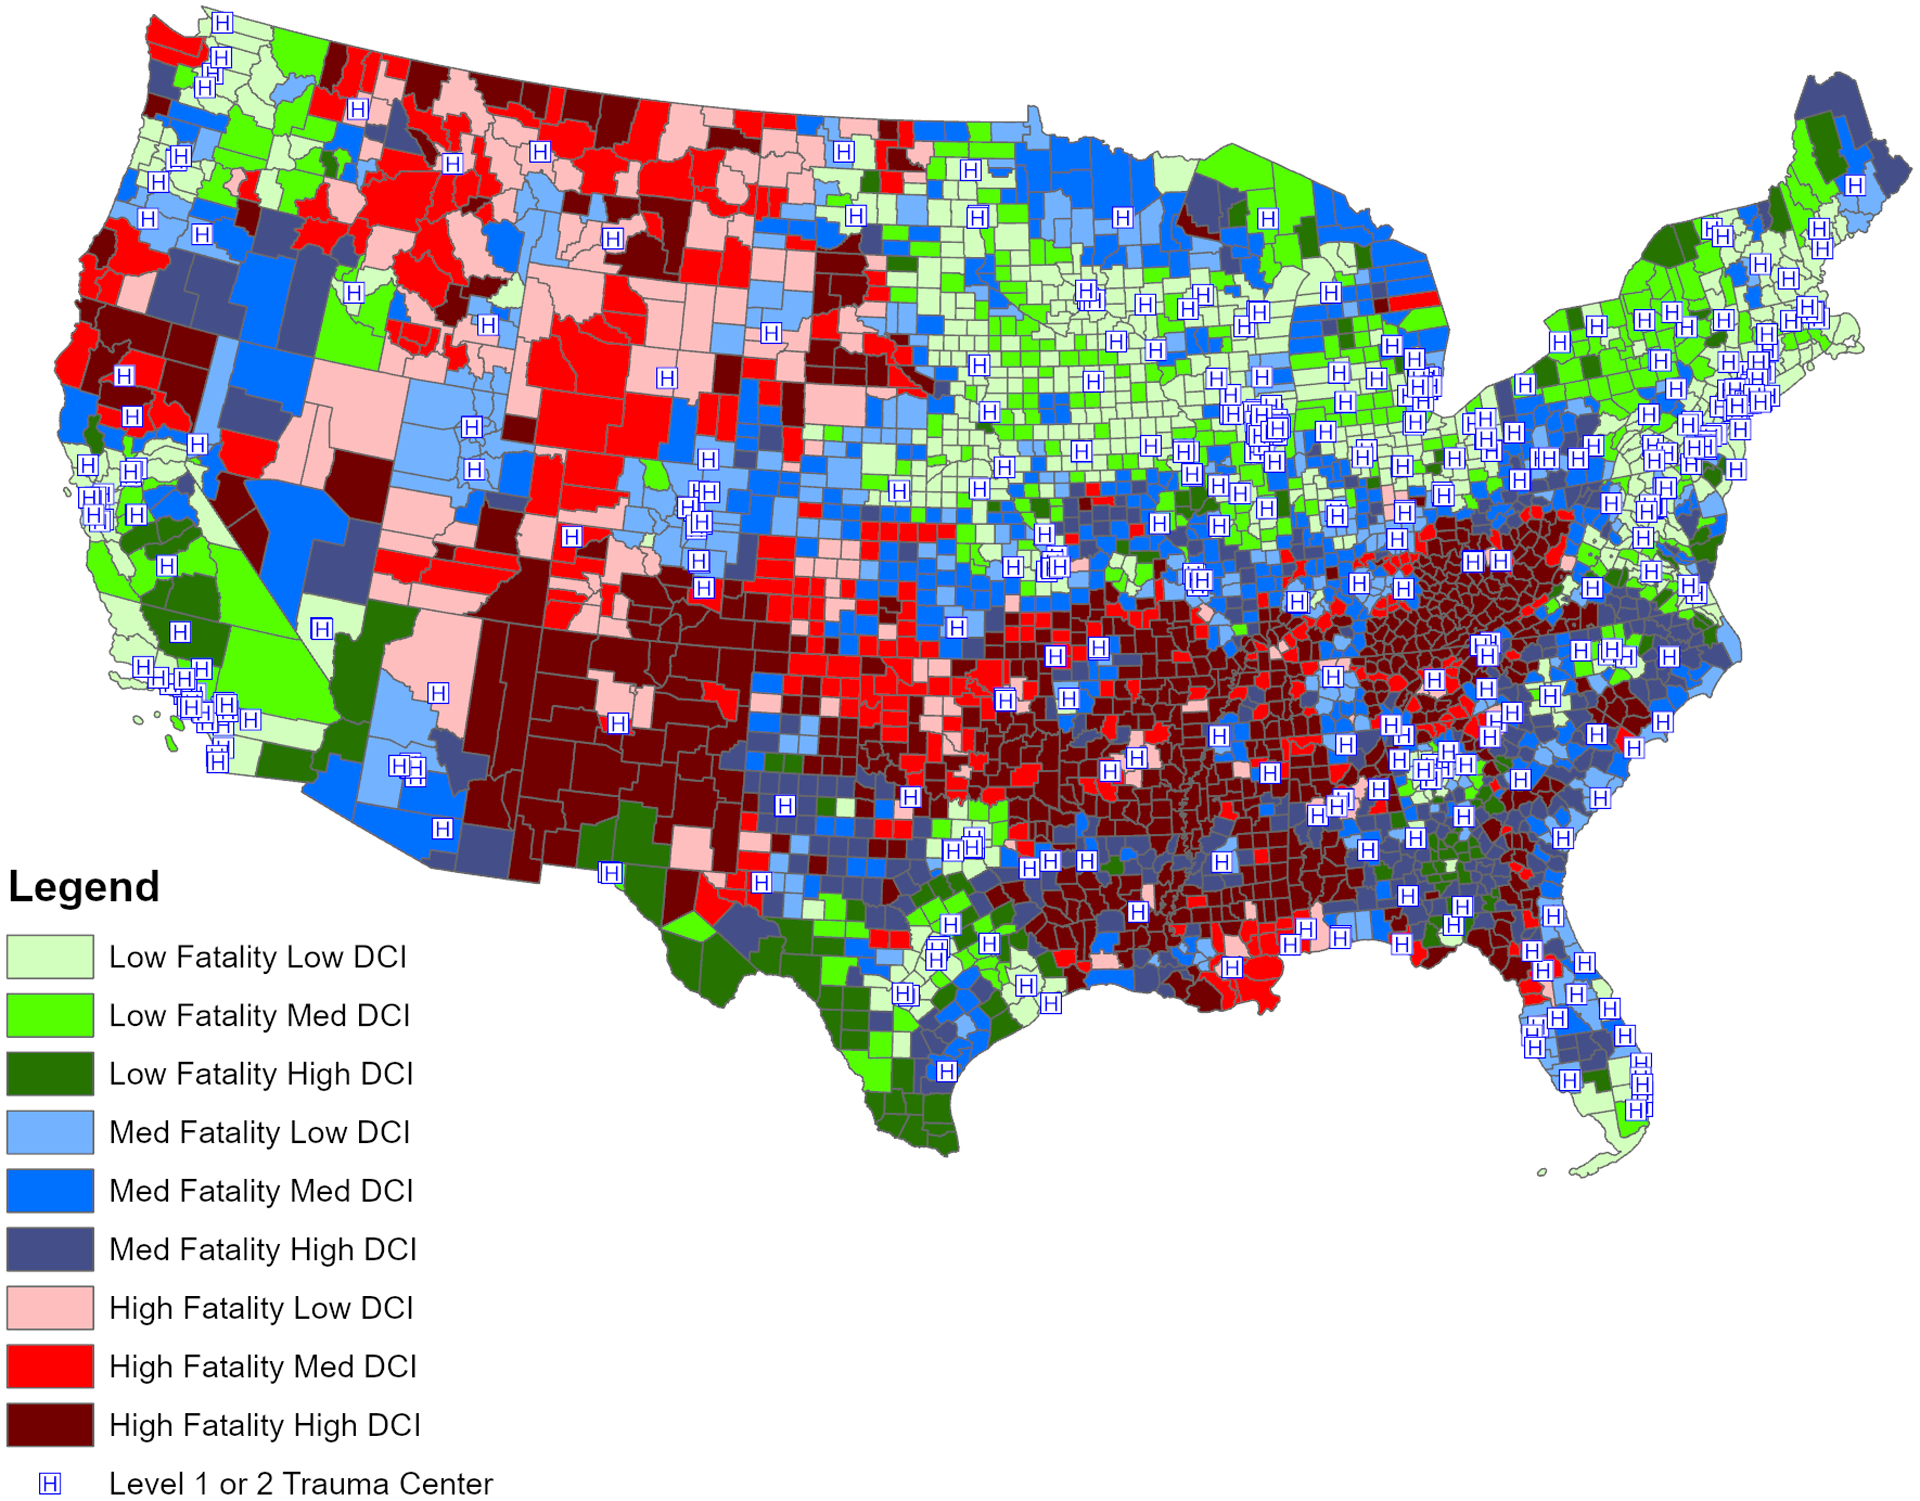
Methods: We evaluated three social vulnerability indices: The Hazards & Vulnerability Research Institute's Social Vulnerability Index (SoVI), the Center for Disease Control's Social Vulnerability Index (SVI), and the Economic Innovation Group's Distressed Community Index (DCI). We analyzed SVI subindices and common individual census variables as indicators of socioeconomic status. Outcomes included age-adjusted county-level overall, firearm, and motor vehicle collision deaths per 100,000 population. Linear regression determined the association of injury fatality rates with the SoVI, SVI, and DCI. Bivariate choropleth mapping identified geographic variation and spatial autocorrelation of overall fatality, SoVI, and DCI.
Results: A total of 3,137 US counties were included. Only 24.6% of counties fell into the same vulnerability quintile for all three indices. Despite this, all indices were associated with increasing fatality rates for overall, firearm, and motor vehicle collision fatality. The DCI performed best by model fit, explanation of variance, and diagnostic performance on overall injury fatality. There is significant geographic variation in SoVI, DCI, and injury fatality rates at the county level across the United States, with moderate spatial autocorrelation of SoVI (Moran's I, 0.35; p < 0.01) and high autocorrelation of injury fatality rates (Moran's I, 0.77; p < 0.01) and DCI (Moran's I, 0.53; p < 0.01).
Conclusion: While the indices contribute unique information, higher social vulnerability is associated with higher injury fatality across all indices. These indices may be useful in the epidemiologic and geographic assessment of injury-related fatality rates. Further study is warranted to determine if these indices outperform traditional measures of socioeconomic status and related constructs used in trauma research.
Level of evidence: Epidemiological, level IV.
Copyright © 2021 Wolters Kluwer Health, Inc. All rights reserved.
Conflict of interest statement
Conflicts of Interest:
The authors declare no funding or conflicts of interest.
Figures

References
MeSH terms
Grants and funding
LinkOut - more resources
Full Text Sources
Other Literature Sources
Medical
Research Materials
