. 2021 Apr 13;35(2):108990.
doi: 10.1016/j.celrep.2021.108990.

Stabilized epithelial phenotype of cancer cells in primary tumors leads to increased colonization of liver metastasis in pancreatic cancer

Affiliations

Stabilized epithelial phenotype of cancer cells in primary tumors leads to increased colonization of liver metastasis in pancreatic cancer

Julienne L Carstens et al. Cell Rep. .

Abstract

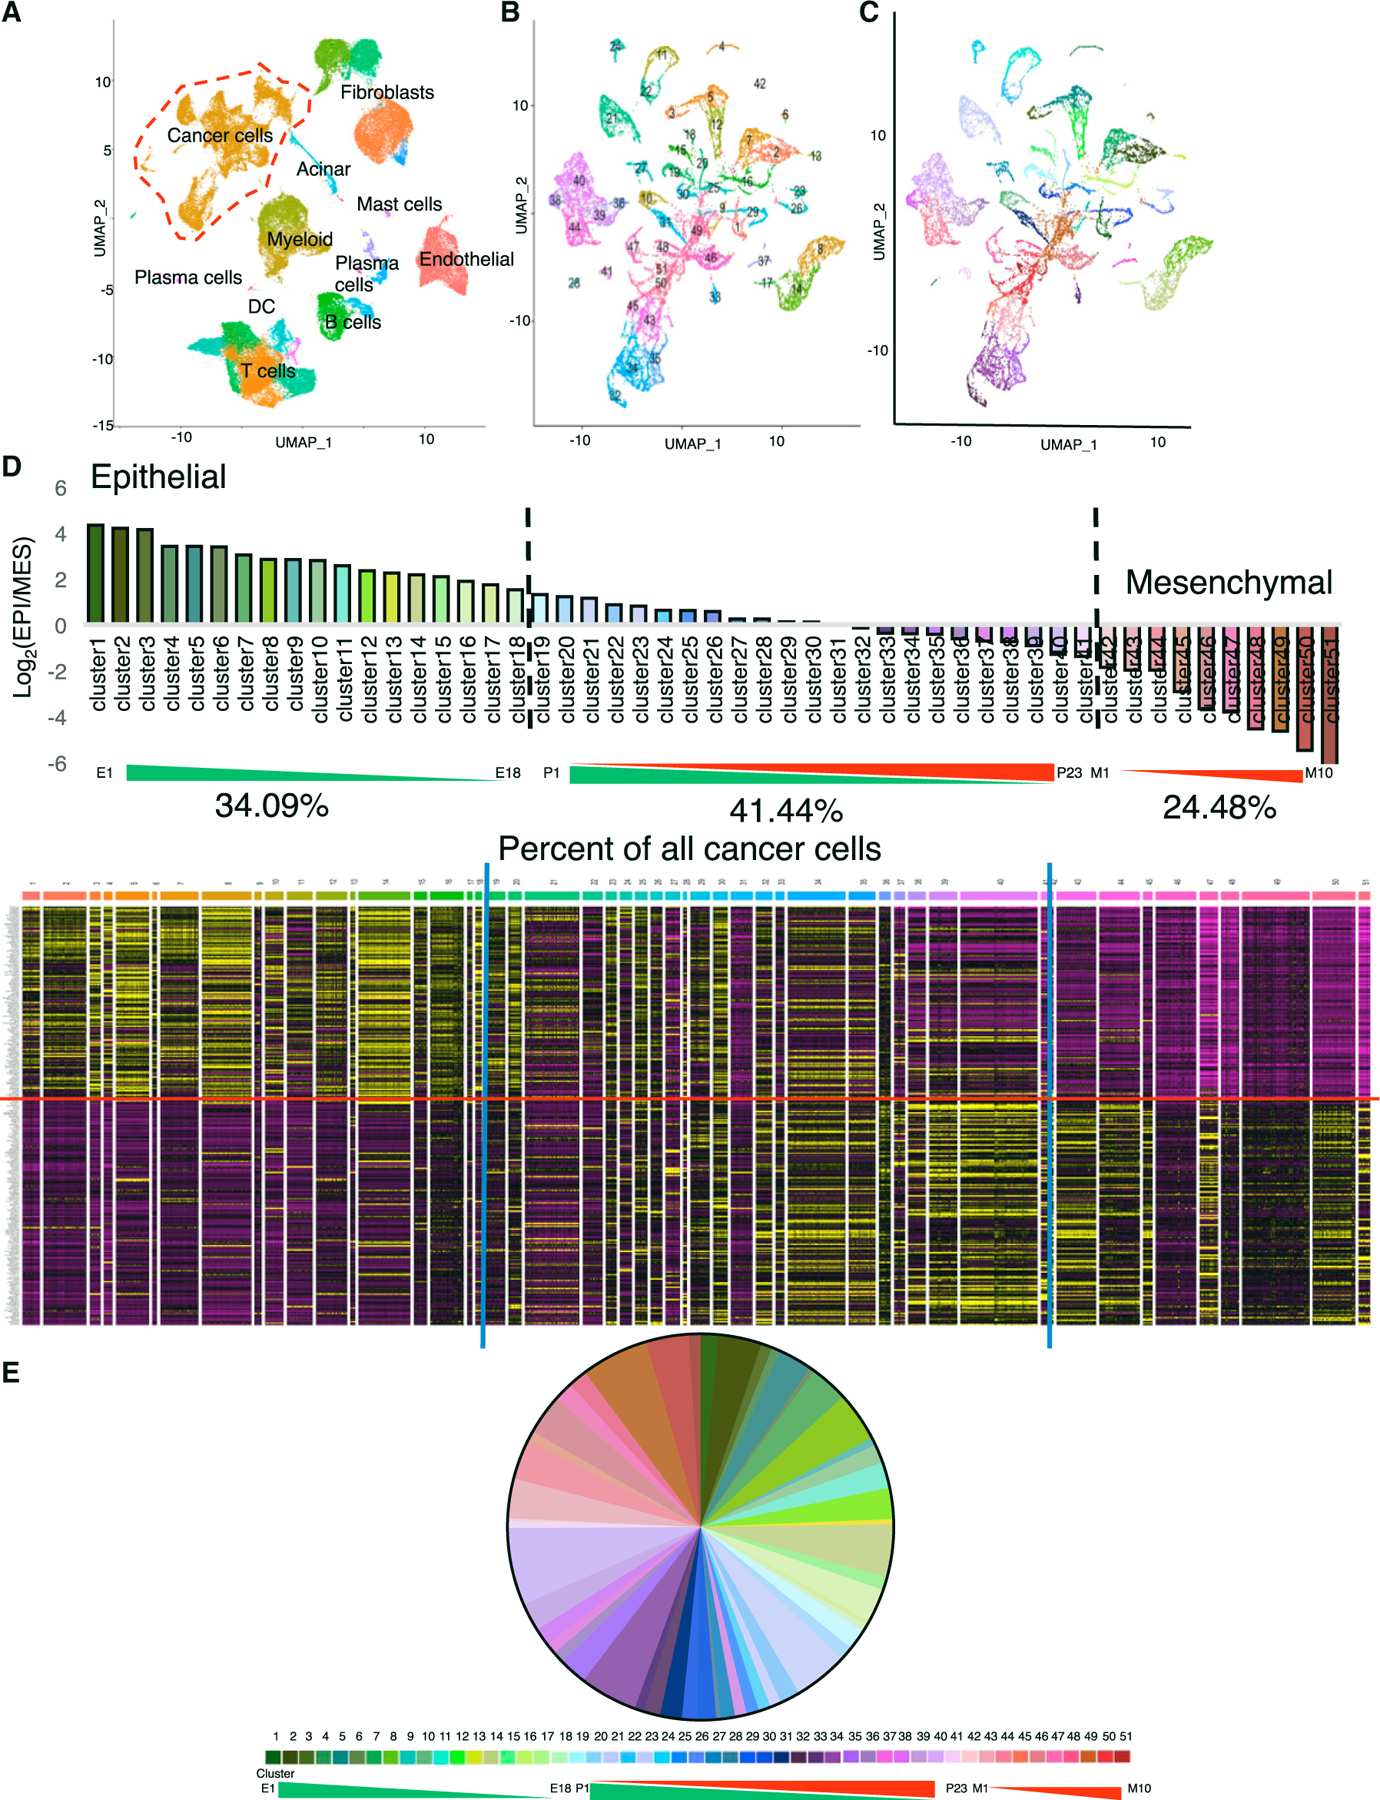
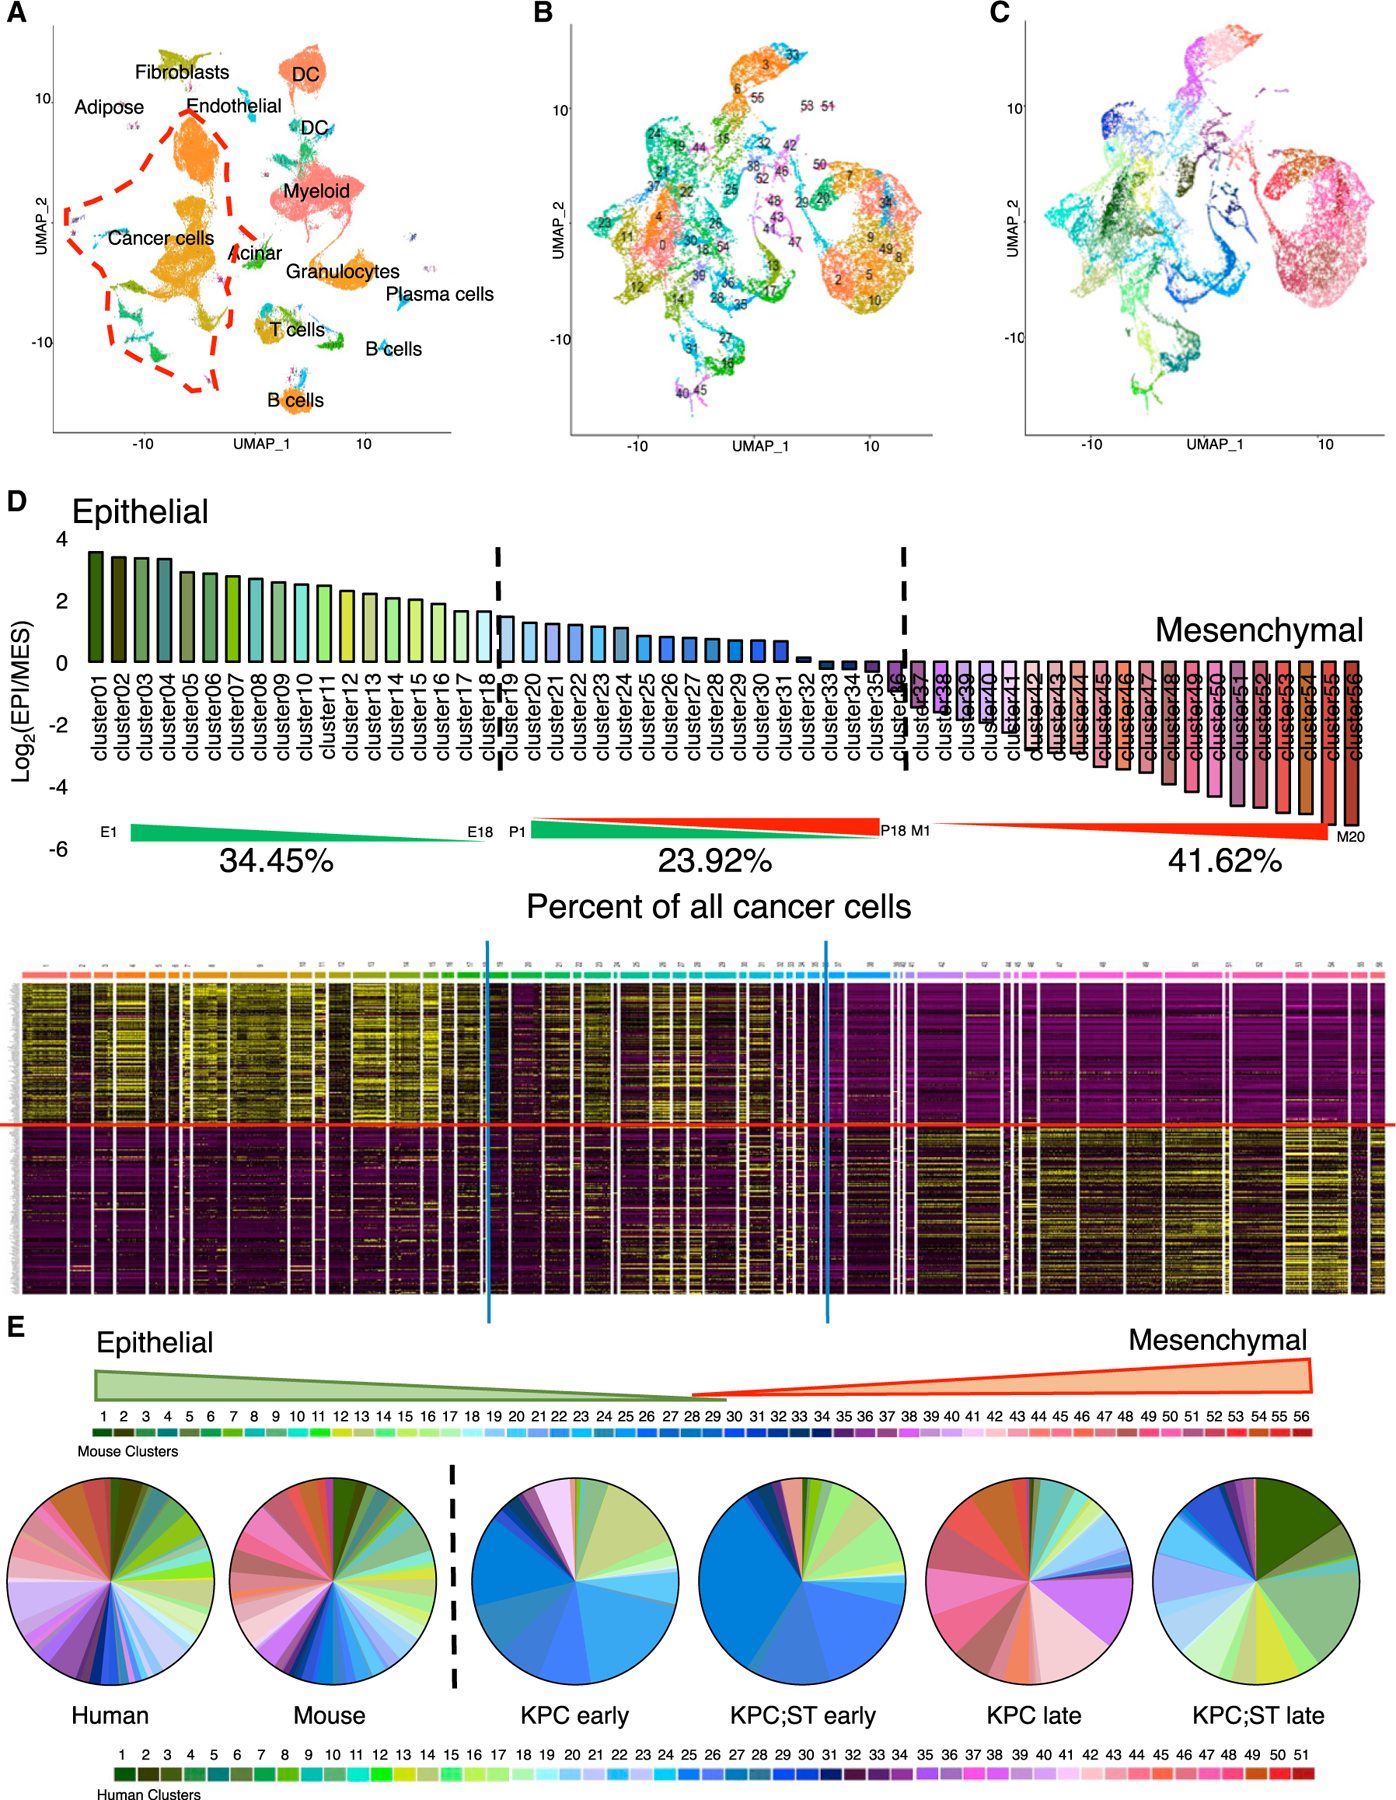
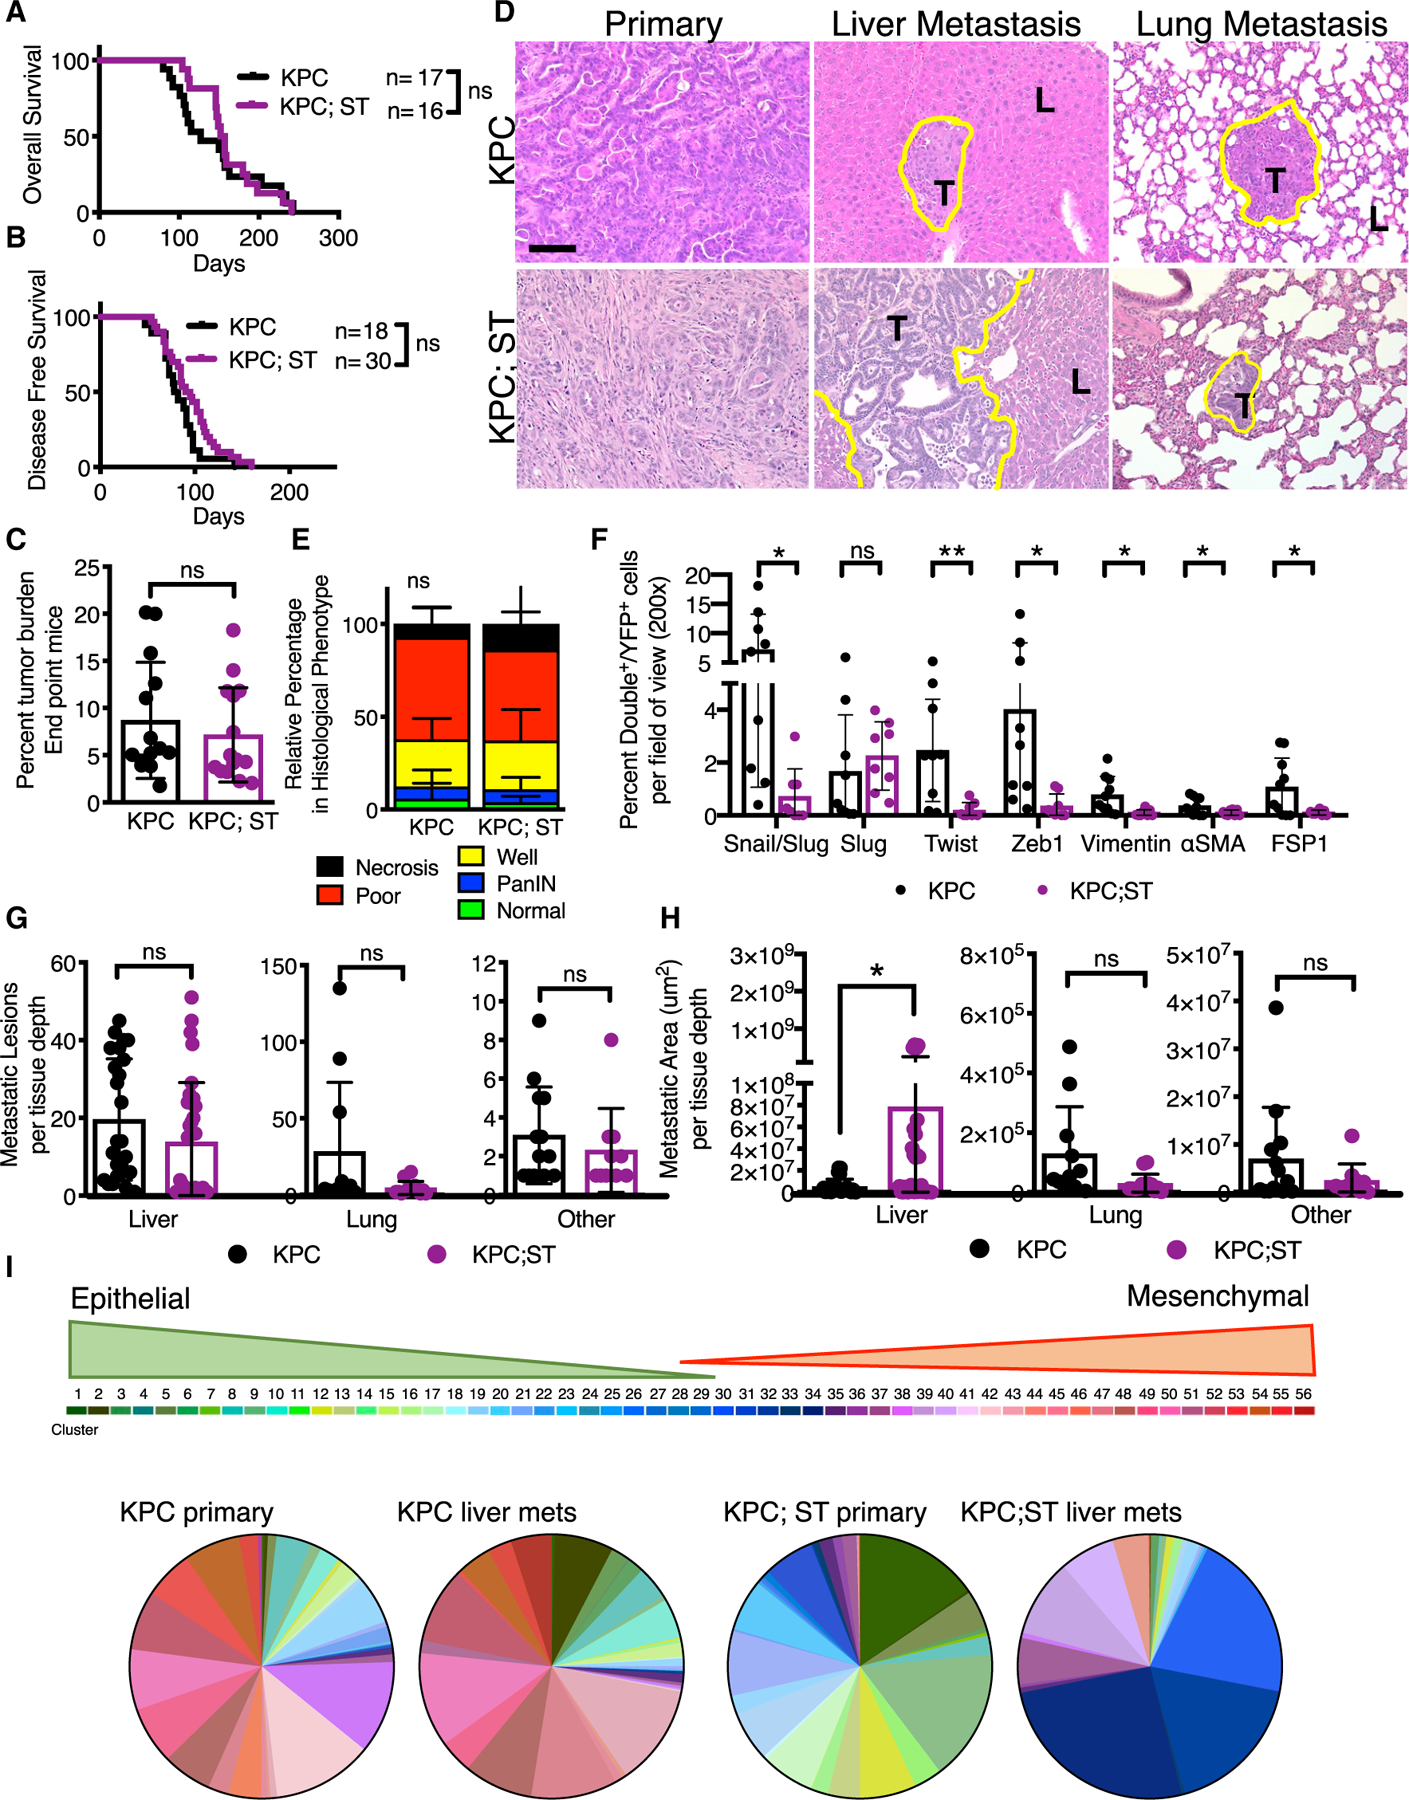
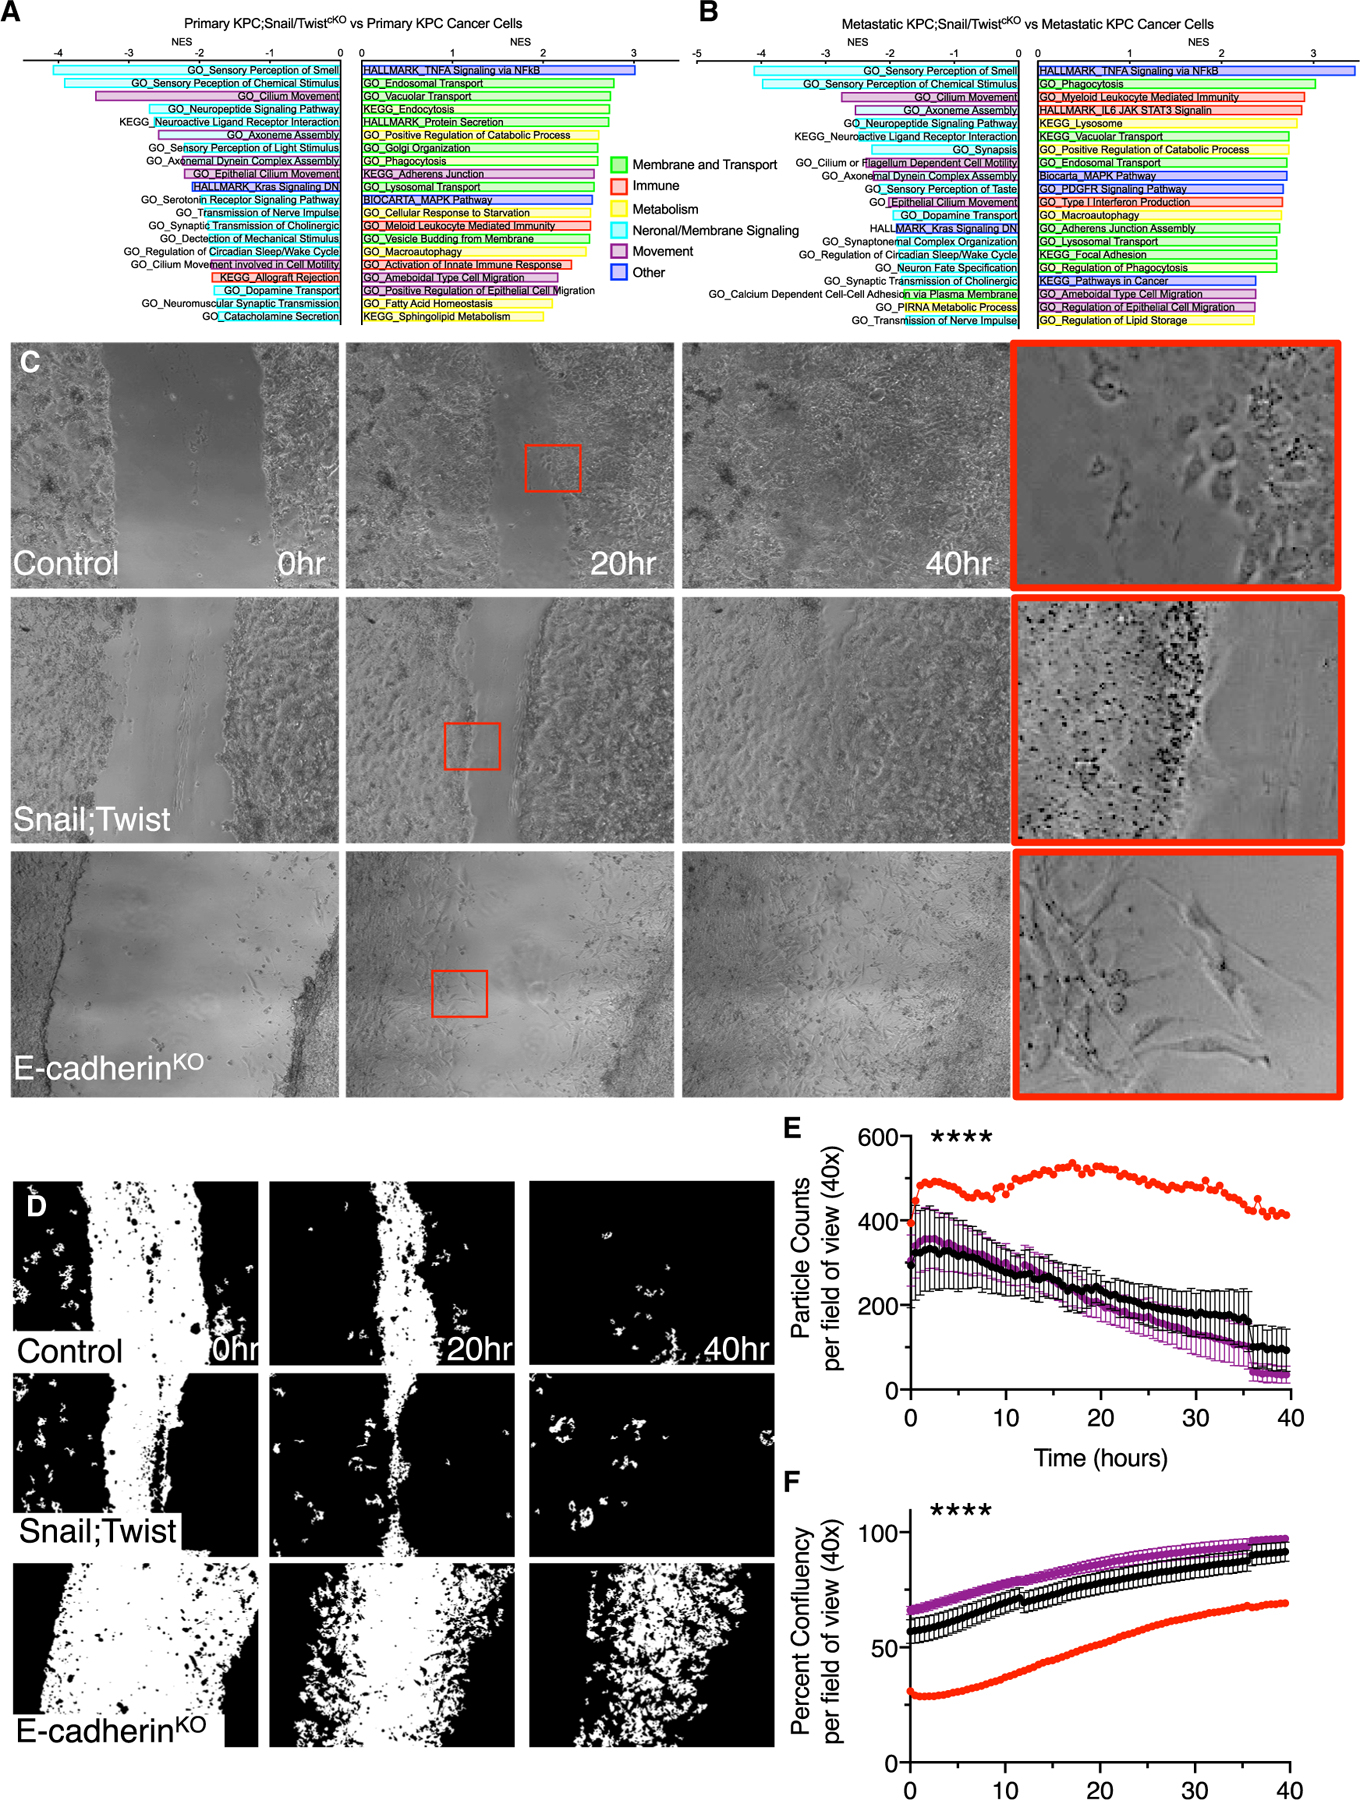
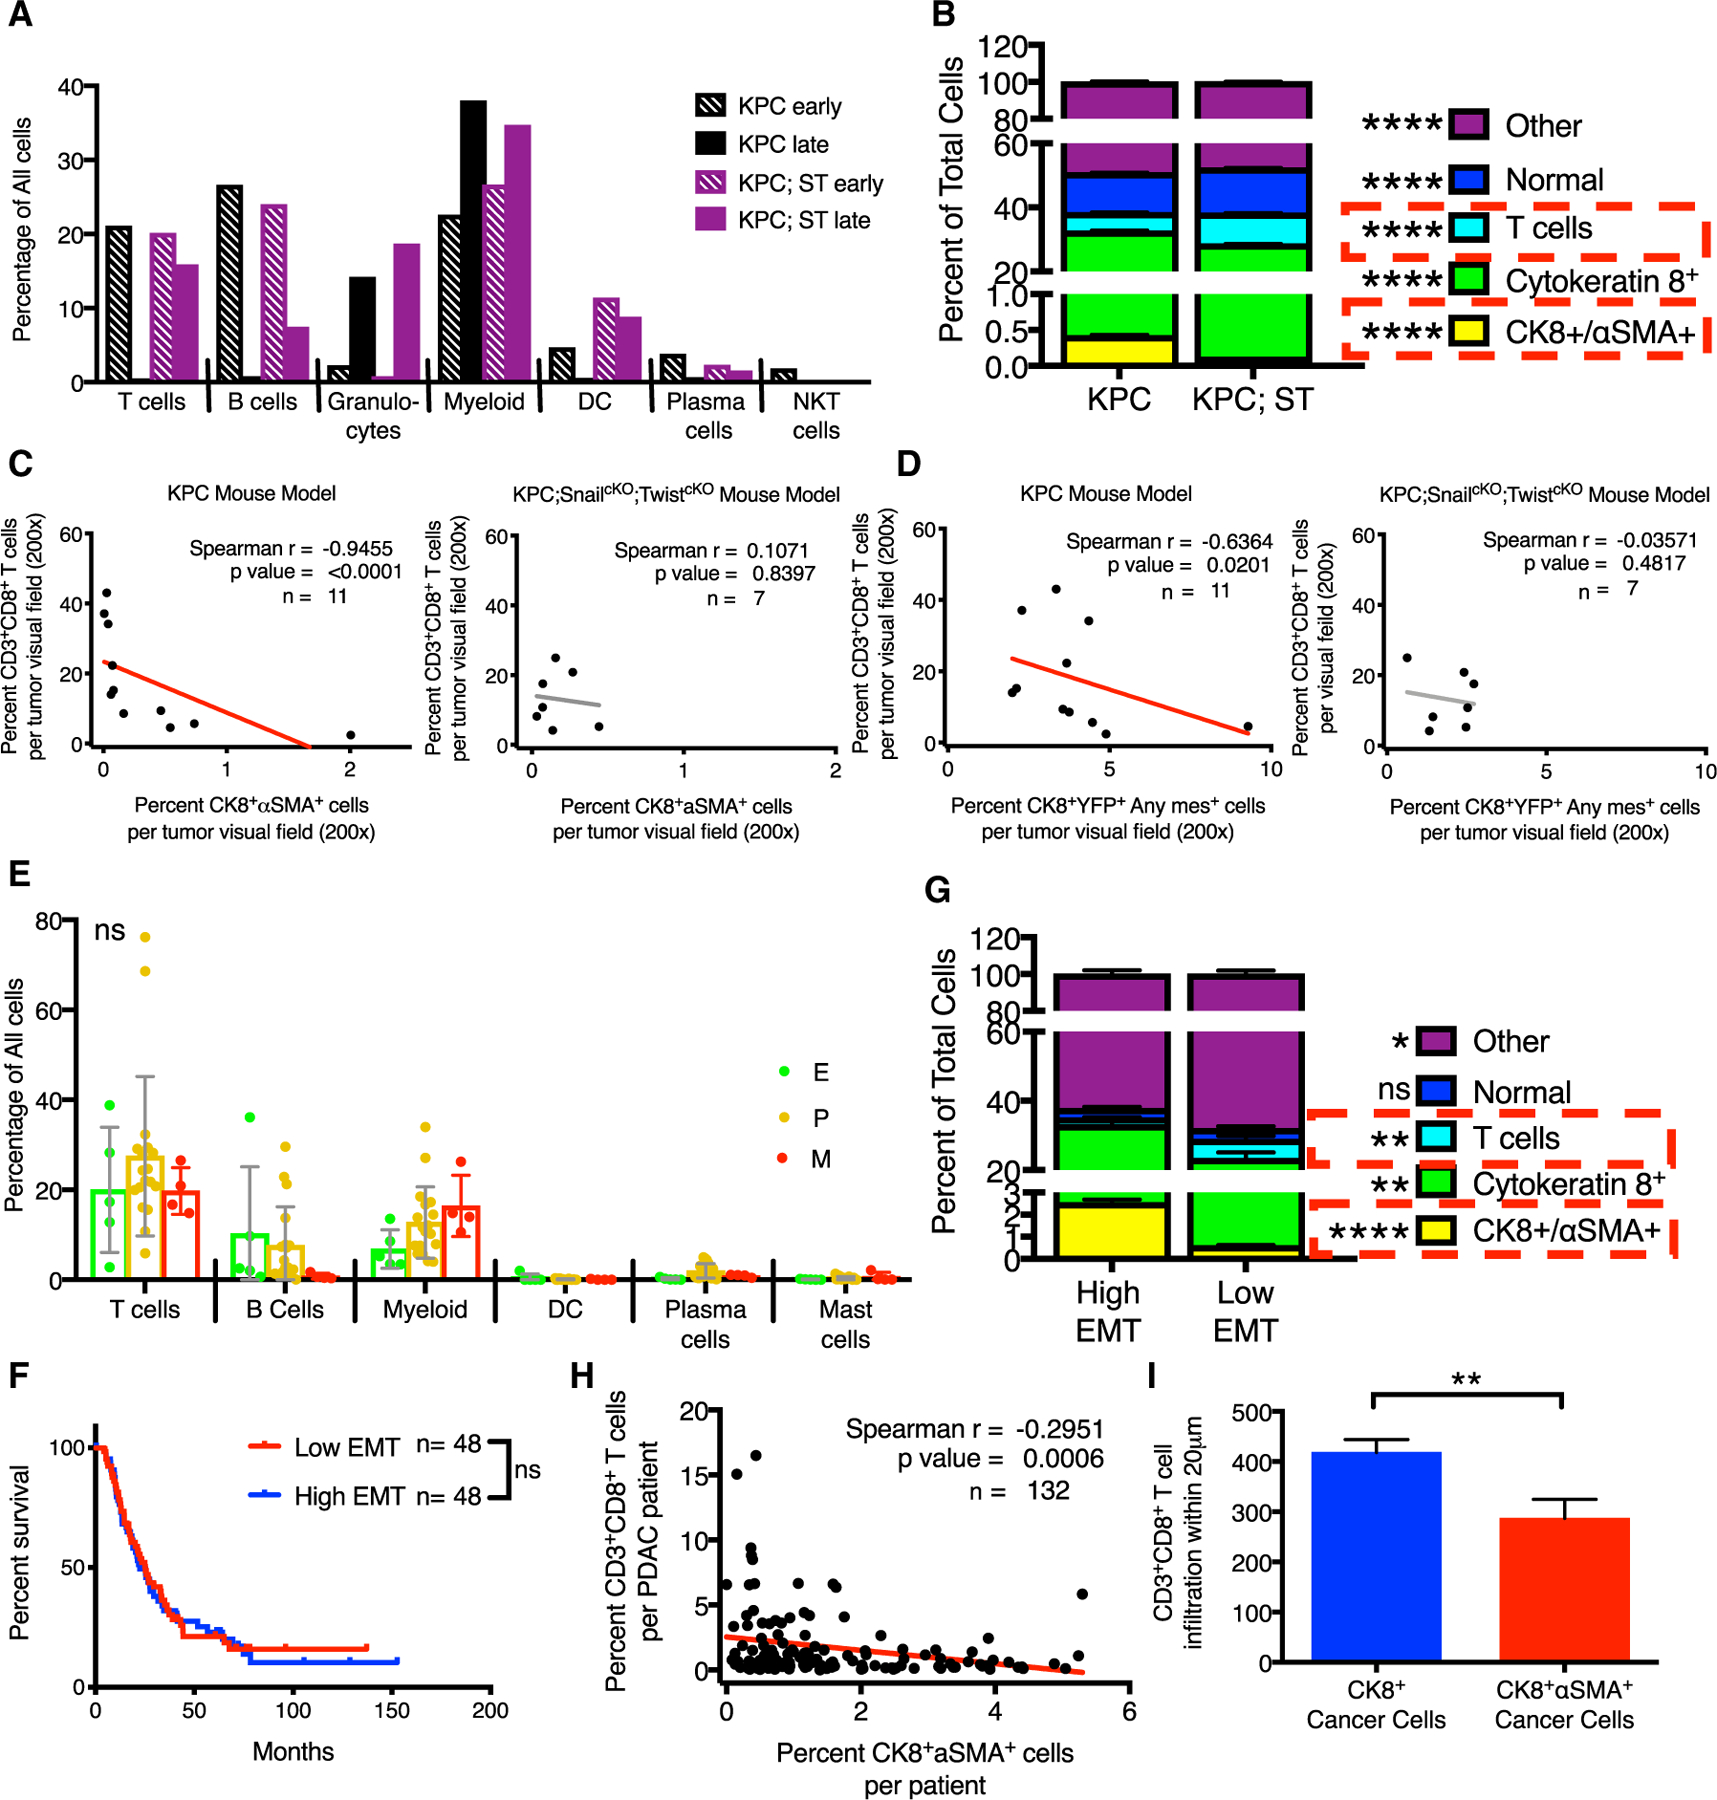
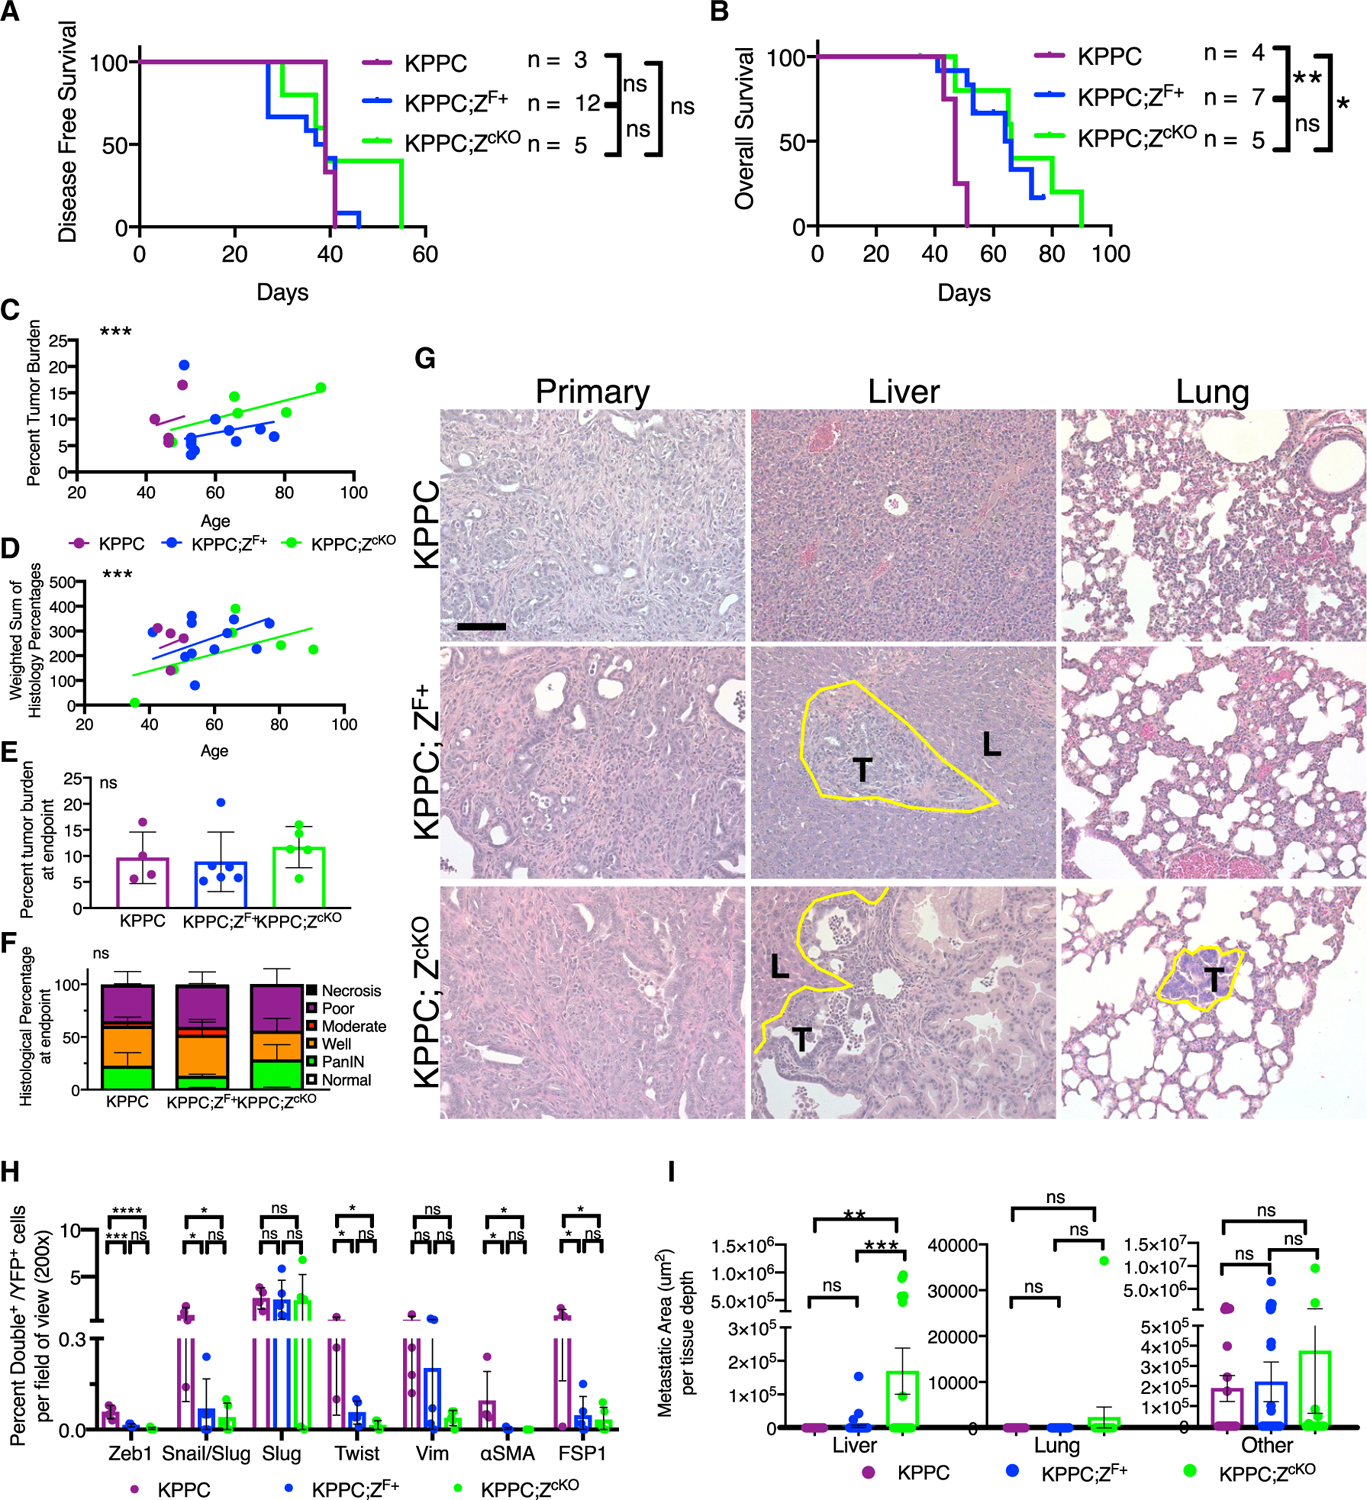
Pancreatic ductal adenocarcinoma (PDAC) is therapeutically recalcitrant and metastatic. Partial epithelial to mesenchymal transition (EMT) is associated with metastasis; however, a causal connection needs further unraveling. Here, we use single-cell RNA sequencing and genetic mouse models to identify the functional roles of partial EMT and epithelial stabilization in PDAC growth and metastasis. A global EMT expression signature identifies ∼50 cancer cell clusters spanning the epithelial-mesenchymal continuum in both human and murine PDACs. The combined genetic suppression of Snail and Twist results in PDAC epithelial stabilization and increased liver metastasis. Genetic deletion of Zeb1 in PDAC cells also leads to liver metastasis associated with cancer cell epithelial stabilization. We demonstrate that epithelial stabilization leads to the enhanced collective migration of cancer cells and modulation of the immune microenvironment, which likely contribute to efficient liver colonization. Our study provides insights into the diverse mechanisms of metastasis in pancreatic cancer and potential therapeutic targets.

Keywords: Snail; Twist; Zeb1; collective migration; epithelial-to-mesenchymal transition; immune modulation; metastasis; mouse models; pancreatic cancer; single-cell RNA sequencing.


Conflict of interest statement

Declaration of interests The authors declare no competing interests.

Figures

Figure 1.
Figure 1.. Single-cell RNA sequencing (RNA-seq) of human PDAC reveals 51 different cancer cell phenotypes across the EMT continuum
(A) Seurat uniform manifold approximation and projection (UMAP) clustering of whole-tissue single-cell populations. The red dashed line highlights the cancer cells isolated for further analysis. (B) UMAP clustering of patient cancer cells post-MAGIC using the Thiery EMT signature. (C) Same as (B), recolored to reflect the E/M score. (D) E/M score for each cluster, with the percentage of cancer cells in each E/M phenotype and corresponding expression heatmap of the Thiery EMT signature. Epithelial genes are above the red line. The blue line indicates the chosen cutoff between epithelial, partial, and mesenchymal groups. (E) Percentage of cancer cells in each E/M phenotype. See also Figure S1.
Figure 2.
Figure 2.. Single-cell RNA seq of murine PDAC identifies 56 cancer cell phenotypes across the EMT spectrum
(A) Seurat UMAP clustering of whole-tissue single-cell populations. The red dashed line highlights the cancer cells isolated for further analysis. (B) UMAP clustering of murine pancreatic cancer cells post-MAGIC using the Thiery EMT signature. (C) Same as (B), recolored to reflect the E/M score. (D) E/M score for each cluster and corresponding expression heatmap of the Thiery EMT signature. Epithelial genes are above the red line. The blue line indicates the chosen cutoff between epithelial, partial, and mesenchymal groups, with the aggregated percentage of cancer cells indicated. (E) Pie charts for the percentage of cancer cells in each E/M phenotype for aggregated human and mouse and each experimental mouse cohort. See also Figure S2.
Figure 3.
Figure 3.. Stabilized epithelial phenotype of PDAC cells enhances liver metastasis
(A) Overall survival curve of KPC control (n = 17) and KPC;ST (n = 16) mice. (B) Disease-free survival curve of KPC control mice (n = 18) and KPC;ST (n = 30) mice as determined by first palpable pancreatic nodule. (C) Percentage of tumor burden (tumor-bearing pancreas weight/body weight) in grams of endpoint KPC control (n = 14) and KPC;ST (n = 15) mice. (D) Representative histological micrographs (2003) stained with H&E of primary pancreatic tumors and liver and lung metastatic lesions; 100 μm scale bar. The yellow line outlines the border of metastatic lesions. T marks tumor area and L marks liver or lung, respectively. (E) Relative percentage area of indicated epithelial phenotypes in primary pancreatic tumors of endpoint KPC control (n = 12) and KPC;ST (n = 14) mice. Two-way ANOVA. (F) Quantification of the percentage double positive of the indicated mesenchymal marker: Snail/Slug, Slug, Twist, Zeb1, Vimentin, αSMA, and FSP1 with YFP lineage tracing out the total number of YFP+ cells per 200 × image (5–10 images) per mouse: KPC (n = 9 or 10) and KPC;ST (n = 8) mice. Means ± SEMs. (G) Quantification of the number of metastatic lesions per tissue depth in the liver (KPC control, n = 25 depths, 8 mice, and KPC;ST, n = 32 depths, 12 mice), lung (KPC control, n = 11 depths, 5 mice, and KPC;ST, n = 13 depths, 8 mice), and other tissues (KPC control, n = 13 depths, 11 mice, and KPC;ST, n = 10 depths, 9 mice). (H) Quantification of the metastatic area per tissue depth for the liver (KPC control, n = 25 depths, 8 mice, and KPC;ST, n = 32 depths, 12 mice), lung (KPC control, n = 11 depths, 5 mice, and KPC;ST, n = 13 depths, 6 mice), and other tissues (KPC control, n = 13 depths, 11 mice, and KPC;ST mice, n = 10 depths, 9 mice). (I) Pie charts for the percentage of cancer cells in each E/M phenotype across indicated experimental cohort. Unless otherwise specified, data are presented as means ± SDs and significance determined by an unpaired two-tailed t test. ns, not significant, *p < 0.05, **p < 0.01. See also Figure S3.
Figure 4.
Figure 4.. Stabilized epithelial PDAC cells migrate by collective cell migration
(A and B) Select enriched gene sets comparing primary tumors (A) and metastatic tumors (B). All pathways displayed are significant with a nominal p value, false discovery rate (FDR) q value, and family-wise error rate (FWER) p value < 0.05. (C–F) Representative micrographs (40×) (C), matching inverted PHANTAST cell segmentation masks (D) and quantifications (E and F) of 3–4 replicate experiments with increasing passage numbers of cancer cell lines isolated from the primary tumors of KPC control, KPC;ST, and KP-EFF-AdCre (n = 3, 3, and 1 line isolated from individual mice, respectively) plated to confluency. The red boxes indicate digital zoom of areas magnified in far-right panel. Quantifications of the particle counts (E) and percentage of cellular confluency (F) with linear regressions (****p < 0.001) of the grouped values post-scratch for the indicated time points. See also Figure S4.
Figure 5.
Figure 5.. Epithelial PDAC cells associate with more T cells
(A) Immune cell percentages from scRNA-seq for each GEMM cohort. (B) Cell population percentages from multiplexed immunohistochemistry for indicated genotype. (C) Correlation between CD8+ T cells and CK8+ αSMA+ cancer cells in KPC and KPC;ST tumors. (D) Correlation between CD8+ T cells and YFP+CK8+AnyMesenchymal marker+ (Vimentin, αSMA, Zeb1, Snail, Twist, Slug, and FSP1) cancer cells in KPC and KPC;ST tumors. (E) Immune cell percentages from scRNA-seq for each patient grouped by E/M classifications. (F) Survival of patients high or low for EMT determined by multiplexed immunohistochemistry (split on the median). (G) Cell population percentages from multiplexed immunohistochemistry for patients high or low for EMT (CK8+ αSMA+). (H) Correlation between CD8+ T cells and CK8+ αSMA+ cancer cells. (I) L-function area under the curve values (reflecting the number of cells) for CD8+ T cell within 20 μm of CK8+ or CK8+ αSMA+ cancer cells; t test. Unless otherwise specified, data are presented as means ± SDs and significance determined by one-way ANOVA. ns, not significant, *p < 0.05, **p < 0.01, ****p < 0.0001. See also Figure S5.
Figure 6.
Figure 6.. Epithelial stablization via Zeb1 ablation also enhances liver metastasis
(A) Disease-free survival curve of KPPC (n = 3), KPPC;ZF/+ (n = 12), and KPPC; Zeb1cKO(n = 5) mice as determined by first palpable pancreatic nodule. (B) Overall survival of KPPC (n = 4), KPPC;ZF/+ (n = 7), and KPPC; ZcKO(n = 5) mice. Log-rank tests. (C) Percentage of tumor burden (tumor-bearing pancreas weight/body weight) in grams plotted by age of necropsy (n = 4, 11, 5 mice, respectively); lines represent linear regression. (D) Weighted sum of pathology scores for each mouse plotted by age of necropsy (n = 4, 7, and 5 mice); linear regression line. (E) Percentage tumor burden of endpoint mice (n = 4, 6, 5 mice, respectively). (F) Relative percentages of epithelial tumor histology of endpoint mice (n = 4, 7, 5 mice, respectively), two-way ANOVA. (G) Representative histological micrographs (200×) stained with H&E of primary pancreatic tumors and liver and lung tissues. The yellow line outlines the border of metastatic lesions. T marks tumor area, and L marks liver or lung, respectively. (H) Quantifications of the percentage of double positive out of YFP+ cells per field of view (200× magnification) of primary pancreatic tumors (n = 4, 5, and 5 mice, respectively) and indicated mesenchymal markers: Snail/Slug, Slug, Twist, Zeb1, Vimentin, αSMA, or FSP1. SEM, ANOVA. (I) Quantification of the metastatic area per tissue depth for liver (KPPC, n = 16 depths, 4 mice, KPPC;ZF/+, n = 48 depths, 12 mice, and KPPC; ZcKO, n = 20 depths, 5 mice), lung (KPPC, n = 12 depths, 4 mice, KPPC;ZF/+, n = 36 depths, 12 mice, and KPPC; ZcKO, n = 15 depths, 5 mice), and other tissues (KPPC, n = 50 depths, 4 mice, KPPC;ZF/+, n = 72 depths, 12 mice, and KPPC; ZcKO, n = 30 depths, 5 mice). Unless otherwise specified, data are presented as means ± SDs, scale bar: 100 μm, and significance determined by a one-way ANOVA. ns, not significant, *p < 0.05, **p < 0.01, ***p < 0.001, ****p < 0.0001. See also Figure S6.

References

    1. Aceto N, Bardia A, Miyamoto DT, Donaldson MC, Wittner BS, Spencer JA, Yu M, Pely A, Engstrom A, Zhu H, et al. (2014). Circulating tumor cell clusters are oligoclonal precursors of breast cancer metastasis. Cell 158, 1110–1122. - PMC - PubMed
    1. Aiello NM, Maddipati R, Norgard RJ, Balli D, Li J, Yuan S, Yamazoe T, Black T, Sahmoud A, Furth EE, et al. (2018). Emt subtype influences epithelial plasticity and mode of cell migration. Dev. Cell 45, 681–695.e4. - PMC - PubMed
    1. Arumugam T, Ramachandran V, Fournier KF, Wang H, Marquis L, Abbruzzese JL, Gallick GE, Logsdon CD, McConkey DJ, and Choi W (2009). Epithelial to mesenchymal transition contributes to drug resistance in pancreatic cancer. Cancer Res. 69, 5820–5828. - PMC - PubMed
    1. Bankhead P, Loughrey MB, Fernández JA, Dombrowski Y, McArt DG, Dunne PD, McQuaid S, Gray RT, Murray LJ, Coleman HG, et al. (2017). QuPath: open source software for digital pathology image analysis. Sci. Rep 7, 16878. - PMC - PubMed
    1. Beerling E, Oosterom I, Voest E, Lolkema M, and van Rheenen J (2016). Intravital characterization of tumor cell migration in pancreatic cancer. Intravital 5, e1261773. - PMC - PubMed

Publication types

MeSH terms