. 2021 Apr 13;35(2):108978.
doi: 10.1016/j.celrep.2021.108978.

Single-cell transcriptomics identifies gene expression networks driving differentiation and tumorigenesis in the human fallopian tube

Affiliations

Single-cell transcriptomics identifies gene expression networks driving differentiation and tumorigenesis in the human fallopian tube

Huy Q Dinh et al. Cell Rep. .

Abstract

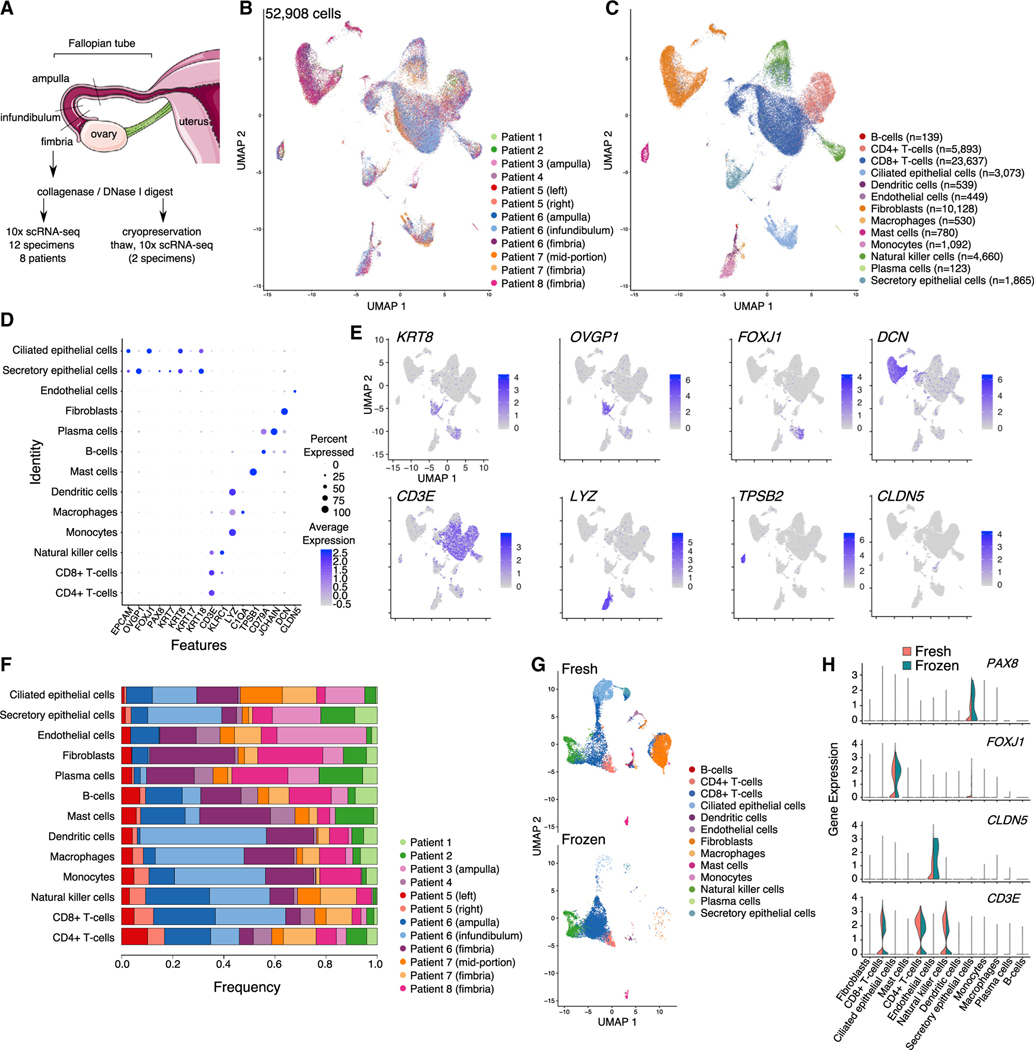
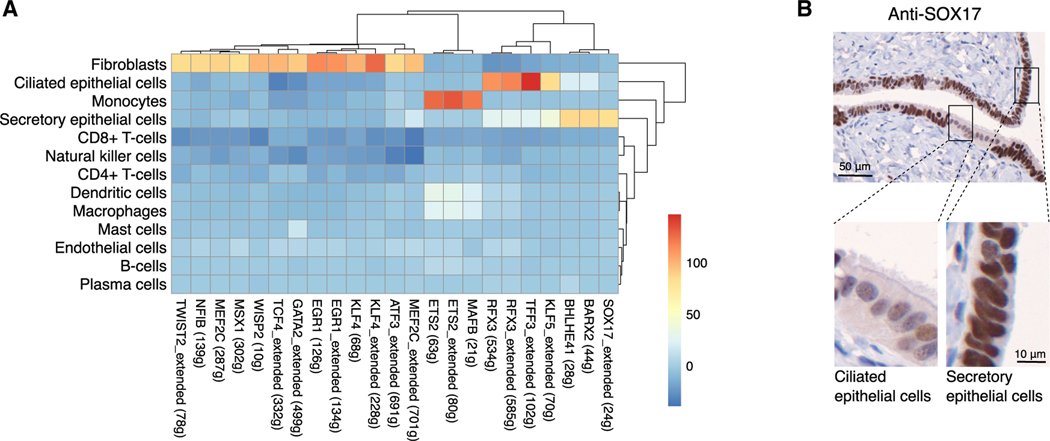
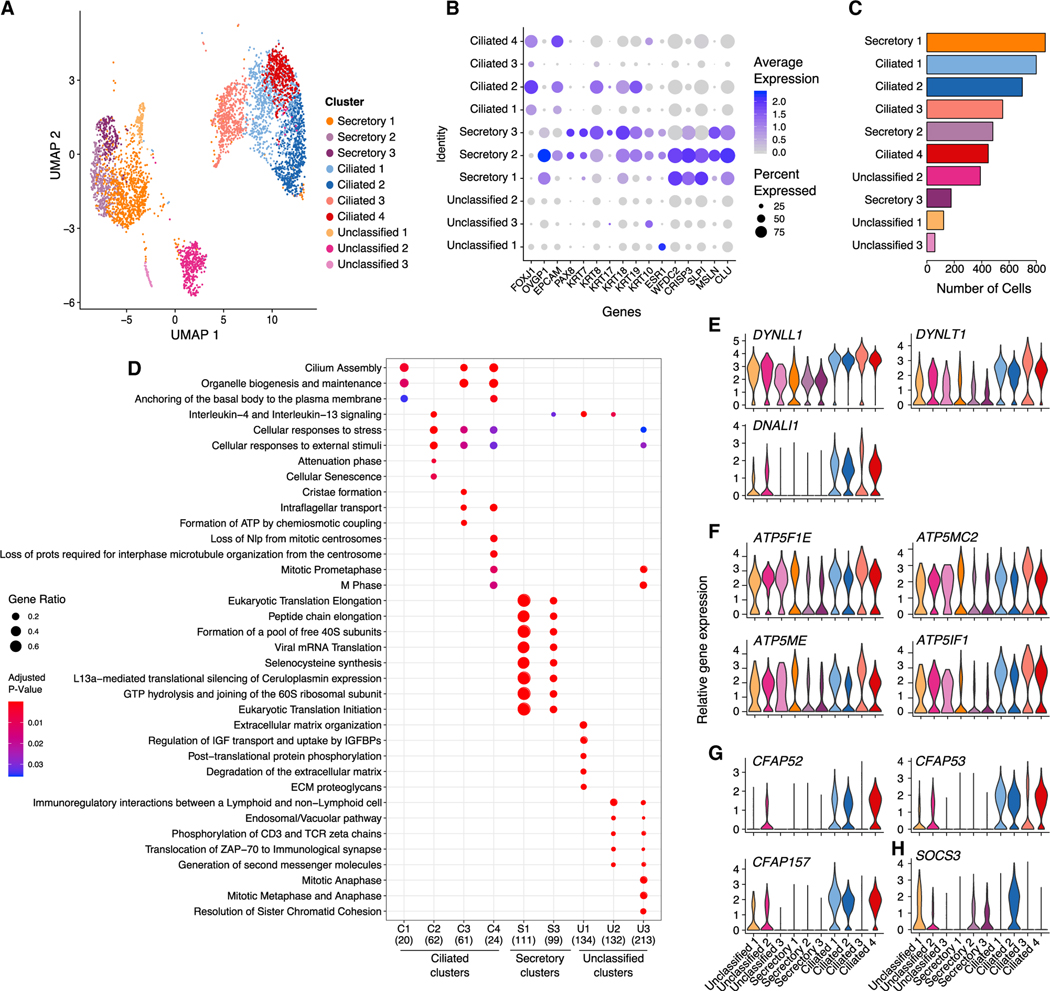
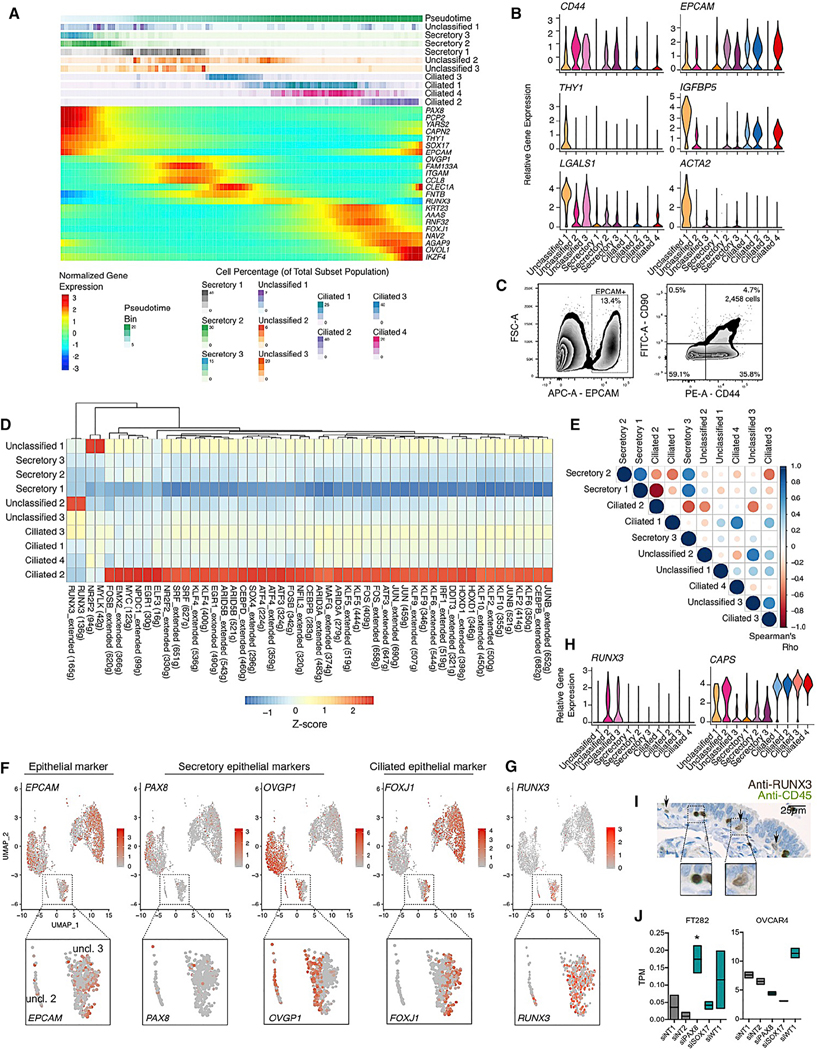
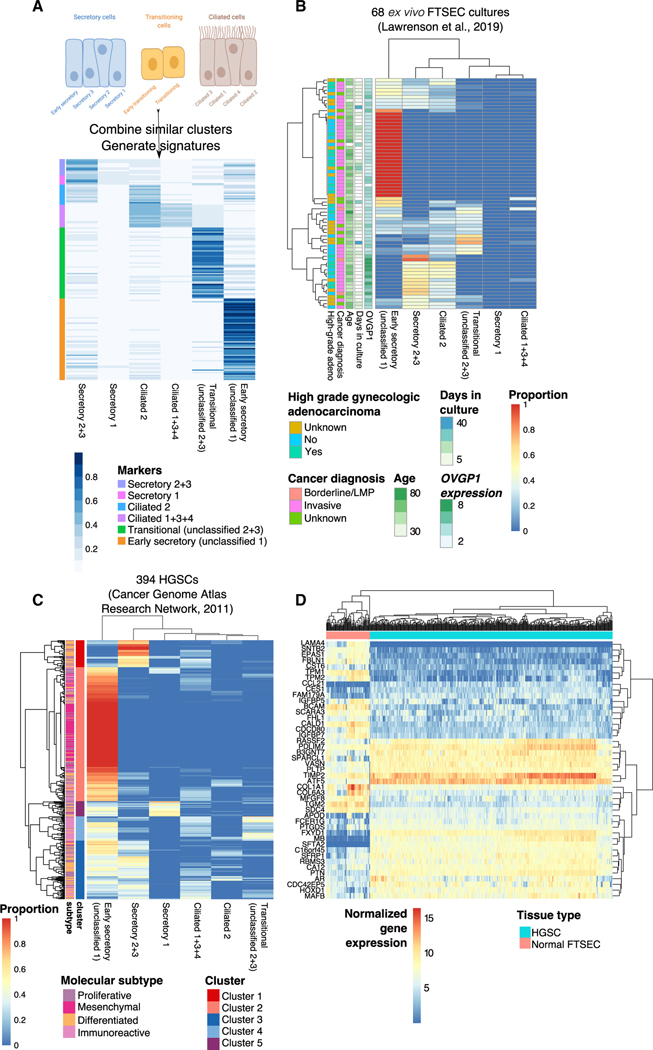
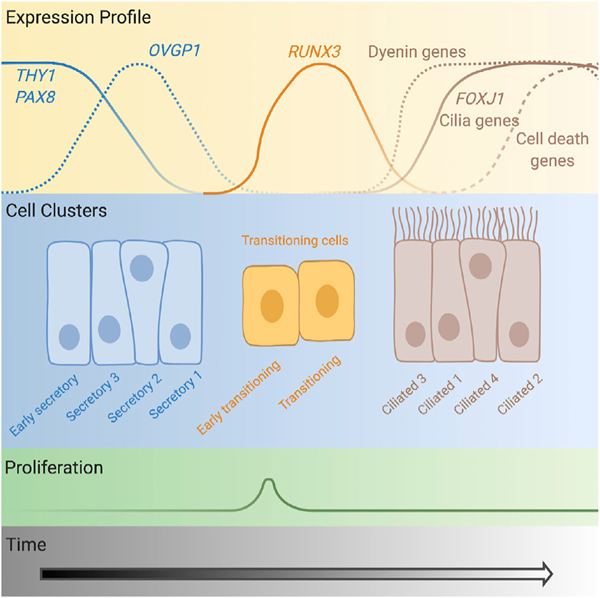
The human fallopian tube harbors the cell of origin for the majority of high-grade serous "ovarian" cancers (HGSCs), but its cellular composition, particularly the epithelial component, is poorly characterized. We perform single-cell transcriptomic profiling of around 53,000 individual cells from 12 primary fallopian specimens to map their major cell types. We identify 10 epithelial subpopulations with diverse transcriptional programs. Based on transcriptional signatures, we reconstruct a trajectory whereby secretory cells differentiate into ciliated cells via a RUNX3high intermediate. Computational deconvolution of advanced HGSCs identifies the "early secretory" population as a likely precursor state for the majority of HGSCs. Its signature comprises both epithelial and mesenchymal features and is enriched in mesenchymal-type HGSCs (p = 6.7 × 10⁻²⁷), a group known to have particularly poor prognoses. This cellular and molecular compendium of the human fallopian tube in cancer-free women is expected to advance our understanding of the earliest stages of fallopian epithelial neoplasia.

Keywords: PAX8; RUNX3; SOX17; ciliated epithelial cells; fallopian tube; microenvironment; ovarian cancer; scRNA-seq; secretory epithelial cells; transcription factor.


Conflict of interest statement

Declaration of interests The authors declare no competing interests.

Figures

Figure 1.
Figure 1.. A cellular gene expression atlas of human fallopian tubes in cancer-free women
(A) Schematic showing overall study design. (B and C) UMAP plot showing the major cellular clusters (B) by patient and (C) by cell type. (D) Scaled expression level of cell-type-defining markers and percentage of positive cells in each cluster. (E) UMAP plots overlaying cluster-specific expression patterns of representative cell-type-defining markers. (F) Frequency of cells in each cluster, by patient. (G) UMAP plots for 2 specimens before and after cryopreservation. (H) Violin plots of representative marker expression in 2 specimens, before and after cryopreservation. UMAP, uniform manifold approximation and projection.
Figure 2.
Figure 2.. Transcription factor analyses in human FT cell populations
(A) Identification of TF regulons enriched in specific cell types using SCENIC (t value from a linear model test of regulon activity score of one subset versus the rest; see STAR Methods). Numbers in brackets denote the number of genes contained in the regulon; “extended” means the regulons include motifs that have been linked to the TF using motif similarity from SCENIC pipeline. (B) Validation of SOX17 expression in human FT tissues using immunohistochemistry. In all specimens examined, staining was suggestive of stronger staining in secretory cells, distinguished here by their oval nuclei compared to the rounded nuclear morphology of ciliated cells.
Figure 3.
Figure 3.. Epithelial cell subpopulations in the human fallopian tube
(A) UMAP representation of 10 distinct epithelial clusters revealed by graph-based Louvain clustering implemented in the Seurat single-cell data analysis package. (B) Dot plot presentation of scaled expression of epithelial, secretory, and ciliated cell markers. (C) Frequency histogram for the 10 epithelial clusters. (D) Pathway analyses performed using the ReactomePA R package. All pathways with p < 0.05 are shown. Secretory cluster 2 has zero enriched pathways reaching p < 0.05. (E–G) Expression of (E) dynein protein-encoding genes, (F) ATP synthase 5 subunit genes, and (G) genes encoding cilia proteins.
Figure 4.
Figure 4.. A differentiation trajectory for fallopian tube epithelia
(A) Pseudotime analyses performed using discriminative dimensionality reduction with trees (DDRTree) implemented in the Monocle2 package. The upper portion of the panel shows inferred pseudotime, divided into 100 bins, from early (left) to late (right). Proportion of cells from each cluster assigned to each bin are shown below. The lower panel shows expression of known and newly identified biomarkers across the pseudotime trajectory identified using a differential expression test (linear model of pseudotime) in Monocle2. (B) Expression of CD44, EPCAM, and markers enriched in unclassified cluster 1. (C) Validation of the presence of unclassified cluster 1 in a fallopian tube tissue using flow cytometry. (D) Transcription factor regulon analyses performed using SCENIC. (E) Correlation of t values from linear model test contrasting 1 subset versus the other 9 subsets. Color of dot denotes direction of correlation (Spearman correlation test); size denotes correlation coefficient. (F) UMAP plots showing expression of EPCAM and secretory/ciliated cell genes. Inset panels show a gradient of PAX8, OVGP1m and FOXJ1 expression in unclassified clusters 2 and 3. (G) RUNX3 expression is restricted to unclassified clusters 2 and 3. (H) Violin plots of RUNX3 and CAPS expression. (I) RUNX3 expression in a benign human fallopian tube. Tissues were co-stained with anti-RUNX3 (brown chromogen) and anti-CD45 (green chromogen). Dual-positive intraepithelial lymphocytes with rounded nuclei (left inset panel) were detected, in addition to RUNX3+ epithelial cells (arrows and right inset panel). (J) Floating boxplots showing RUNX3 expression after PAX8, SOX17, or WT1 knockdown. Upper and lower boundaries of the box denote maximum and minimum expression values; horizontal line denotes mean. TPM, transcripts per million; normalized RNA-seq reads. n = 2 independent small interfering RNA (siRNA) transfections. * |log FC| > 1; p = 0.02; negative binomial regression performed using DESeq2.
Figure 5.
Figure 5.. Signatures of early secretory epithelia are enriched in fallopian epithelial cultures and HGSCs
(A) Development of epithelial subset signatures informed by pseudotime analyses; subsets with similar profiles of marker genes were combined for computational deconvolution analysis. (B) Deconvolution of bulk RNA-seq profiles of 68 ex vivo FTSEC cultures: heatmap of the composition of 6 subsets in each sample. A subset of patients had diagnoses of high-grade adenocarcinomas of the ovary, endometrium, or cervix. (C) Deconvolution of 394 HGSCs from The Cancer Genome Atlas (TCGA). (D) The NR2F2 regulon is dysregulated in HGSCs compared to FTSECs. Top differentially expressed genes were identified by calculating |(mean HGSC expression – mean FTSEC expression)| > 2. On all heatmaps, rows and columns are ordered using unsupervised hierarchical clustering based on Euclidian distances.
Figure 6.
Figure 6.. Diagram of the cellular differentiation path for fallopian tube epithelia
Expression profiles of key markers and transcription factors are shown (not to scale). The “early secretory” cluster corresponds to the former “unclassified cluster 1,” the “early transitioning” cluster corresponds to “unclassified cluster 3,” and the “transitioning” cluster corresponds to “unclassified cluster 2.” Created with BioRender.com.

References

    1. Aibar S, González-Blas CB, Moerman T, Huynh-Thu VA, Imrichova H, Hulselmans G, Rambow F, Marine J-C, Geurts P, Aerts J, et al. (2017). SCENIC: single-cell regulatory network inference and clustering. Nat. Methods 14, 1083–1086. - PMC - PubMed
    1. Anders S, Pyl PT, and Huber W (2015). HTSeq–a Python framework to work with high-throughput sequencing data. Bioinformatics 31, 166–169. - PMC - PubMed
    1. Ardighieri L, Lonardi S, Moratto D, Facchetti F, Shih, IeM., Vermi W, and Kurman RJ (2014). Characterization of the immune cell repertoire in the normal fallopian tube. Int. J. Gynecol. Pathol 33, 581–591. - PMC - PubMed
    1. Barghout SH, Zepeda N, Vincent K, Azad AK, Xu Z, Yang C, Steed H, Postovit L-M, and Fu Y (2015). RUNX3 contributes to carboplatin resistance in epithelial ovarian cancer cells. Gynecol. Oncol 138, 647–655. - PubMed
    1. Becht E, McInnes L, Healy J, Dutertre C-A, Kwok IWH, Ng LG, Ginhoux F, and Newell EW (2018). Dimensionality reduction for visualizing single-cell data using UMAP. Nat. Biotechnol Published online December 3, 2018. 10.1038/nbt.4314. - DOI - PubMed

Publication types

MeSH terms