. 2021 Apr 13;35(2):108996.
doi: 10.1016/j.celrep.2021.108996.

Avid binding by B cells to the Plasmodium circumsporozoite protein repeat suppresses responses to protective subdominant epitopes

Affiliations

Avid binding by B cells to the Plasmodium circumsporozoite protein repeat suppresses responses to protective subdominant epitopes

Deepyan Chatterjee et al. Cell Rep. .

Abstract

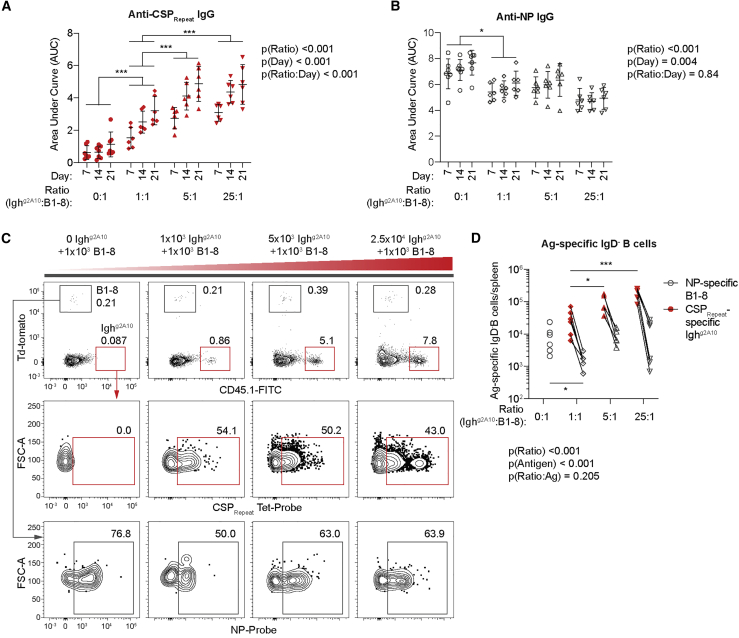
Antibodies targeting the NANP/NVDP repeat domain of the Plasmodium falciparum circumsporozoite protein (CSPRepeat) can protect against malaria. However, it has also been suggested that the CSPRepeat is a decoy that prevents the immune system from mounting responses against other domains of CSP. Here, we show that, following parasite immunization, B cell responses to the CSPRepeat are immunodominant over responses to other CSP domains despite the presence of similar numbers of naive B cells able to bind these regions. We find that this immunodominance is driven by avid binding of the CSPRepeat to cognate B cells that are able to expand at the expense of B cells with other specificities. We further show that mice immunized with repeat-truncated CSP molecules develop responses to subdominant epitopes and are protected against malaria. These data demonstrate that the CSPRepeat functions as a decoy, but truncated CSP molecules may be an approach for malaria vaccination.

Keywords: B cells; Plasmodium falciparum; circumsporozoite protein; immunodominance; immunodomination; malaria; malaria vaccines.


Conflict of interest statement

Declaration of interests The authors declare no competing interests.

Figures

None
Graphical abstract
Figure 1
Figure 1
Responses to the CSPRepeat are immunodominant over responses to other domains C57BL/6 mice were immunized with 5 × 104 irradiated Pb-PfSPZ sporozoites; blood and spleens were taken at 4, 7, 14, and 28 days post-immunization for analysis by ELISA and flow cytometry by using probes specific for each domain of CSP (CSPCterm, CSPRepeat, and CSPNterm). (A) IgG responses to each domain measured by ELISA; data are shown as area under the curve. (B) Representative flow cytometry plots from a single mouse at the day 7 time point showing the gating of PBs, GC B cells, and SwIg Mem for antigen-specific IgD B cells identified using tetramers specific for the CSPCterm, CSPRepeat, and CSPNterm; values are percentages. (C) Absolute numbers of (i) plasmablasts, (ii) GC B cells, and (iii) SwIg memory cells in each mouse for each antigen (domain). (D) IgG binding to CSP27 of day 28 sera from each Pb-PfSPZ immunized mouse after incubation with different concentrations of CSPRepeat peptide measured by ELISA. Data for (A) and (C) are represented as mean ± SD pooled from two independent experiments (n = 3–5 mice/time point/experiment); data were analyzed via two-way ANOVA, with experiment and mouse included in the model as fixed factors; ANOVA p values are listed below or adjacent to each graph. Pairwise comparisons were performed using a Tukey post-test, and significant pairwise comparisons are represented as symbols; p < 0.05, ∗∗p < 0.01, ∗∗∗p < 0.001.
Figure 2
Figure 2
The number of antigen-specific precursors does not predict the immunodominance hierarchy within CSP The number of precursors for each domain of CSP in C57BL/6 and MD4 mice was quantified using full-length CSP conjugated to PE and domain-specific probes conjugated to APC. (A) Representative flow cytometry plots showing the staining of antigen-specific cells in each mouse background. (B) Summary data from (A), mean ± SEM shown, all data were analyzed via two-way ANOVA, and ANOVA p values are listed below or adjacent to each graph; data are pooled from two independent experiments (n = 2–3 mice/group/experiment). Pairwise comparisons were performed using a Tukey post-test ,and significant pairwise comparisons are represented as symbols; p < 0.05, ∗∗p < 0.01, ∗∗∗p < 0.001.
Figure 3
Figure 3
Increasing the CSPRepeat-specific precursor number does not suppress the endogenous response to linked antigens 0, 1 × 104, 3 × 104, or 9 × 104 of CD45.1 Ighg2A10 cells were adoptively transferred into C57BL/6 mice followed by immunization with 30 μg CSP27-NP2 in alum. Sera were taken on days 7, 14, and 21 and spleens analyzed 21 days post-immunization. (A) Representative flow cytometry plots showing gating of total IgD and GC B cells specific for NP or the CSPRepeat; values are percentages. (B) Absolute numbers of NP probe+ and CSPRepeat tetramer+ IgD B cells. (C) Absolute numbers of NP probe+ and CSPRepeat tetramer+ GC B cells. (D) Total IgG response to CSPRepeat measured by (NANP)9 ELISA. (E) Total IgG response to NP measured by NP(14)BSA ELISA. (F) Absolute numbers of CSPRepeat tetramer+ CD45.1+ Ighg2A10 and CD45.1 endogenous cells. Data are represented as mean ± SD pooled from two independent experiments (n ≥ 3 mice/group/experiment); all data were analyzed via two-way ANOVA, with experiment and mouse included in the model as fixed factors. ANOVA p values are listed below or adjacent to each graph. Pairwise comparisons were performed using a Tukey post-test, and significant values are represented as symbols; p < 0.05, ∗∗p < 0.01, ∗∗∗p < 0.001.
Figure 4
Figure 4
Increasing CSPRepeat-specific precursor number does not suppress the response by rare B cells specific for linked antigens 1 × 103 B1-8hi cells and 0, 1 × 103, 5 × 103, or 2.5 × 104 CD45.1 Ighg2A10 cells were adoptively transferred into MD4 mice followed by immunization with 30 μg CSP27-NP2 in alum. Sera were taken on days 7, 14, and 21 and spleens analyzed 21 days post-immunization. (A) Total IgG response to CSPRepeat measured by (NANP)9 ELISA. (B) Total IgG response to NP measured via NP(14)BSA ELISA. (C) Representative flow cytometry plots showing gating of total IgD and GC B cells specific for NP or the CSPRepeat; values are percentages. (D) Absolute numbers of NP probe+ and CSPRepeat tetramer+ IgD B cells. Data are represented as mean ± SD pooled from two independent experiments (n ≥ 3 mice/group/experiment); all data were analyzed via two-way ANOVA, with experiment and mouse included in the model as fixed factors. ANOVA p values are listed below or adjacent to each graph. Pairwise comparisons to the 1:1 (control) group were performed using a Tukey post-test, and significant values are represented as symbols; p < 0.05, ∗∗p < 0.01, ∗∗∗p < 0.001.
Figure 5
Figure 5
Decreasing the valency of the CSPRepeat alters the immunodominance hierarchy Recombinant CSP9 was purified and conjugated to NP at a 1:2 ratio to generate CSP9-NP2, and mice were immunized with either CSP9-NP2 (23 μg) or CSP27-NP2 (30 μg) in alum; sera were taken on days 7, 14, and 21 and spleens analyzed 21 days post-immunization. (A) Approximate binding stoichiometry of the 2A10:Ag complex formed when a saturating concentration (2 μM) of mAb 2A10 was passed over immobilized CSP27 or CSP9; data show mean ± SD of two technical replicates (n = 2). (B) Calcium flux of sorted Ighg2A10 cells incubated with Indo-1 dye and stimulated with CSP27, CSP9, or OVA-HEL, and the Ca2+ flux was measured; near the end of the acquisition, ionomycin was added as a positive control; data show the mean ± SD of three experimental replicates with summary data. (C) Summary data from (B) analyzed via pairwise t test; mean ± SD shown. (D) Total IgG response to NP measured via NP(14)BSA ELISA. (E) Representative flow cytometry plots showing gating of total IgD and GC B cells specific for NP or the CSPRepeat; values are percentages. (F) Absolute numbers of NP probe+ and CSPRepeat tetramer+ IgD B cells. (G) Absolute numbers of NP probe+ and CSPRepeat tetramer+ GC B cells. (H) Total IgG response to CSPRepeat measured via (NANP)9 ELISA. Data for (D)–(H) are represented as mean ± SD pooled from two independent experiments (n ≥ 4 mice/group/experiment); these data were analyzed via two-way ANOVA, with experiment and mouse included in the model as fixed factors. ANOVA p values are listed below or adjacent to each graph. Pairwise comparisons were performed using a Tukey post-test, and significant values are represented as symbols; p < 0.05, ∗∗p < 0.01, ∗∗∗p < 0.001.
Figure 6
Figure 6
Immunization with truncated CSP molecules induces diverse antibody responses that protect against malaria C57BL/6 mice were immunized three times at 5-week intervals with 30 μg CSP9, CSP9NVDP, CSP27, or alum alone and challenged via mosquito bite with Pb-PfSPZ sporozoites; blood was drawn prior to each immunization and challenge for analysis of the antibody response. (A) Schematic of the experiment. (B) Overall IgG responses to CSP27. (C) Overall IgG responses to CSPNterm. (D) Overall IgG responses to CSPCterm. (E) Overall IgG responses to CSPRepeat. Data in (B)–(E) were from two experiments with five mice/experiment/group, analyzed via two-way ANOVA with experiment and mouse as blocking factors. ANOVA p values are listed below or adjacent to each graph; pairwise comparisons between groups (averaged over time) were performed using a Tukey post-test; and significant values are represented as symbols; p < 0.05, ∗∗p < 0.01, ∗∗∗p < 0.001. (F) Parasite burden measured via 18S RNA in the livers of mice 42 h post challenge; data were pooled from three experiments with three to five mice/experiment/group and analyzed via Kruskal-Wallis test with Dunn’s multiple comparisons test. (G) The proportion of immunized mice that remain free of the blood stage parasite over 14 days post-infectious mosquito bite challenge; data were pooled from two experiments, and pairwise comparisons with the control group were analyzed via log-rank (Mantel-Cox) test. (H) Proportion of mice from both (F) and (G) (five experiments in total) with no detectable parasite RNA/or that remain sub-patent in each group; pairwise comparisons were made via Fisher’s exact test. p < 0.05, ∗∗p < 0.01, ∗∗∗p < 0.001. (I) Ratio of the week 15 response to the NVDP peptide and the standard CSPRepeat peptide between the different immunization groups; data were from two experiments with five mice/experiment/group analyzed via one-way ANOVA with experiment as a blocking factor.
Figure 7
Figure 7
Distinct Ighv gene use by B cells responding to different domains of CSP CSPNterm-, CSPRepeat-, and CSPCterm-specific B cells were sorted from mice immunized 10 days previously with CSP27 or CSP9 in alum, and the heavy and light chain Ig genes were amplified with degenerate primers and sequenced. In each of the 2 groups, 10 mice were immunized in total; for each antigen, whole spleens from 3–4 mice were sorted to obtain specific B cells. (A) Ighv gene use among B cells specific for each antigen. (B) Correlation of Ighv gene use for the different antigens calculated. (C) Number of unique clones identified among B cells responding to each antigen; mean ± SEM shown. (D) Mutation frequency among unique reads in the Igkv genes used by B cells responding to each antigen; box shows interquartile range, and whiskers show 1%–99% range. Data in (C) and (B) were analyzed via two-way ANOVA, with mouse included in the model as fixed factors. ANOVA p values are listed below or adjacent to each graph. Pairwise comparisons were performed using a Tukey post-test, and significant values are represented as symbols; p < 0.05, ∗∗p < 0.01, ∗∗∗p < 0.001.

References

    1. Abbott R.K., Lee J.H., Menis S., Skog P., Rossi M., Ota T., Kulp D.W., Bhullar D., Kalyuzhniy O., Havenar-Daughton C. Precursor Frequency and Affinity Determine B Cell Competitive Fitness in Germinal Centers, Tested with Germline-Targeting HIV Vaccine Immunogens. Immunity. 2018;48:133–146.e6. - PMC - PubMed
    1. Agnandji S.T., Lell B., Fernandes J.F., Abossolo B.P., Methogo B.G., Kabwende A.L., Adegnika A.A., Mordmüller B., Issifou S., Kremsner P.G., RTS,S Clinical Trials Partnership A phase 3 trial of RTS,S/AS01 malaria vaccine in African infants. N. Engl. J. Med. 2012;367:2284–2295. - PMC - PubMed
    1. Angeletti D., Kosik I., Santos J.J.S., Yewdell W.T., Boudreau C.M., Mallajosyula V.V.A., Mankowski M.C., Chambers M., Prabhakaran M., Hickman H.D. Outflanking immunodominance to target subdominant broadly neutralizing epitopes. Proc. Natl. Acad. Sci. USA. 2019;116:13474–13479. - PMC - PubMed
    1. Arnaout R., Lee W., Cahill P., Honan T., Sparrow T., Weiand M., Nusbaum C., Rajewsky K., Koralov S.B. High-resolution description of antibody heavy-chain repertoires in humans. PLoS One. 2011;6:e22365. - PMC - PubMed
    1. Aye R., Sutton H.J., Nduati E.W., Kai O., Mwacharo J., Musyoki J., Otieno E., Wambua J., Bejon P., Cockburn I.A., Ndungu F.M. Malaria exposure drives both cognate and bystander human B cells to adopt an atypical phenotype. Eur. J. Immunol. 2020;50:1187–1194. - PMC - PubMed

Publication types

MeSH terms