. 2021 Apr 13;35(2):108989.
doi: 10.1016/j.celrep.2021.108989.

Functional analyses of human LUC7-like proteins involved in splicing regulation and myeloid neoplasms

Affiliations

Functional analyses of human LUC7-like proteins involved in splicing regulation and myeloid neoplasms

Noah J Daniels et al. Cell Rep. .

Abstract

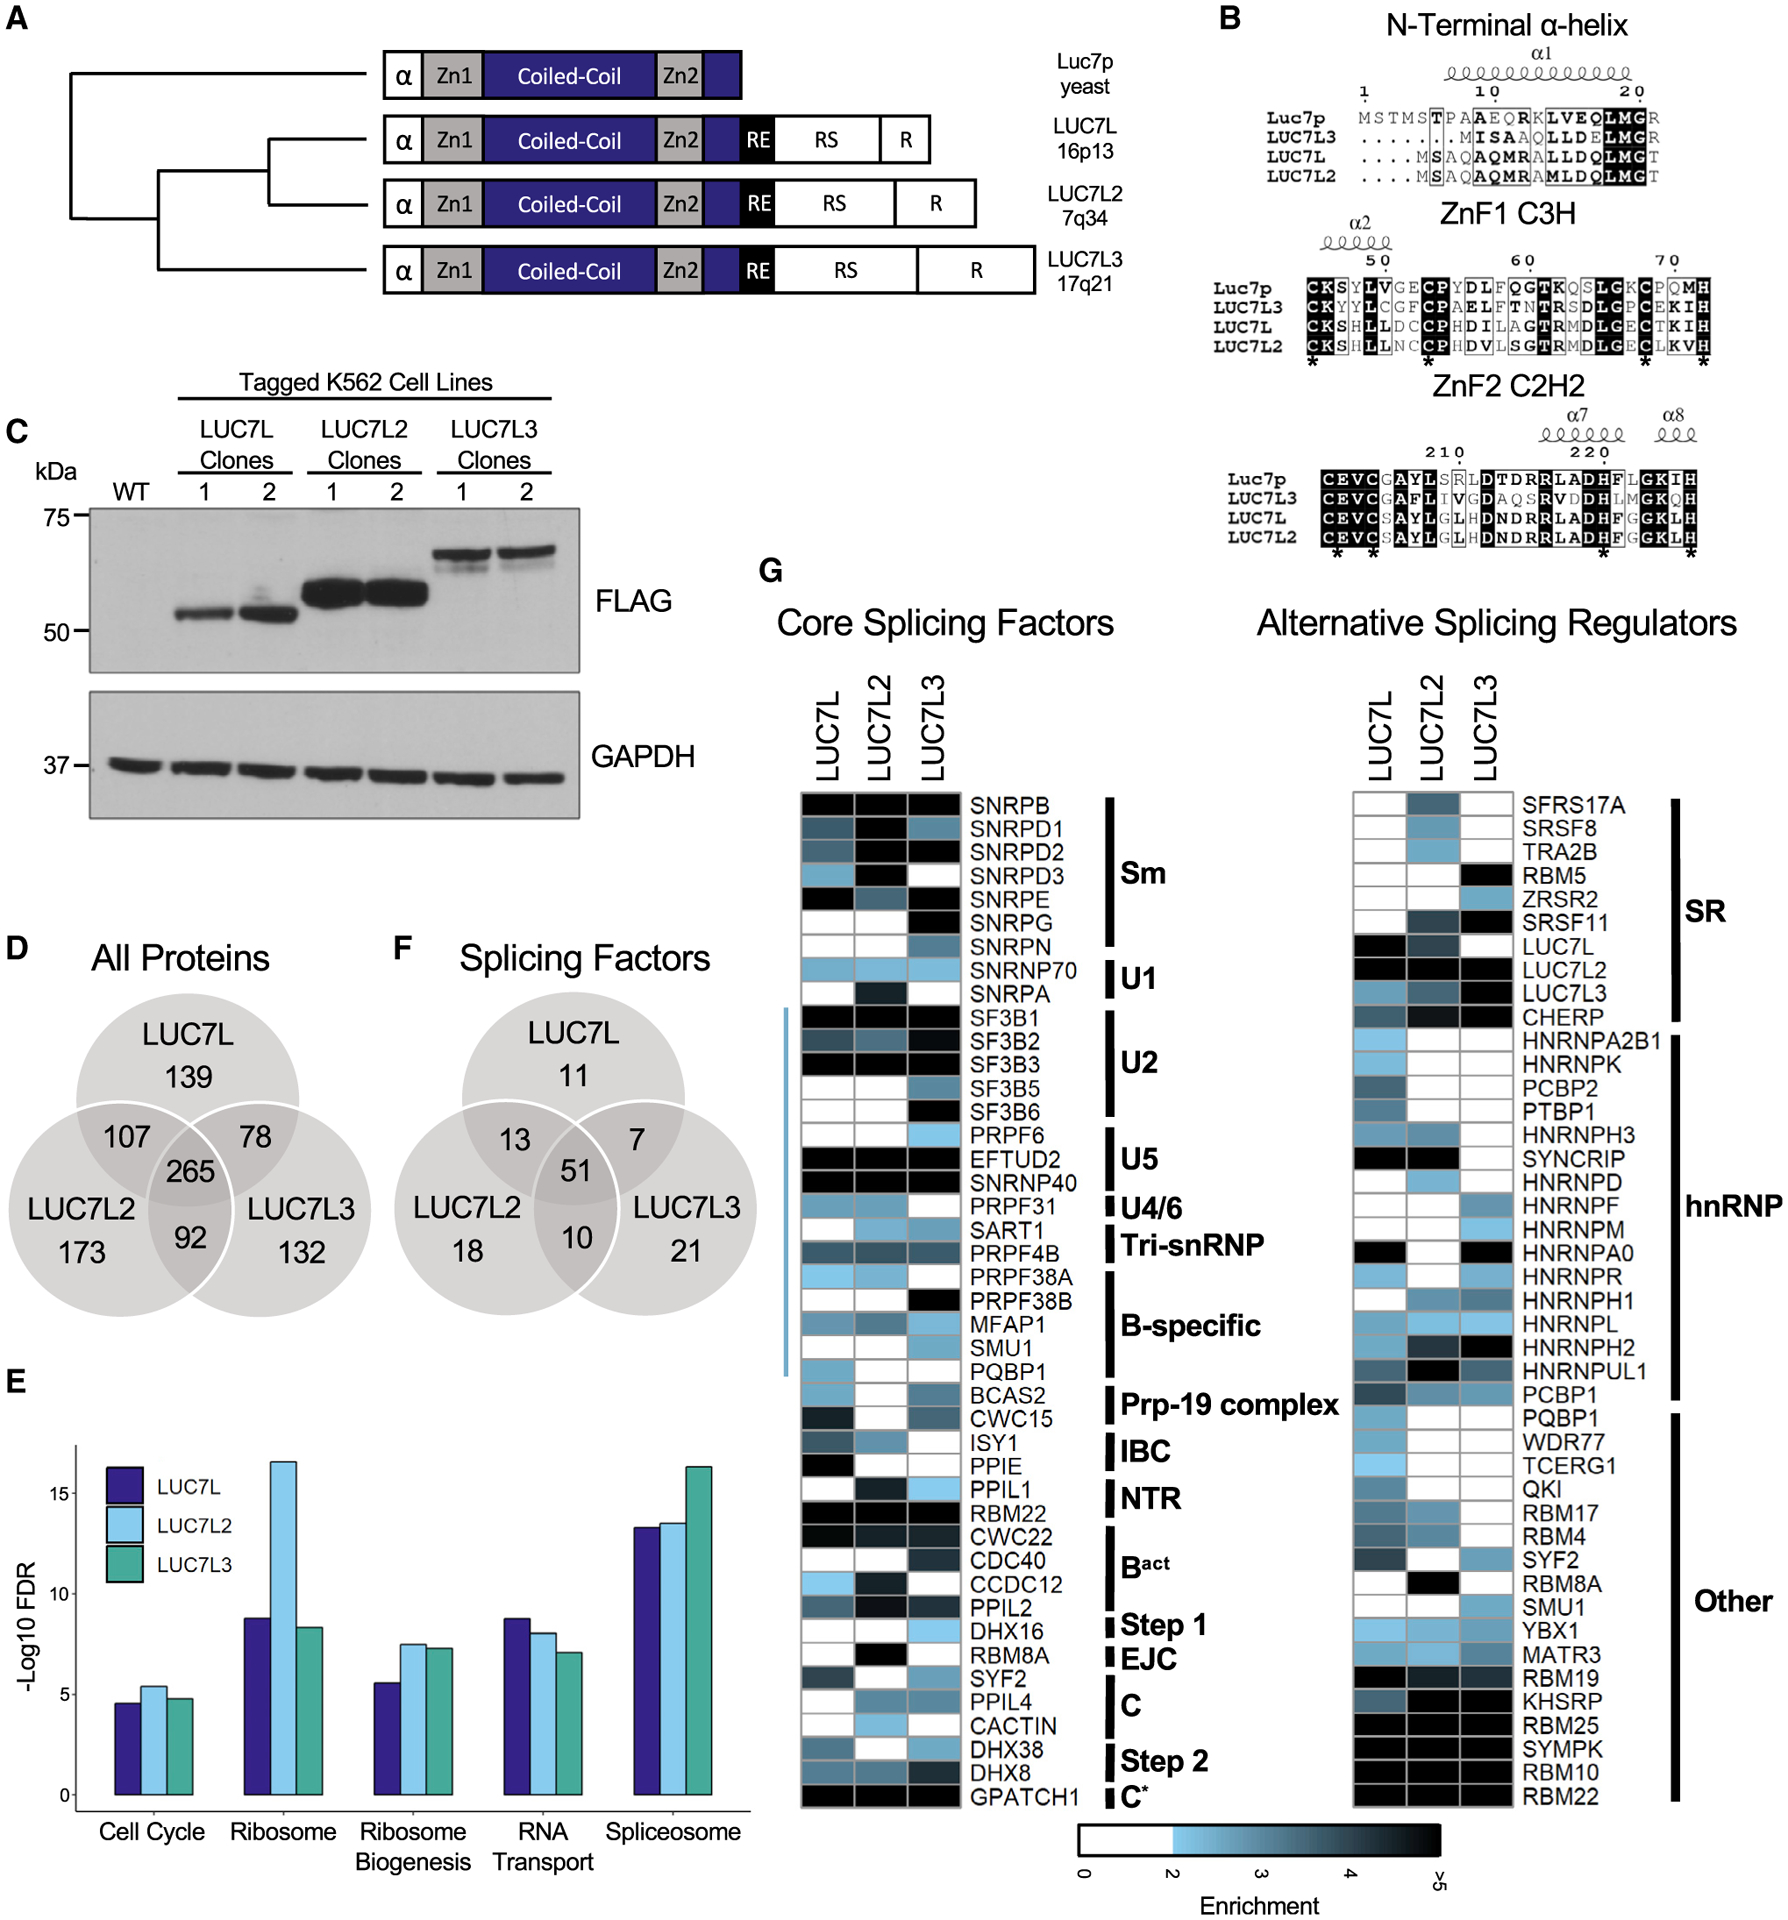
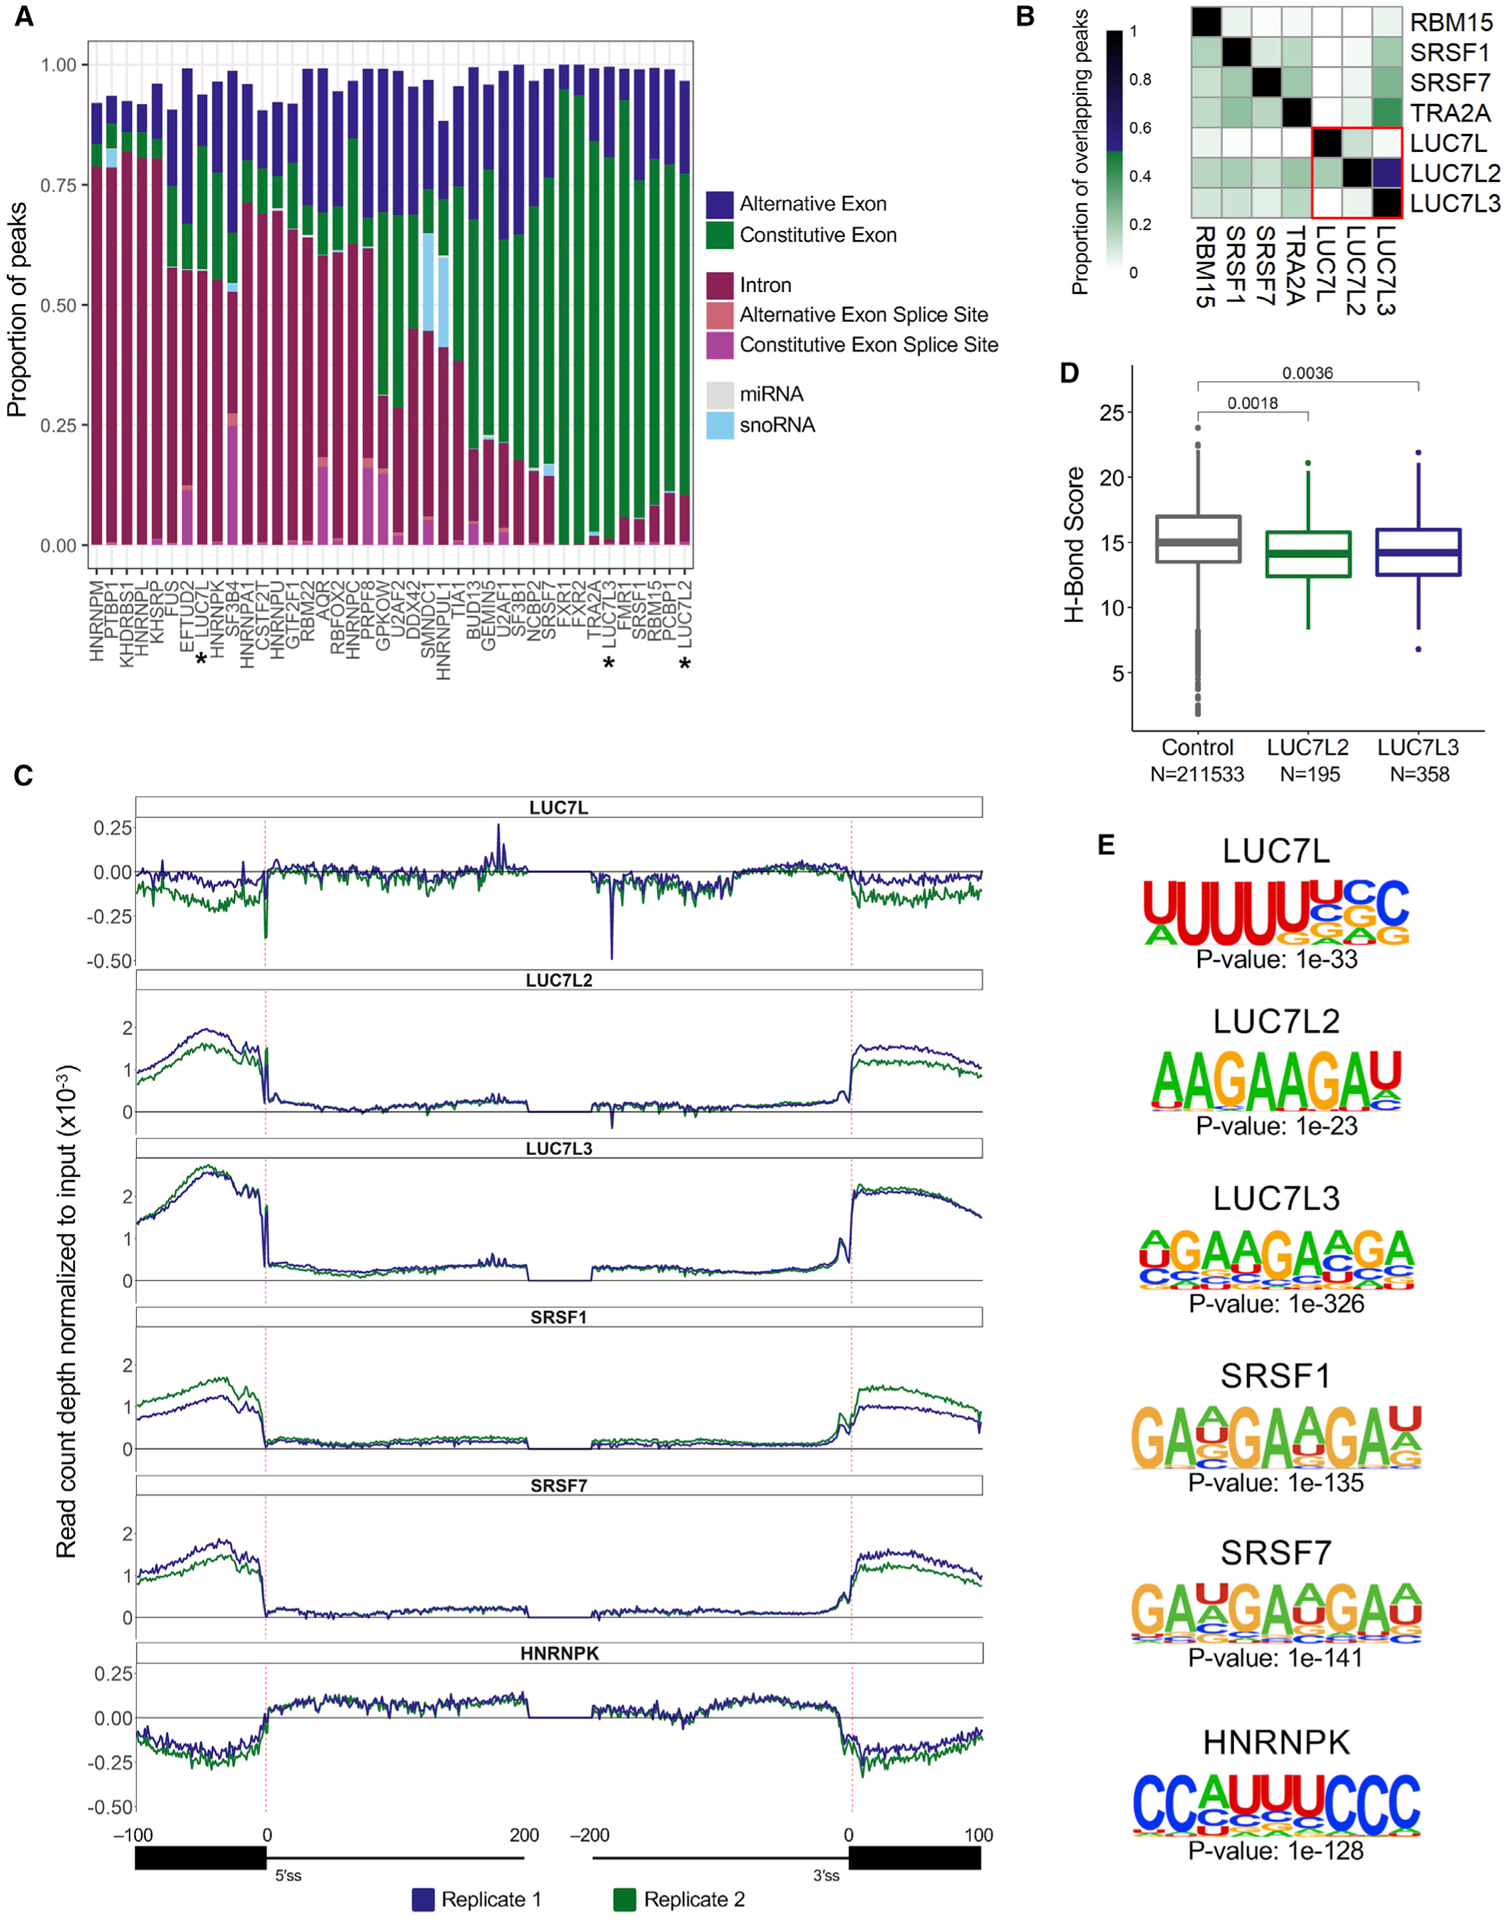
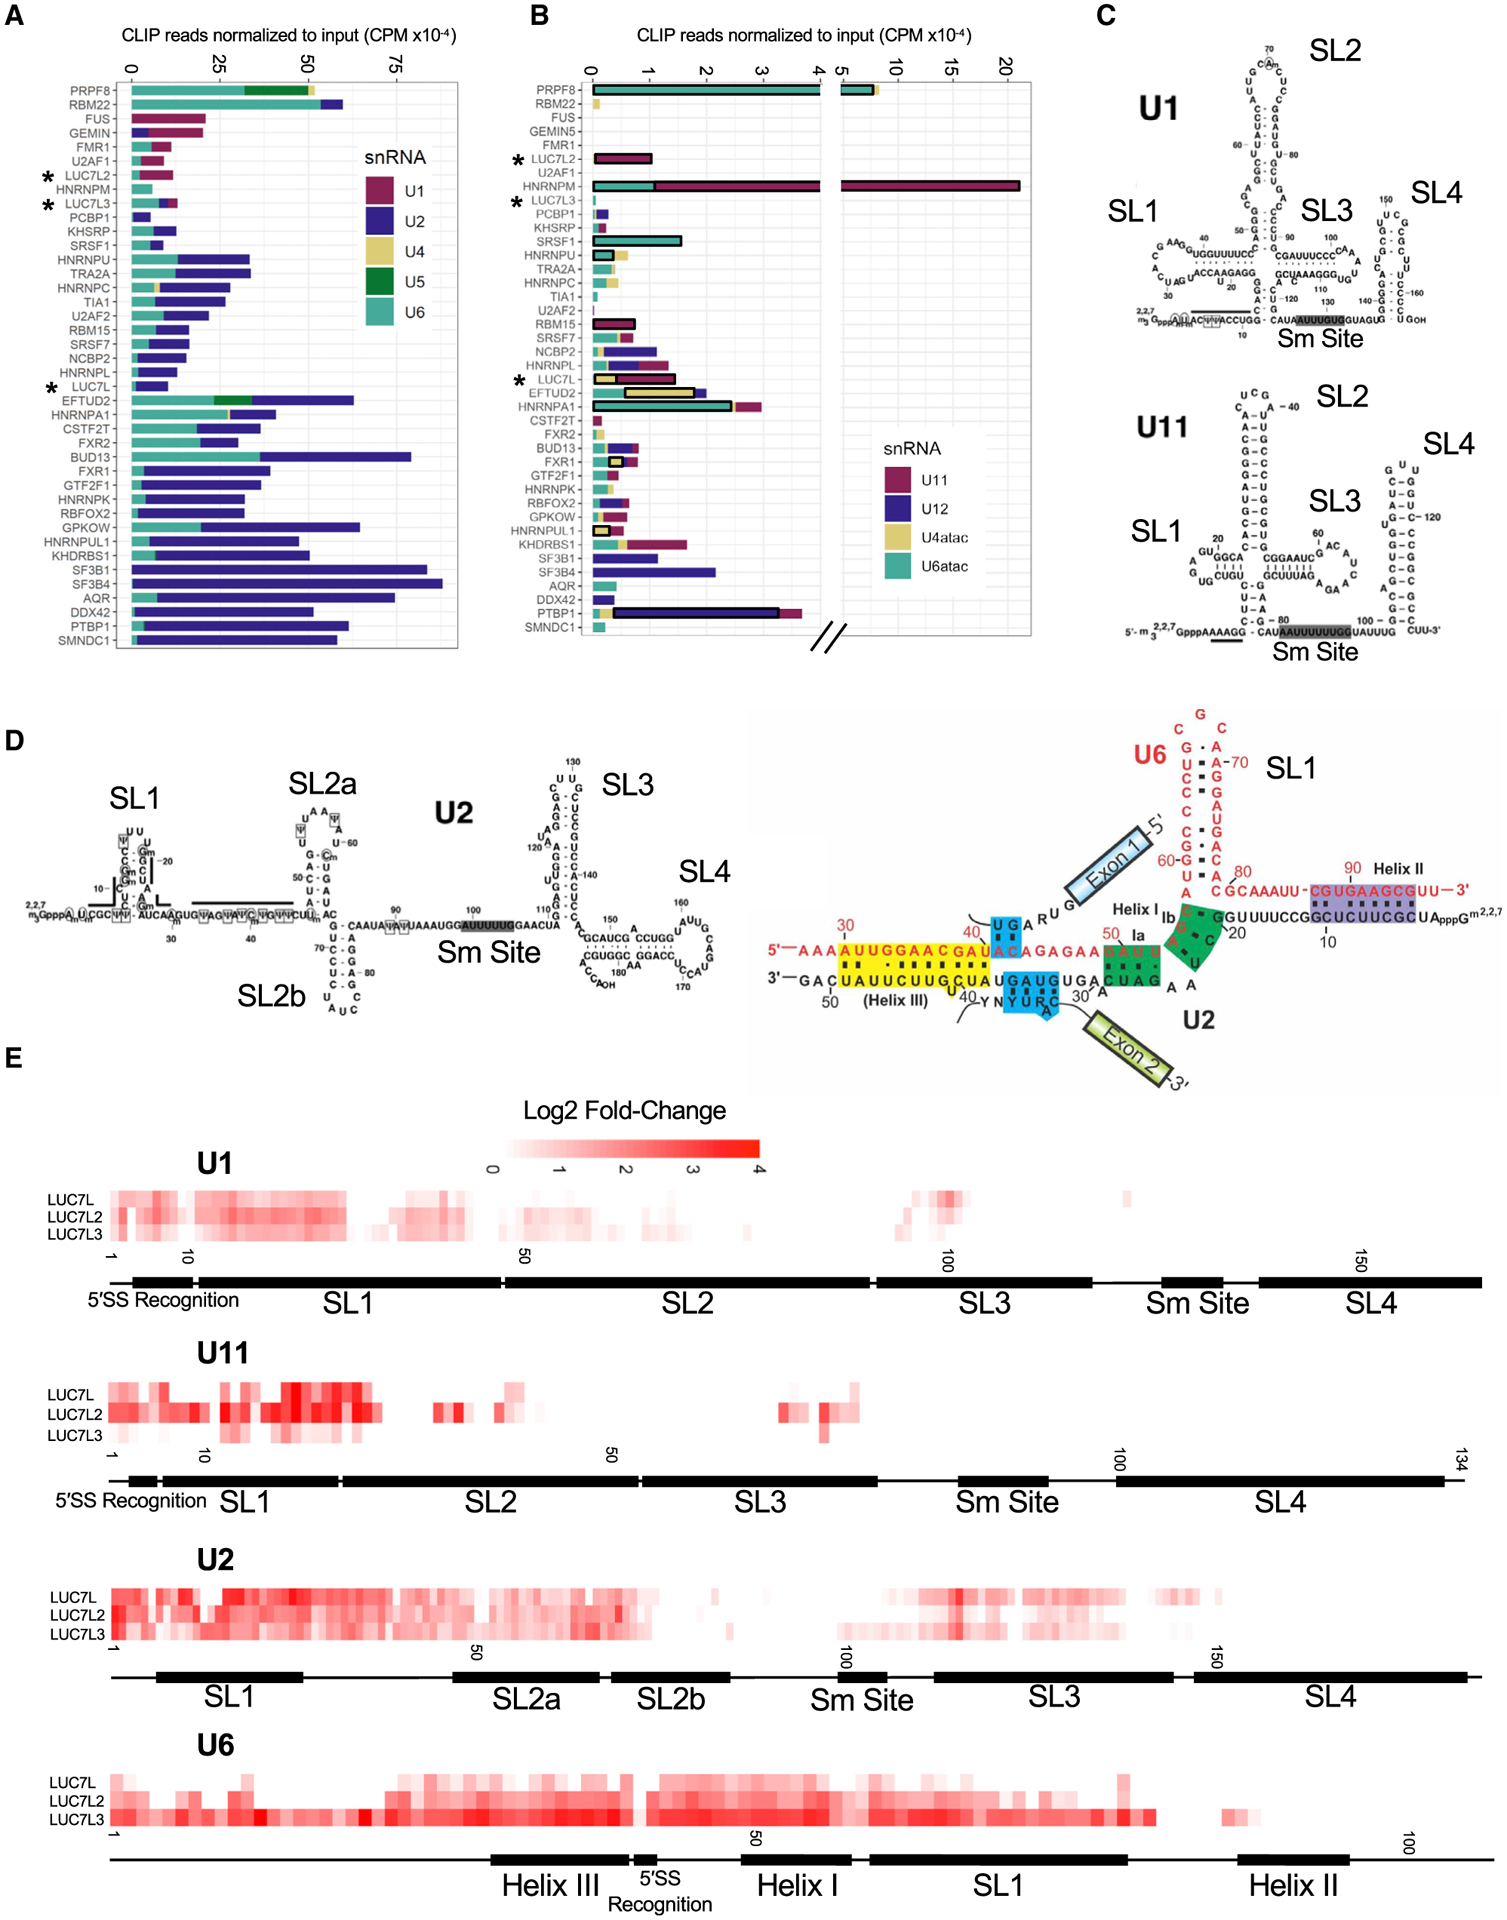
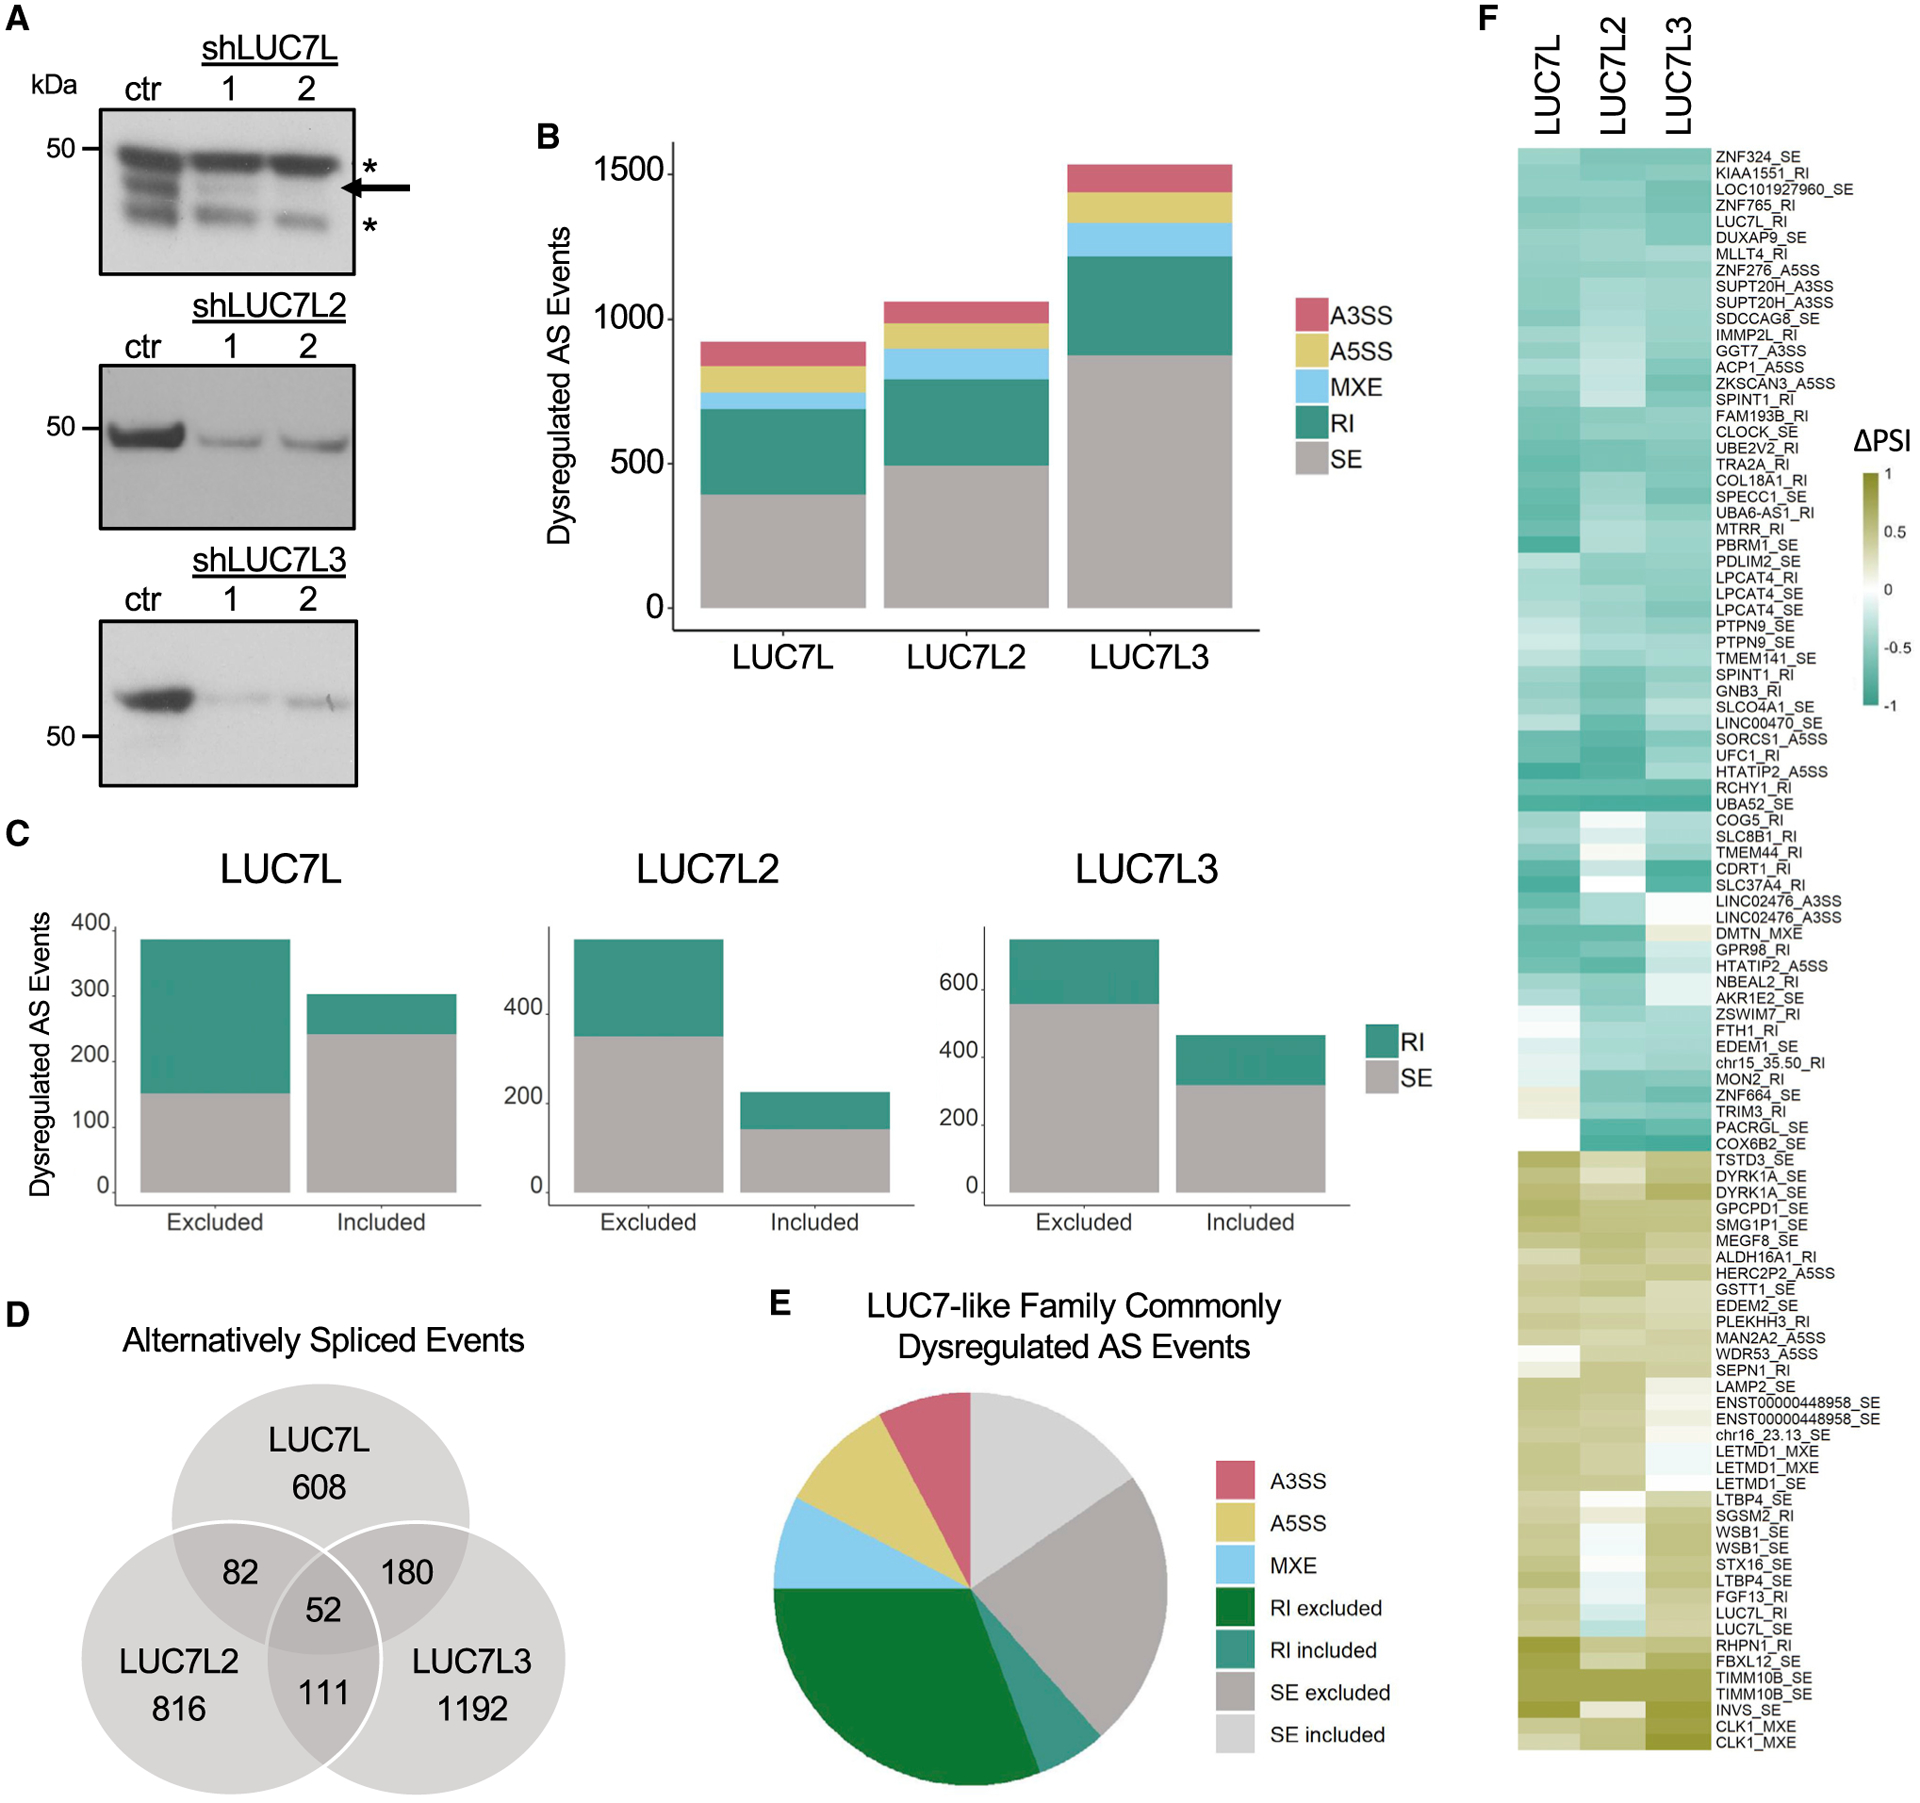
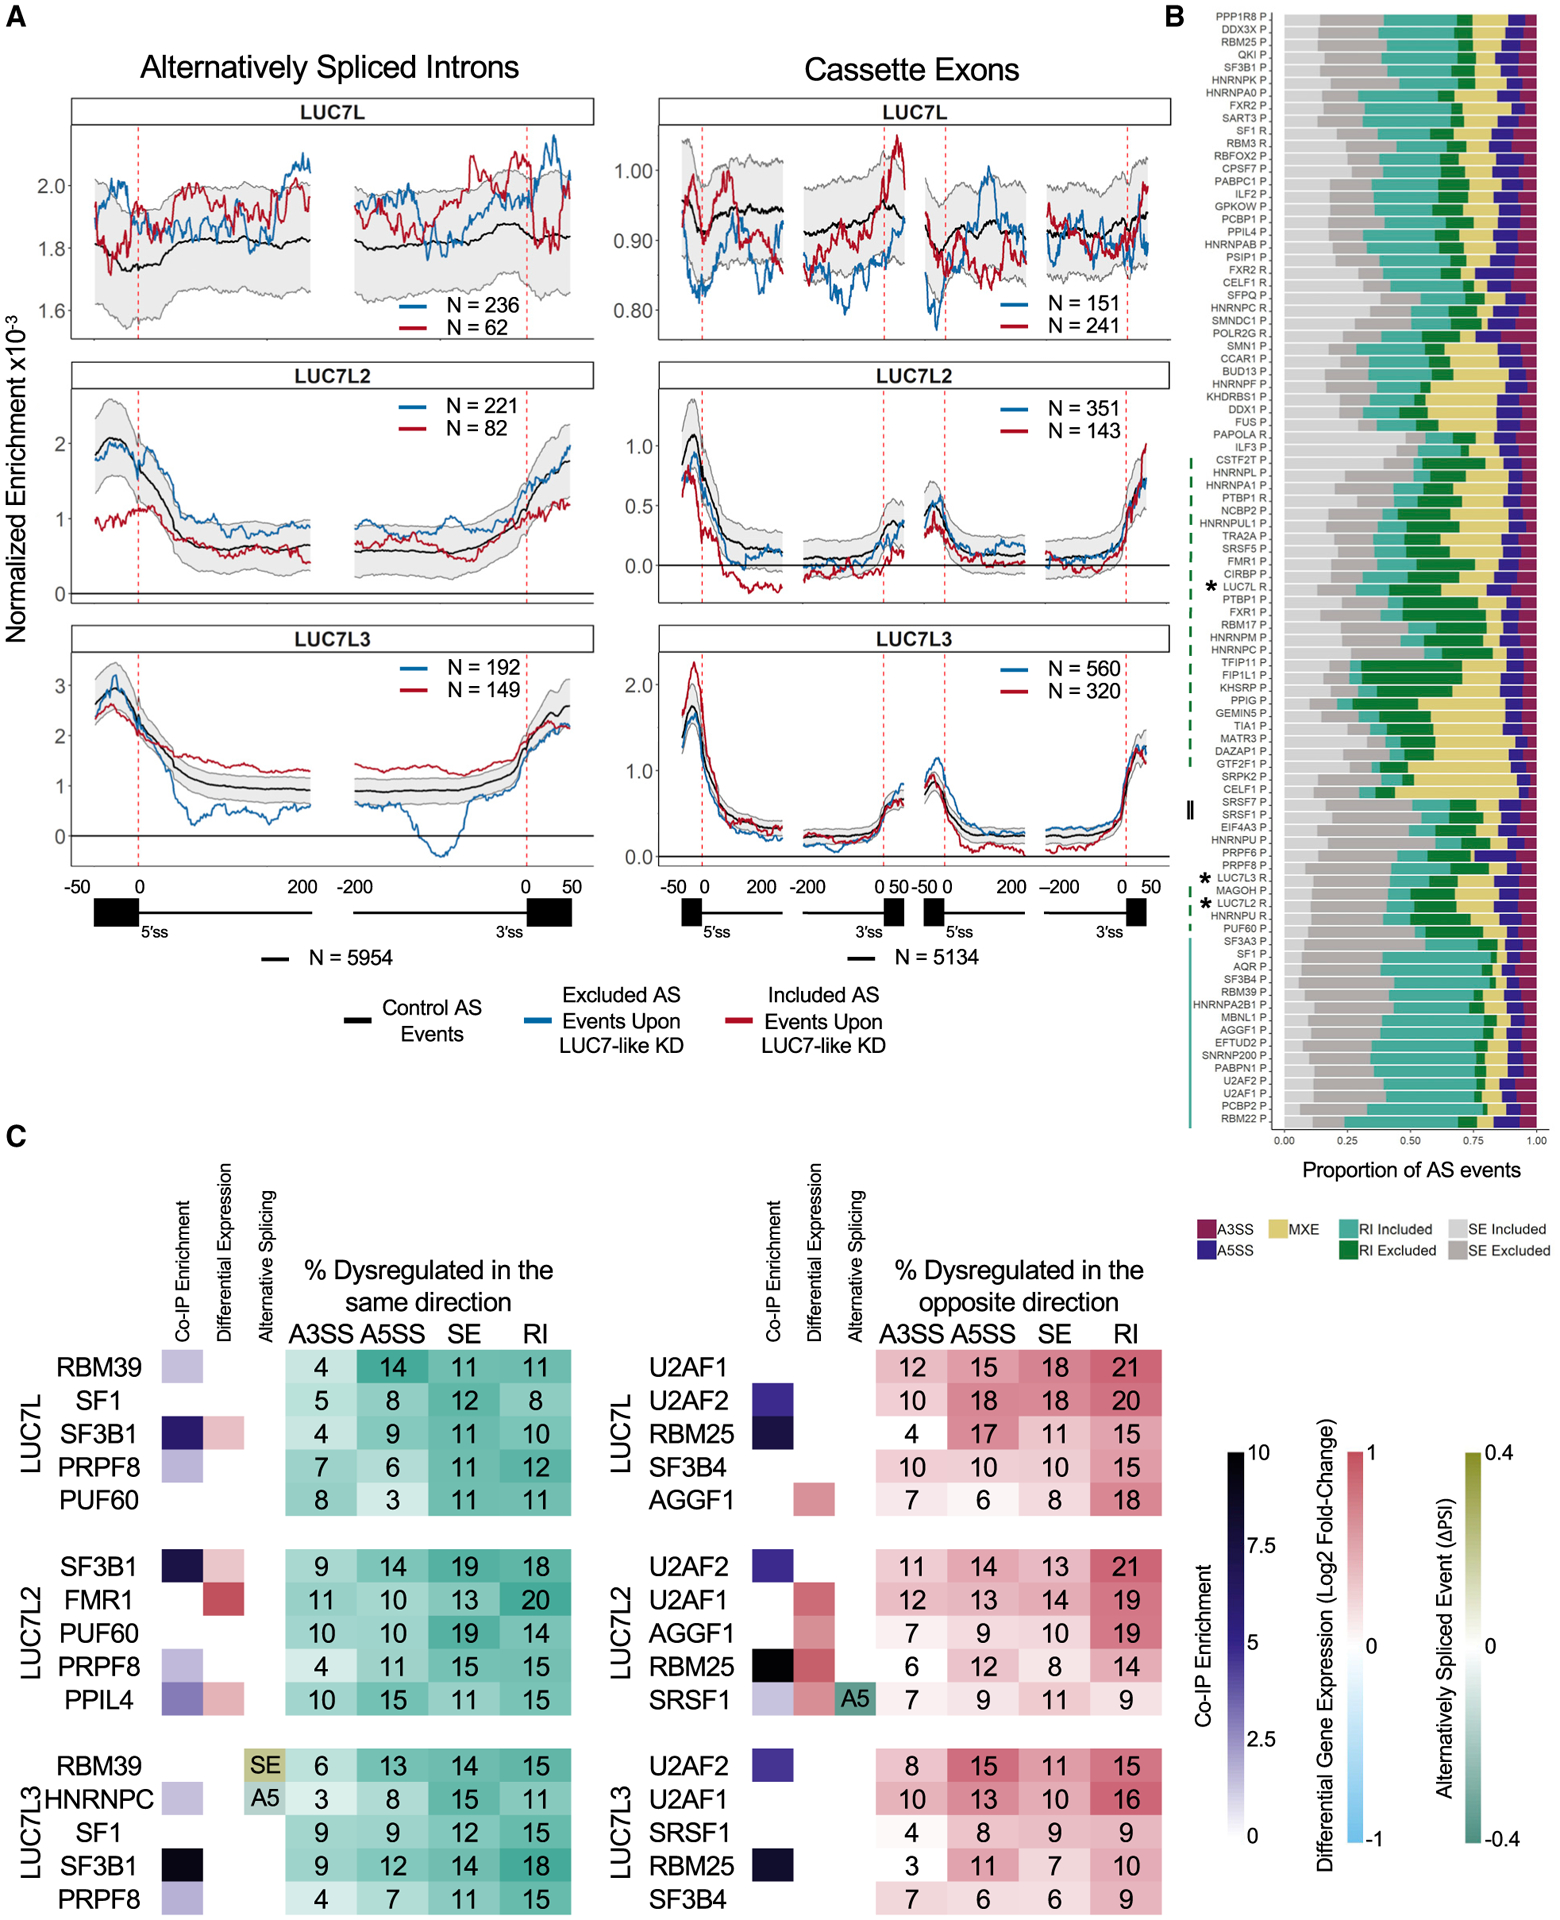
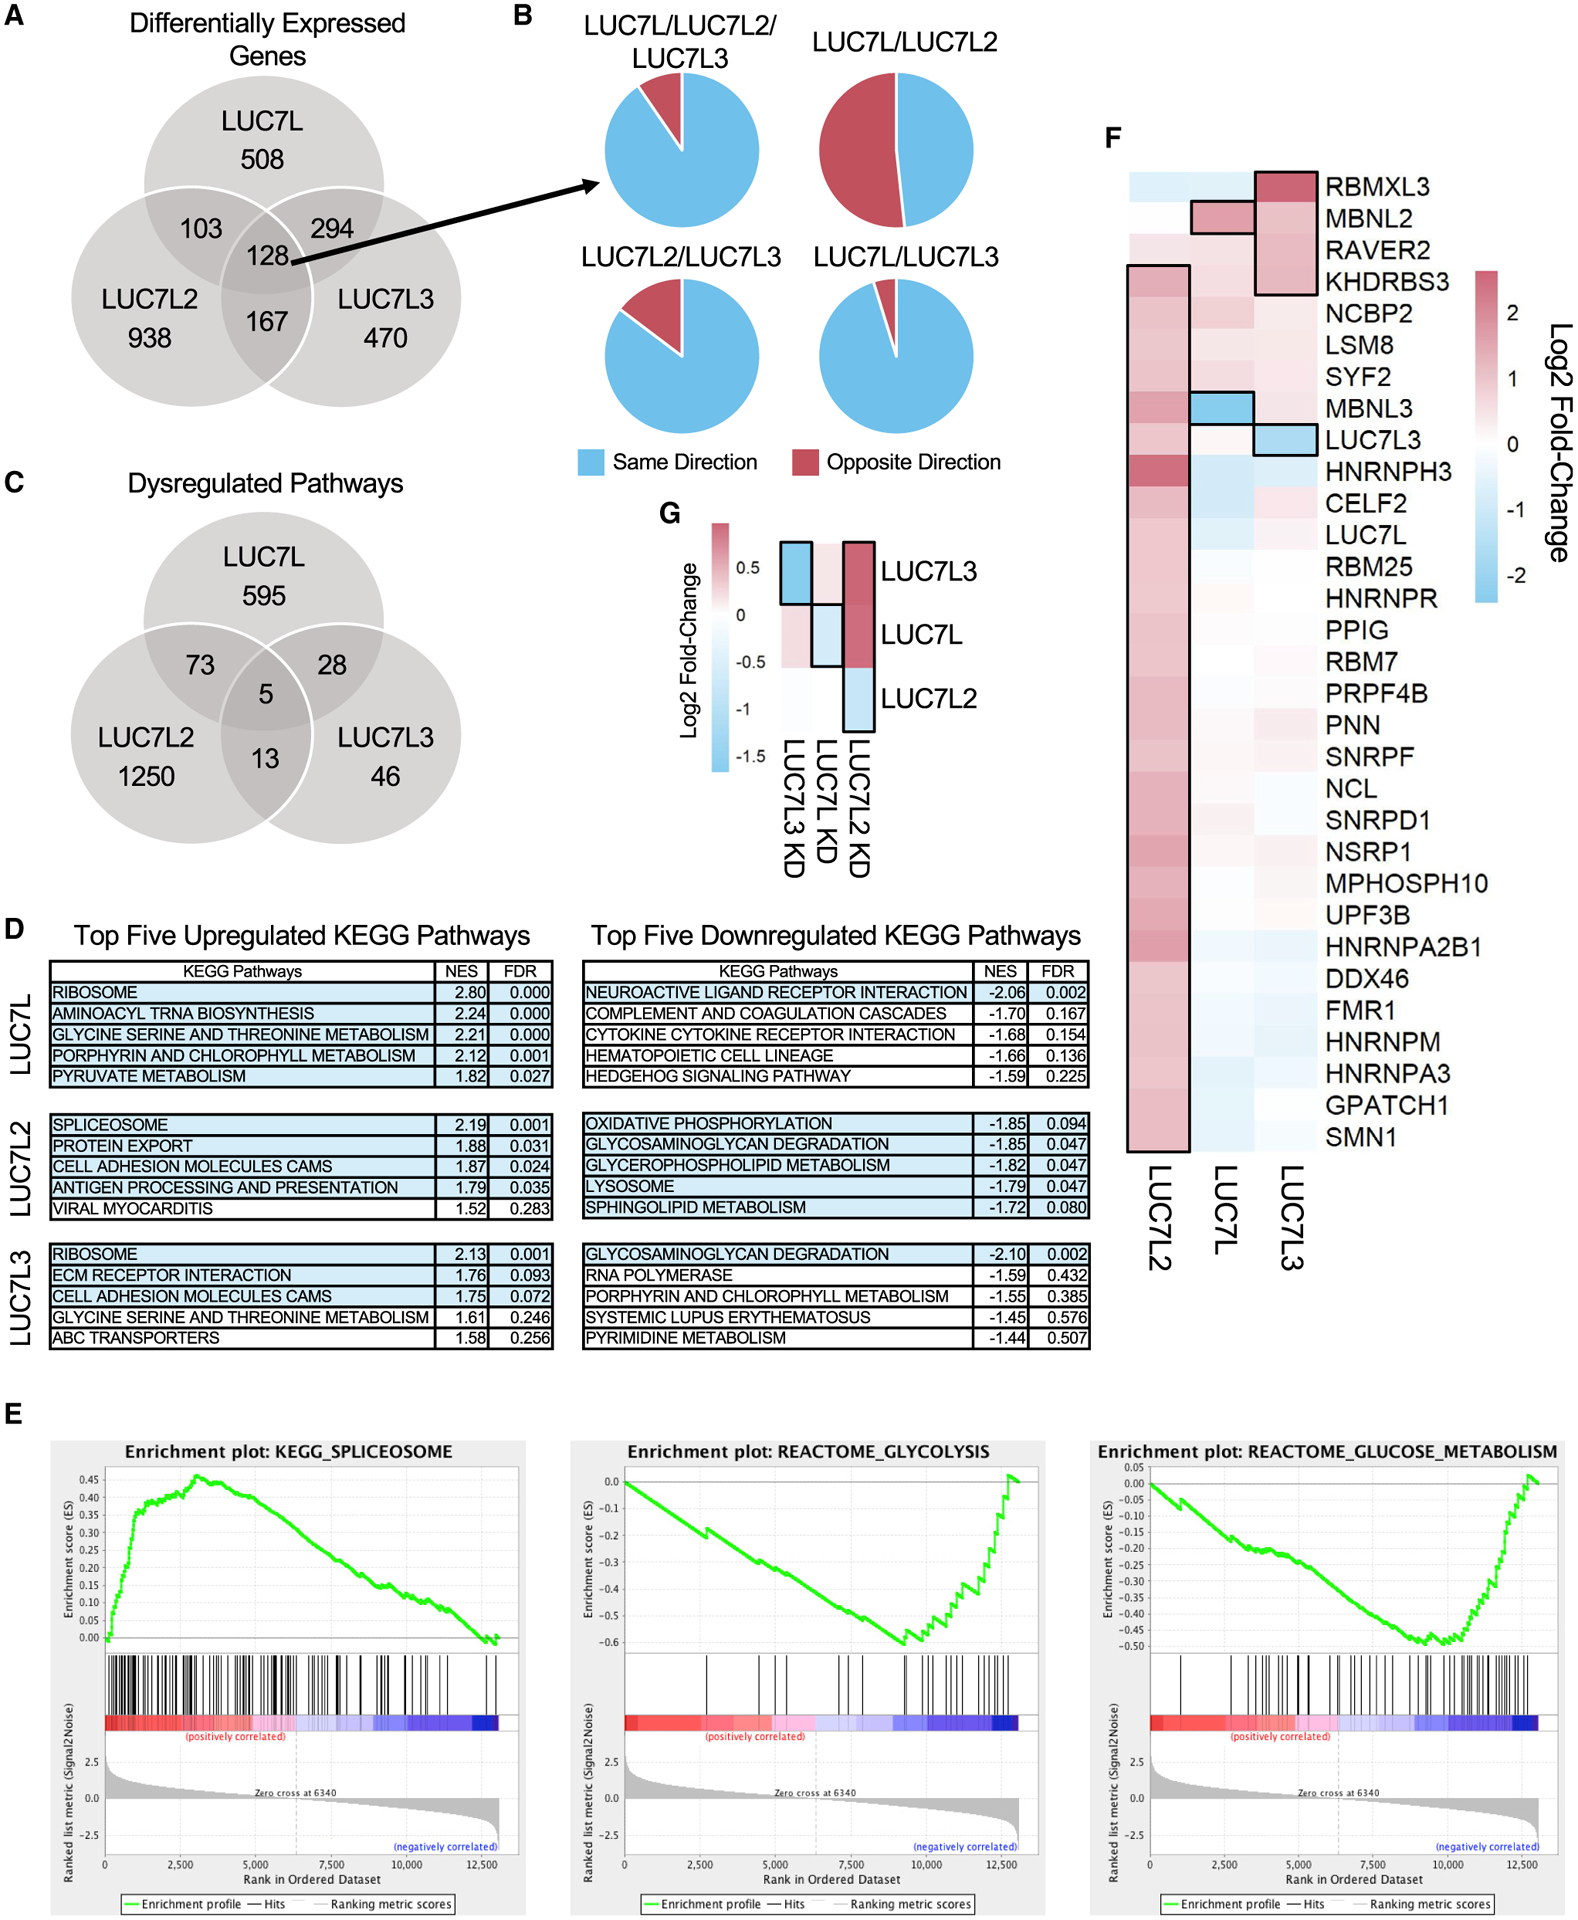
Vertebrates have evolved three paralogs, termed LUC7L, LUC7L2, and LUC7L3, of the essential yeast U1 small nuclear RNA (snRNA)-associated splicing factor Luc7p. We investigated the mechanistic and regulatory functions of these putative splicing factors, of which one (LUC7L2) is mutated or deleted in myeloid neoplasms. Protein interaction data show that all three proteins bind similar core but distinct regulatory splicing factors, probably mediated through their divergent arginine-serine-rich domains, which are not present in Luc7p. Knockdown of each factor reveals mostly unique sets of significantly dysregulated alternative splicing events dependent on their binding locations, which are largely non-overlapping. Notably, knockdown of LUC7L2 alone significantly upregulates the expression of multiple spliceosomal factors and downregulates glycolysis genes, possibly contributing to disease pathogenesis. RNA binding studies reveal that LUC7L2 and LUC7L3 crosslink to weak 5' splice sites and to the 5' end of U1 snRNA, establishing an evolutionarily conserved role in 5' splice site selection.

Keywords: 5′ splice site; LUC7L; LUC7L2; LUC7L3; alternative splicing; myeloid neoplasms.


Conflict of interest statement

Declaration of interests The authors declare no competing interests.

Figures

Figure 1.
Figure 1.. LUC7-like proteins interact with components of the spliceosome
(A) Protein domain structure of yeast Luc7p and the mammalian LUC7-like family (zinc finger 1 [ZnF1], coiled-coil domain, zinc finger 2 [ZnF2], arginine-glutamic acid rich domain [RE], arginine-serine-rich [RS] domain, and arginine-rich [R] domain) with chromosomal locations and phylogenetic tree showing amino acid conservation (adapted from Howell et al., 2007). (B) Conserved N-terminal α-helix and zinc finger domains of the LUC7-like family generated using CLUSTAL OMEGA 1.2.4 and ESPript 3 (Robert and Gouet, 2014). White letters with black background represent 100% conservation among the four proteins. Black letters with black frame represent conservation among three proteins. Asterisks depict essential cysteines and histidines of zinc fingers. Conserved α-helices are depicted above amino acid sequences and were determined by using the crystal structure of Luc7p from Plaschka et al. (2018). (C) LUC7-like genes homozygously CRISPR tagged with V5, FLAG, and HA in individual K562 clones shown by western blot (WB) using an anti-FLAG antibody. (D) Number of common and distinct co-immunoprecipitated (coIP’d) proteins that were ≥ 1.9-fold enriched in both replicates compared to WT K562 FLAG IP. (E) Top five significantly enriched KEGG pathways. (F) Number of common and distinct co-IP’d SFs that were ≥ 1.9-fold enriched in both replicates compared to WT K562 FLAG IP. (G) Fold enrichment of SFs ordered by their appearance in sub-spliceosomal complexes (left) as well as factors involved in alternative splicing (right). Blue line on left-hand side of core spliceosomal proteins depicts proteins found in the human B complex (Bertram et al., 2017; Zhan et al., 2018).
Figure 2.
Figure 2.. CLIP-seq assays reveal common and distinct RNA binding sites
(A) Proportion of significant CLIP peaks (log2 fold change [FC] ≥ 3; −log10 p ≥ 3; IDR ≤ 0.01) that overlap a transcriptomic feature. (B) ENCODE CLIP-seq experiments that have ≥ 10% CLIP peak overlap with at least one of the LUC7-like proteins. (C) The distribution of LUC7-like crosslink sites, normalized to input crosslink sites at each nucleotide of all annotated human splice junctions. Depicted are binding data for 100 nucleotides into the exon and 200 nucleotides into the intron downstream and upstream of the 5′SS and 3′SS, respectively. Values above the 0-y-axis threshold depicted by a bold black line have enriched binding over the input control. (D) U1 snRNA/5′SS hydrogen bonding score using the H-Bond tool (Freund et al., 2003). Control group contains all 5′SSs used in CLIP-seq mapping. LUC7L2 and LUC7L3 groups contain 5′SSs where there is an enriched crosslinking site at either position −1 or +1. A Wilcoxon rank-sum test was performed to compute p values. (E) Binding motifs enriched in the significant CLIP peaks identified in the LUC7-like seCLIP-seq and ENCODE CLIP-seq experiments.
Figure 3.
Figure 3.. LUC7-like family members bind snRNAs, including the 5′ ends of U1 and U11 snRNAs
(A) The number of CLIP reads (normalized for library size) enriched over the input control in counts per million (CPM) that map to each major spliceosomal snRNA. (B) The number of CLIP reads (normalized for library size) enriched over the input control in CPM that map to each minor spliceosomal snRNA. Significantly enriched minor snRNAs are boxed in black. snRNA enrichment was considered significant if the normalized minor snRNA was above the 90th percentile of the distribution in both experimental replicates for each RBP (see STAR Methods). (C) Secondary structures of U1 and U11 snRNAs with labeled domains (modified from Zhao et al., 2018). (D) Secondary structures of U2 snRNA (left) and U2/U6 snRNA interactions in the B complex of the spliceosome (right) with labeled domains (modified from Turunen et al., 2013; Zhao et al., 2018). (E) Single-nucleotide resolution crosslinking maps for the LUC7-like proteins on U1, U11, U2, and U6 snRNAs shown as the averaged replicate log2 fold change enrichment over the input control.
Figure 4.
Figure 4.. Decreased expression of LUC7-like proteins results in dysregulated AS
(A) Expression levels of LUC7L, LUC7L2, and LUC7L3 proteins in KD K562 cell lines and shGFP control shown as technical replicates. (B) Significantly dysregulated AS changes (|ΔPSI| ≥ 10%; q value ≤ 0.05) in KD cell lines compared to that of shGFP control. (C) Significantly dysregulated skipped exons [SEs] and retained introns [RIs] stratified by inclusion or exclusion (|ΔPSI| ≥ 10%; q value ≤ 0.05) in KD cell lines compared to those of the shGFP control. (D) Number of common and distinctly dysregulated AS events in the LUC7-like KD cell lines. (E) Distribution of AS type in the 52 commonly dysregulated AS events. (F) Strong mis-splicing events (|ΔPSI| ≥ 40%; q value ≤ 0.05) that were dysregulated in at least two LUC7-like KD cell lines. AS events are labeled by the gene that they occur in followed by type of AS event (alternative 3′SS [A3SS], alternative 5′SS [A5SS], mutually exclusive exons [MXEs], RIs, and SEs).
Figure 5.
Figure 5.. Comparison to the effects of KD of other splicing factors
(A) Binding profiles of the LUC7-like proteins on alternatively spliced RIs and cassette exons (included AS event of ≥ 5% ΔPSI; excluded AS event of ≤ −5% ΔPSI; q value ≤ 0.05). Black line indicates binding on alternatively spliced events (PSI of ≥ 0.05 and ≤ 0.95 in the shGFP control K562 cells) in control K562 cells with 90th and 10th percentiles in gray generated from 2,000 random samplings, blue line indicates binding on excluded AS events, and red line indicates binding on included AS events identified from their respective LUC7-like KD experiments. The numbers of AS events are depicted in each map. (B) Proportion of AS events dysregulated (|ΔPSI| ≥10%; q value ≤ 0.05) in each SF KD experiment and clustered by similarity using unsupervised hierarchical clustering. R indicates total RNA and P indicates polyA(+)-selected RNA used for library preparation. The LUC7-like experiments are depicted with an asterisk. Green dashed line depicts SF KD experiments with a large proportion of intron exclusion. Solid blue line indicates SF KD experiments with a large proportion of intron retention. Double-solid black line depicts SRSF1 and SRSF7. (C) The five SF KD experiments with the highest overlap of dysregulated AS events as the LUC7-like proteins stratified by direction. Dysregulated in the same direction (teal table) or the opposite direction (red table). Each row includes whether that gene/protein was an enriched immunoprecipitated protein, significantly differentially expressed (FDR ≤ 0.05), and/or contains a significant AS event specified (|ΔPSI| ≥ 10%; q value ≤ 0.05; SE = skipped exon, A5 = alternative 5′SS) in the LUC7-like epitope-tagged line or LUC7-like KD line depicted.
Figure 6.
Figure 6.. Differential gene expression patterns in the LUC7-like KDs
(A) Number of common and distinct significant differentially expressed genes in the LUC7-like KD cell lines (log2FC ≥ 1 or ≤ −1; FDR ≤ 0.05) compared to those of the shGFP control. (B) Direction and proportion of the commonly differentially expressed genes shared between two or more LUC7-like KD cell lines depicted in (A). (C) Overlap of significant GSEA pathways (FDR ≤ 0.05). (D) Top five upregulated and downregulated KEGG pathways by normalized enrichment score (NES) identified by GSEA. Rows highlighted in light blue depict significant pathways with an FDR ≤ 0.1. (E) GSEA enrichment plots of spliceosomal and glycolytic gene sets in the LUC7L2 KD that are significantly upregulated and downregulated, respectively. Genes are ranked by most upregulated in the LUC7L2 KD dataset at the far-left red bar to most downregulated at the far-right blue bar. The vertical black lines indicate where members of the gene set being tested fall on the ranked list. The green line is the running enrichment score that increases if a gene is identified in the ranked list that is in the gene set or decreases if it is not. (F) Significantly differentially expressed SFs are boxed with a black outline (log2FC ≥ 0.9 or ≤ −0.9; FDR ≤ 0.05) in the LUC7-like KD experiments and clustered by similarity using unsupervised hierarchical clustering. (G) Expression of the LUC7-like genes. Genes boxed with a black outline depict significantly differentially expressed genes in each specific LUC7-like KD (log2FC ≥ 0.6 or ≤ −0.6; FDR ≤ 0.05).

Comment in

References

    1. Agarwal R, Schwer B, and Shuman S (2016). Structure-function analysis and genetic interactions of the Luc7 subunit of the Saccharomyces cerevisiae U1 snRNP. RNA 22, 1302–1310. - PMC - PubMed
    1. Akerman M, Fregoso OI, Das S, Ruse C, Jensen MA, Pappin DJ, Zhang MQ, and Krainer AR (2015). Differential connectivity of splicing activators and repressors to the human spliceosome. Genome Biol. 16, 119. - PMC - PubMed
    1. Bertram K, Agafonov DE, Dybkov O, Haselbach D, Leelaram MN, Will CL, Urlaub H, Kastner B, Lührmann R, and Stark H (2017). Cryo-EM Structure of a Pre-catalytic Human Spliceosome Primed for Activation. Cell 170, 701–713. e11. - PubMed
    1. Bradley T, Cook ME, and Blanchette M (2015). SR proteins control a complex network of RNA-processing events. RNA 21, 75–92. - PMC - PubMed
    1. Bushnell B (2014). BBMap: a fast, accurate, splice-aware aligner (Ernest Orlando Lawrence Berkeley National Laboratory).

Publication types

MeSH terms