. 2021 Jun 1;33(6):1234-1247.e7.
doi: 10.1016/j.cmet.2021.03.024. Epub 2021 Apr 13.

A methionine-Mettl3-N6-methyladenosine axis promotes polycystic kidney disease

Affiliations

A methionine-Mettl3-N6-methyladenosine axis promotes polycystic kidney disease

Harini Ramalingam et al. Cell Metab. .

Abstract

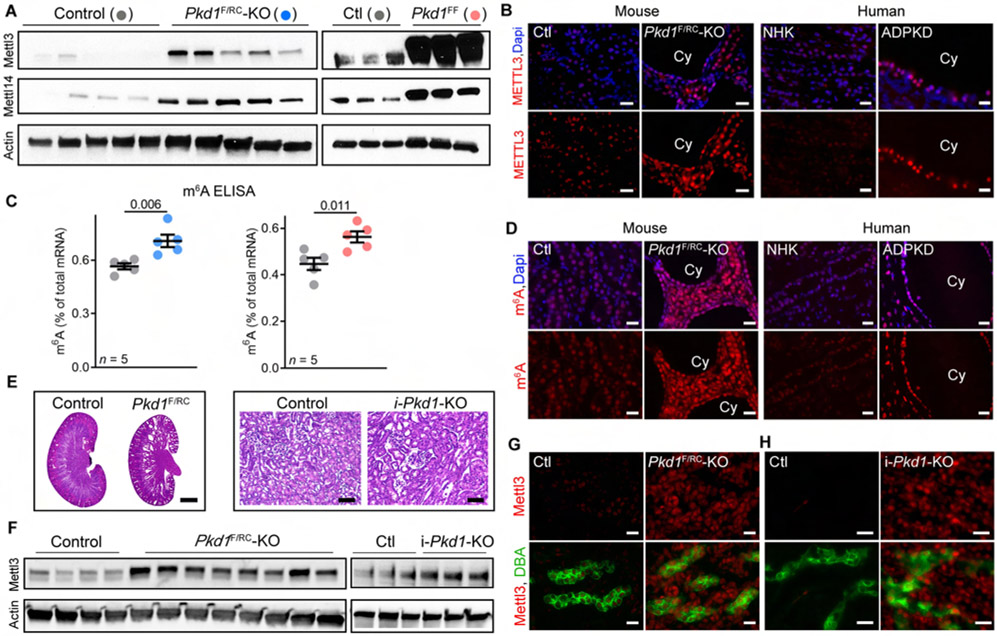
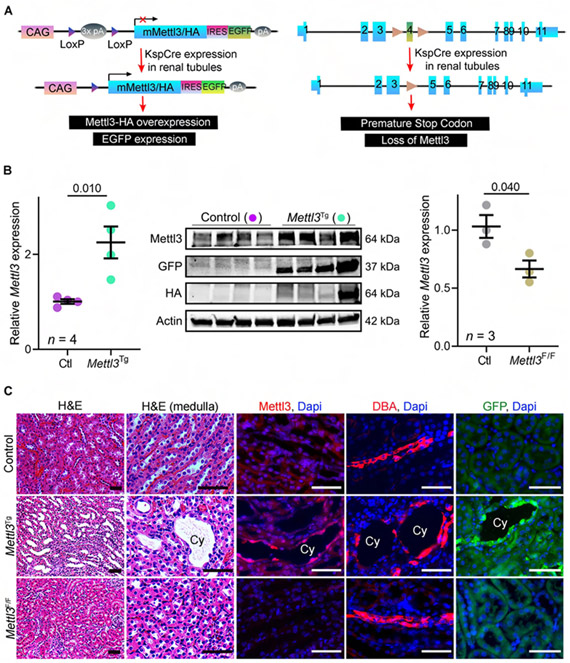
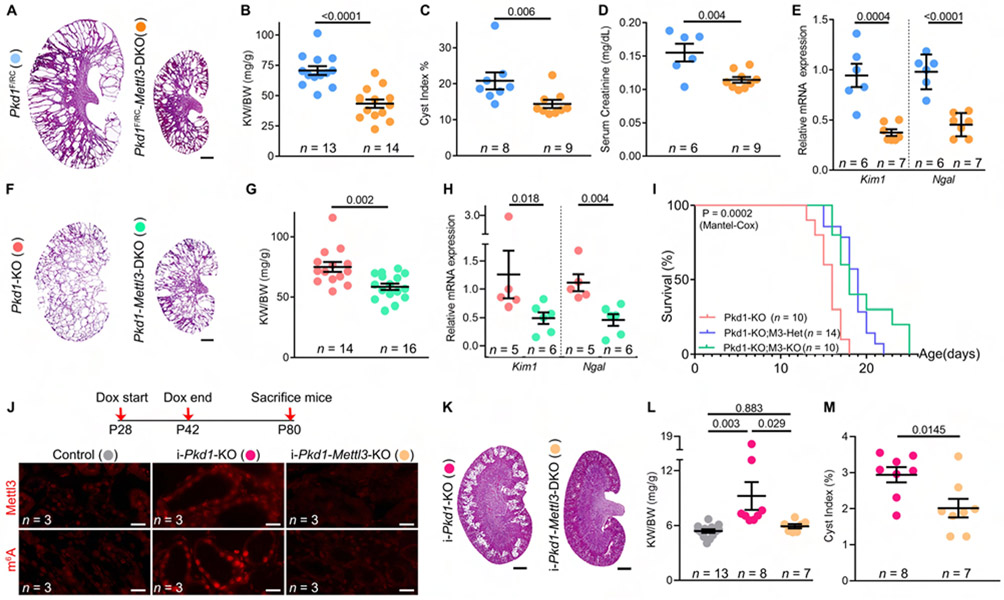
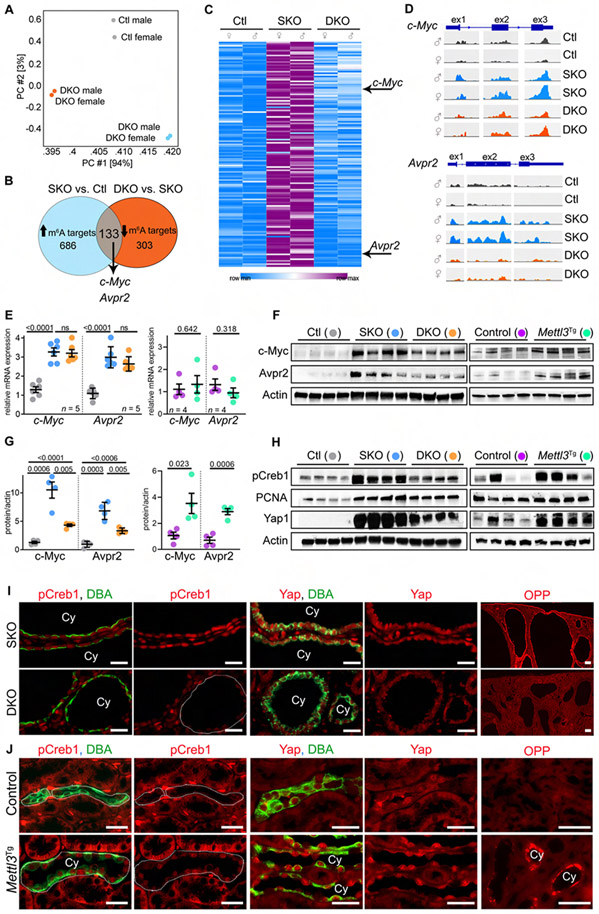
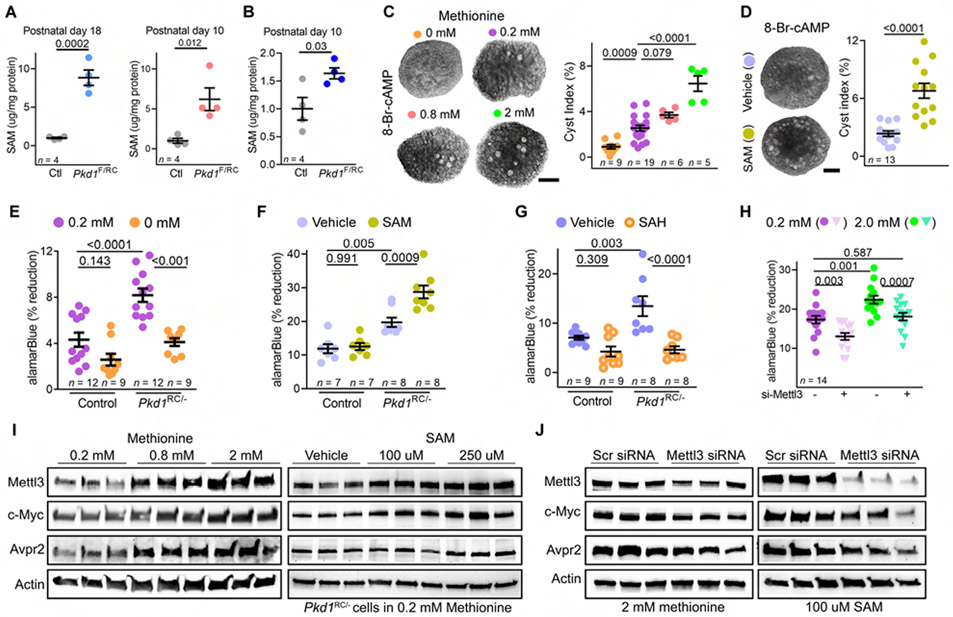
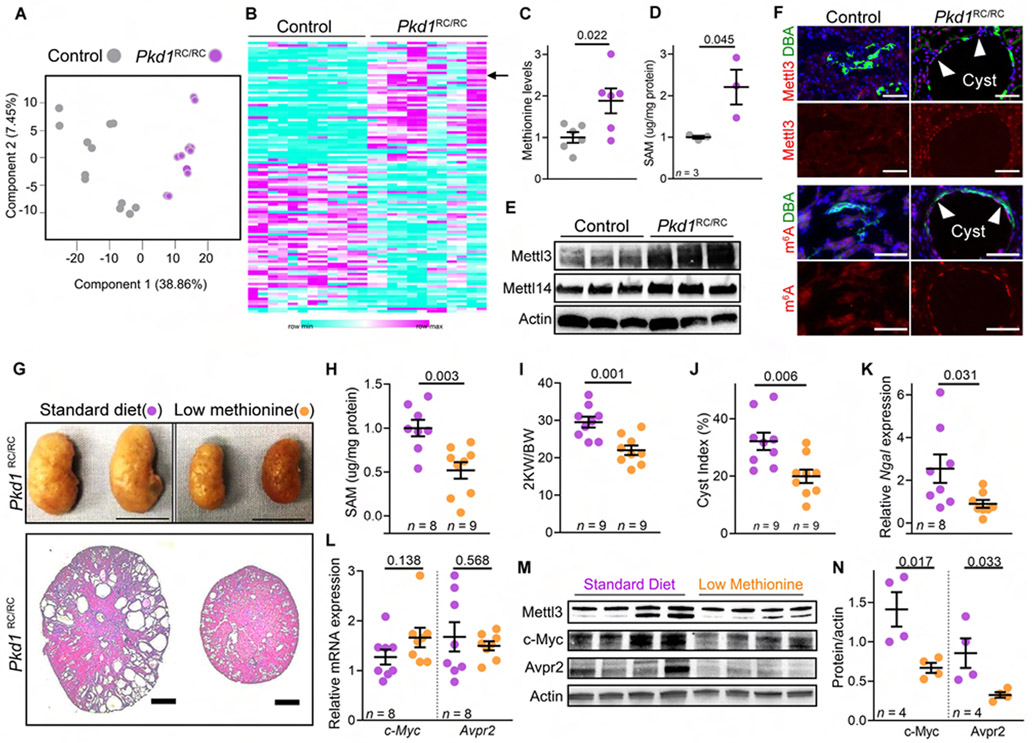
Autosomal dominant polycystic kidney disease (ADPKD) is a common monogenic disorder marked by numerous progressively enlarging kidney cysts. Mettl3, a methyltransferase that catalyzes the abundant N6-methyladenosine (m6A) RNA modification, is implicated in development, but its role in most diseases is unknown. Here, we show that Mettl3 and m6A levels are increased in mouse and human ADPKD samples and that kidney-specific transgenic Mettl3 expression produces tubular cysts. Conversely, Mettl3 deletion in three orthologous ADPKD mouse models slows cyst growth. Interestingly, methionine and S-adenosylmethionine (SAM) levels are also elevated in ADPKD models. Moreover, methionine and SAM induce Mettl3 expression and aggravate ex vivo cyst growth, whereas dietary methionine restriction attenuates mouse ADPKD. Finally, Mettl3 activates the cyst-promoting c-Myc and cAMP pathways through enhanced c-Myc and Avpr2 mRNA m6A modification and translation. Thus, Mettl3 promotes ADPKD and links methionine utilization to epitranscriptomic activation of proliferation and cyst growth.

Keywords: AVPR2; METTL3; N(6)-methyladenosine; S-adenosylmethionine; c-Myc; m6A mRNA methylation; mRNA translation; methionine; polycystic kidney disease.


Conflict of interest statement

Declaration of interests E.N.C has a patent on the use of PAPP-A inhibitors in ADPKD. E.N.C. is a consultant for TeneoBio, Calico, Mitobridge, and Cytokinetics. E.N.C. is on the advisory board of Eolo Pharma. E.N.C. owns stocks in Teneobio. Unrelated to this work, V.P. has patents involving the use of anti-miR-17 for the treatment of ADPKD (16/466,752 and 15/753,865). V.P. has previously held investment interests in Regulus Therapeutics and serves as a consultant for Otsuka Pharmaceuticals. V.P. lab has a sponsored research agreement with Regulus Therapeutics (unrelated to this work).

Figures

Figure 1:
Figure 1:. Mettl3-m6A pathway is upregulated in mouse and human PKD.
(A) Immunoblots showing Mettl3 and Mettl14 expression in P18 Ksp-Cre;Pkd1F/RC (Pkd1F/RC-KO) and P10 Ksp-Cre;Pkd1F/F (Pkd1F/F-KO) compared to their respective age-matched control kidneys. Beta-actin acts as the loading control. (B) Representative images of Mettl3 immunostaining in cysts (Cy) of P18 Pkd1F/RC-KO kidneys and control kidneys and in human ADPKD tissue and NHK. n = 10 images from 5 biological replicate mouse kidneys in mice and n = 8 images from 4 biological replicate human samples. (C) ELISA-measured mRNA m6A level in P18 Pkd1F/RC-KO (blue circles) and P10 Pkd1-KO (red circles) kidneys compared to their respective age-matched control kidneys (grey circles). Error bars, SEM; Student’s t-test. (D) Representative images of m6A immunostaining in P18 Pkd1F/RC-KO kidneys and control kidneys (n = 25 images from 5 biological replicate kidneys/group) and Human ADPKD tissue compared to NHK (n = 25 images from 4 biological replicate samples/group). (E) H&E-staining of kidney sections from P10 Pkd1F/RC-KO and P50 i-Pkd1-KO mice. Scale bars, 0.5 mm and 80 um. (F) Immunoblot showing Mettl3 expression in pre-cystic kidneys of P10 Pkd1F/RC-KO and P50 i-Pkd1-KO mice compared to kidneys of their respective age-matched control mice. Beta-actin acts as the loading control. (G-H) Representative images of Mettl3 (red) immunostaining and Dolichos Biflorus Agglutinin (DBA, a collecting duct marker) (green) labeling in kidney sections from P10 Pkd1F/RC-KO (G) and P50 i-Pkd1-KO (H) mice and their respective age-matched control mice (n = 6 images from 3 biological replicate kidneys/group). Scale bars, 20 um (B, D, G, and H); Error bars represent SEM; Student's t-test. See also Figure S1.
Figure 2:
Figure 2:. Kidney-specific transgenic Mettl3 expression produces renal tubule cysts.
(A) Schematic illustrating the genetic approach used for generating Mettl3Tg mice. Briefly, they harbor a transgene containing CAG promoter upstream of a loxP-STOP-loxP cassette and a cDNA sequence encoding HA-tagged Mettl3 and Ires-EGFP. Cre-mediated recombination deletes the STOP cassette leading to conditional Mettl3 and GFP expression. Mettl3F/F mice carry loxP sites flanking Mettl3 exon-4. Recombination results in the insertion of a premature stop codon and thus prevents Mettl3 expression. (B) qRT-PCR analysis showing Mettl3 expression in P60 Ksp-Cre;Mettl3Tg (green circles; Mettl3Tg) compared to Cre-negative;Mettl3Tg kidneys (purple circles; control). Immunoblot analysis showing Mettl3 and de novo GFP and HA expression in Mettl3Tg kidneys compared to control kidneys. Beta-Actin serves as the loading control. qRT-PCR analysis showing Mettl3 expression in P21 Ksp-Cre;Mettl3F/F (brown circles, Mettl3-KO) compared to control kidneys (grey circles). (C) Representative H&E-stained, Mettl3 immunostained, DBA labeled and GFP immunostained kidney sections from P60 control mice, P60 Mettl3Tg mice, and 20-week-old Mettl3-KO. n = 6 images from 3 biological replicate kidneys/group. Scale bars, 50 um; Error bars represent SEM; Student's t-test. See also Figure S2.
Figure 3:
Figure 3:. Mettl3 deletion alleviates cyst growth in three ADPKD models.
(A) H&E-stained kidney sections from P18 Pkd1F/RC-KO and Pkd1F/RC-Mettl3-DKO mice. (B-E) Kidney-weight-to-body-weight (KW/BW) ratio (B), cyst index (C), serum creatinine levels (D), and kidney Kim1 and Ngal mRNA expression (E) in P18 Pkd1F/RC-Mettl3-DKO mice (orange circles) compared to Pkd1F/RC-KO mice (blue circles). (F) H&E-stained kidney sections from P10 Pkd1-KO and Pkd1-Mettl3-DKO mice. (G-I) KW/BW ratio (G) ,kidney Kim1 and Ngal mRNA expression (H), and survival analysis (I) of P10 Pkd1-Mettl3-DKO mice (green circles/line) compared to Pkd1-KO mice (light pink circles/line). The blue line depicts survival of mice with kidney tubule-specific loss of one Mettl3 allele. (J) Schematic illustrating the approach used to generate i-Pkd1-KO and littermate i-Pkd1-Mettl3-DKO mice. Representative immunofluorescence images showing Mettl3 and m6A immunostaining in cysts of i-Pkd1-KO and i-Pkd1-Mettl3-DKO cysts (n = 8 images from 3 biological replicate kidneys/group). (K) H&E-stained kidney sections of P80 i-Pkd1-KO and i-Pkd1-Mettl3-DKO mice are shown. (L-M) KW/BW ratio (L) and cyst index (M) of P80 i-Pkd1-Mettl3-DKO mice (light orange circles) compared to i-Pkd1-KO mice (dark pink circles). Control mice (Ksp/rtTA; tetO-cre) are shown as grey circles. Scale bars, 0.5 mm (A, F, and K) and 20 um (J); Error bars represent SEM; Student's t-test (B, D, E, G, and M), Mann-Whitney (C, H), One-way ANOVA Tukey's multiple-comparisons test (F), and Mantel-Cox test (I). See also Figure S3.
Figure 4:
Figure 4:. Mettl3 deletion inhibits c-Myc and Avpr2-cAMP signaling in cystic kidneys.
(A) Principle component analysis of MeRIP-Seq data from P18 control (Ctl), Pkd1F/RC-KO (SKO), and Pkd1F/RC-Mettl3-KO (DKO) kidneys. (B) Comparative analysis (Ctl vs. SKO vs. DKO) used to identify Mettl3 mRNA targets in PKD. (C) Heatmap showing m6A levels on the 133 Mettl3 mRNA targets in P18 Ctl, SKO, and DKO kidneys. (D) IGV tracks showing m6A modification on c-Myc and Avpr2 mRNAs in Ctl, SKO, and DKO kidneys. (E) qRT-PCR analysis showing c-Myc and Avpr2 mRNA expression in P18 Ctl (grey circles), SKO (blue circles), and DKO (orange circles) kidneys or P60 control (purple circles) and Mettl3Tg (green circles) kidneys. (F) Immunoblot showing c-Myc and Avpr2 expression in P18 Ctl, SKO, and DKO kidneys, and P60 control and Mettl3Tg kidneys. Beta-actin acts as the loading control. (G) Quantification of immunoblots in (F) is shown. (H) Immunoblots showing pCreb1, PCNA, and Yap1 expression in P18 SKO and DKO kidneys, and P60 control and Mettl3Tg kidneys. Beta-actin acts as the loading control. (I) Representative images showing pCreb1 and Yap1 immunostaining and O-propargyl puromycin (OPP) incorporation in P18 SKO and DKO kidneys. (n = 8 images from 4 biological replicate kidneys/group). (J) Representative images showing pCreb1 and Yap1 immunostaining and OPP incorporation in P60 control (n = 10 images from 4 biological replicate kidneys) and Mettl3Tg kidneys (n = 11 images for pCreb1, 5 images for Yap1 and 15 images for OPP from 4 biological replicate kidneys). Scale bars: 50 um; Error bars represent SEM; Student's t-test and One-way ANOVA, Tukey's multiple-comparisons test (E, G). See also Figures S4 & S5 and Table S1.
Figure 5:
Figure 5:. Methionine upregulates Mettl3 and potentiates proliferation and ex-vivo cyst growth.
(A) ELISA-measured SAM levels in P18 Pkd1F/RC-KO and P10 Pkd1F/F-KO kidneys compared to their respective age-matched control kidneys. (B) ELISA-measured SAM levels in precystic P10 Pkd1F/RC-KO kidneys and control kidneys. (C) Images and cyst index quantification of E12.5 wild-type kidneys grown for four days in culture media containing 100 uM 8-Bromo-cAMP and 0, 0.2, 0.8, or 2-mM L-methionine. (D) Images and cyst index quantification of E12.5 wild-type kidneys grown for four days in culture media containing 100 uM 8-Bromo-cAMP that was supplemented with either 250 uM S-adenosyl methionine (SAM) or a control vehicle. (E) Proliferation rate of control (Pkd1RC/+) and Pkd1RC/− cells grown in normal (purple circles) or methionine-depleted (orange circles) culture media. (F) Proliferation rate of control and Pkd1RC/− cells grown in normal (vehicle) or SAM-supplemented culture media. (G) Proliferation rate of Pkd1RC/+ and Pkd1RC/− cells grown in normal (vehicle) or SAH-supplemented culture media. (H) Proliferation rate of Pkd1RC/− cells that were transfected with either control siRNA (circles) or Mettl3 siRNA (triangles) and then grown in normal (purple) or high methionine (2 mM, green) culture media. (I) Immunoblots showing Mettl3, c-Myc, and Avpr2 expression in Pkd1RC/− cells treated with rising concentration of methionine or SAM. Beta-actin acts as the loading control. (J) Immunoblots showing Mettl3, c-Myc and Avpr2 expression in Pkd1RC− cells that were transfected with control or Mettl3 siRNA and then grown in culture media containing 2 mM methionine or 100 uM SAM. Beta-actin acts as the loading control. Scale bars: 50 um; Error bars represent SEM; Student's t-test (A and B) and One-way ANOVA, Tukey's multiple-comparisons test (C-H). See also Figures S6.
Figure 6:
Figure 6:. Low methionine diet inhibits Mettl3 expression and ameliorates in vivo cyst growth.
(A) Principle component analysis of the kidney metabolomics data of 30-week-old control and Pkd1RC/RC mice. (B) Heatmap showing the 109 differentially present kidney metabolites in 30-week-old control and Pkd1RC/RC mice. Arrow indicates methionine. (C) Mass spectrometry-measured kidney methionine levels in 30-week-old control mice (n = 6, grey) and Pkd1RC/RC mice (n = 6, purple). (D) ELISA-measured SAM levels in the kidneys of 48-week-oldcontrol (n = 3, grey) and Pkd1RC/RC mice (n = 3, purple). (E) Immunoblot showing Mettl3 and Mettl14 expression in kidneys of 48-week-old control and Pkd1RC/RC mice. Beta-actin acts as the loading control. (F) Representative images showing Mettl3 and m6A immunostaining and DBA labeling in kidneys of 48-week-old control (n = 9 images from 4 biological replicate kidneys) and Pkd1RC/RC mice (n = 8 images from 4 biological replicate kidneys). Anti-Mettl3 or anti-m6A antibodies (red) and DBA (green). (G) Whole kidney images and H&E-stained kidney sections from 5-month-old Pkd1RC/RC mice on standard (purple circles) or methionine-restricted (MR) diet (orange circles). (H) ELISA-measured kidney SAM levels in 5-month-old Pkd1RC/RC mice on a standard or MR diet. (I-K) KW/BW ratio, cyst index, and kidney Ngal mRNA expression in 5-month-old Pkd1RC/RC mice on a standard or MR diet. (L) qRT-PCR analysis showing c-Myc and Avpr2 expression in kidneys of 5-month-old Pkd1RC/RC mice on standard or MR diet. (M-N) Immunoblot analysis showing Mettl3, c-Myc, and Avpr2 protein expression in kidneys from 5-month-old Pkd1RC/RC mice on standard or MR diet. Beta-actin acts as the loading control. Scale bars: (E) 100 uM (Mettl3 images) and 50 uM (m6A images), (F) 1 cm (top) and 2 mm (bottom); Error bars represent SEM; Student’s t-test (all graphs). See also Figure S6 & Table S2.

Comment in

References

    1. Aboudehen K, Noureddine L, Cobo-Stark P, Avdulov S, Farahani S, Gearhart MD, Bichet DG, Pontoglio M, Patel V, and Igarashi P (2017). Hepatocyte Nuclear Factor-1beta Regulates Urinary Concentration and Response to Hypertonicity. J Am Soc Nephrol 28, 2887–2900. - PMC - PubMed
    1. Albrecht LV, Bui MH, and De Robertis EM (2019). Canonical Wnt is inhibited by targeting one-carbon metabolism through methotrexate or methionine deprivation. Proc Natl Acad Sci U S A 116, 2987–2995. - PMC - PubMed
    1. Batista PJ, Molinie B, Wang J, Qu K, Zhang J, Li L, Bouley DM, Lujan E, Haddad B, Daneshvar K, et al. (2014). m(6)A RNA modification controls cell fate transition in mammalian embryonic stem cells. Cell Stem Cell 15, 707–719. - PMC - PubMed
    1. Bedi RK, Huang D, Eberle SA, Wiedmer L, Sledz P, and Caflisch A (2020). Small-Molecule Inhibitors of METTL3, the Major Human Epitranscriptomic Writer. ChemMedChem 15, 744–748. - PubMed
    1. Bokar JA, Shambaugh ME, Polayes D, Matera AG, and Rottman FM (1997). Purification and cDNA cloning of the AdoMet-binding subunit of the human mRNA (N6-adenosine)-methyltransferase. RNA 3, 1233–1247. - PMC - PubMed

Publication types