. 2021 May 3;56(9):1268-1282.e6.
doi: 10.1016/j.devcel.2021.03.024. Epub 2021 Apr 13.

The connectome of neural crest enhancers reveals regulatory features of signaling systems

Affiliations

The connectome of neural crest enhancers reveals regulatory features of signaling systems

Ana Paula Azambuja et al. Dev Cell. .

Abstract

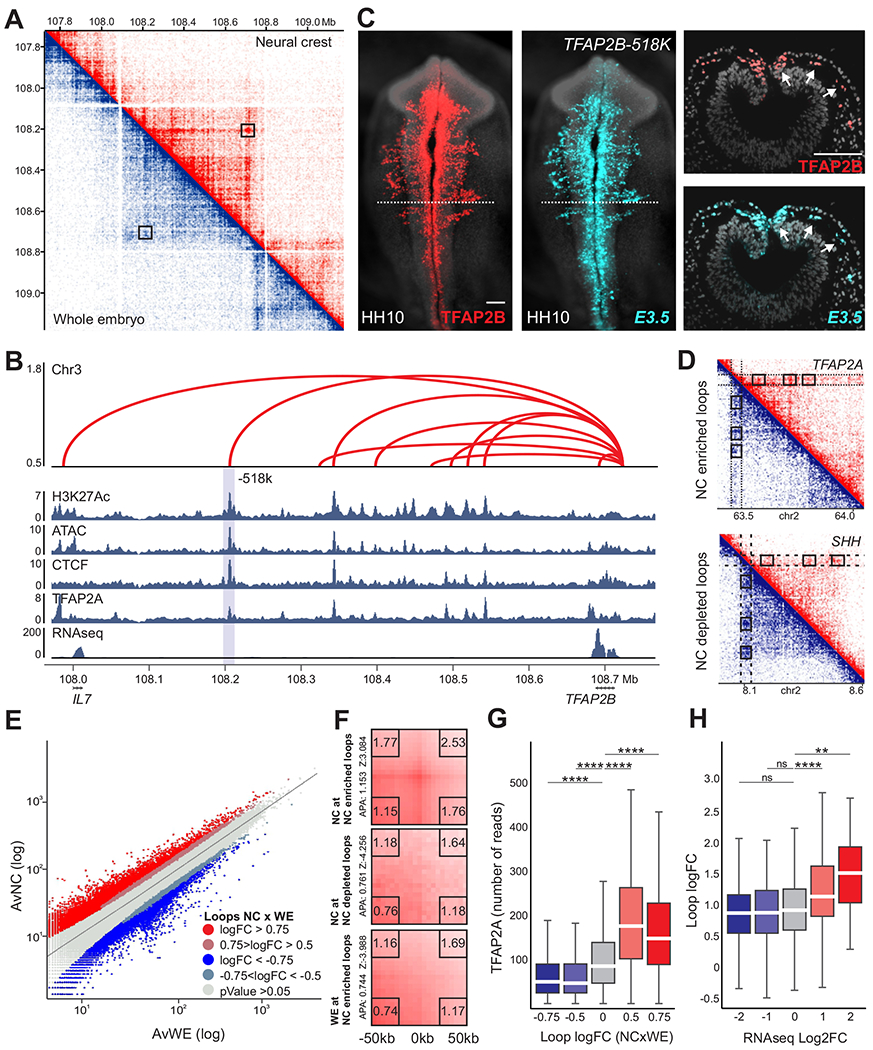
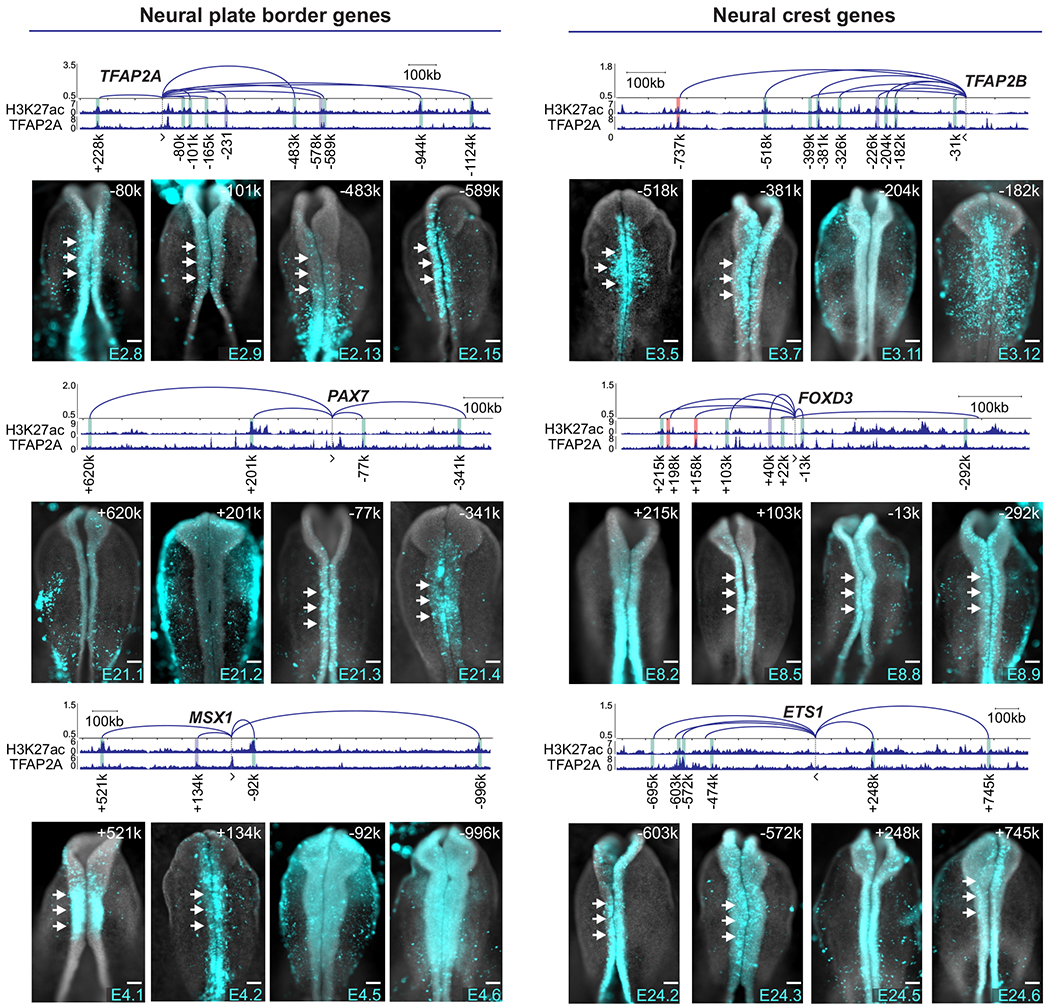
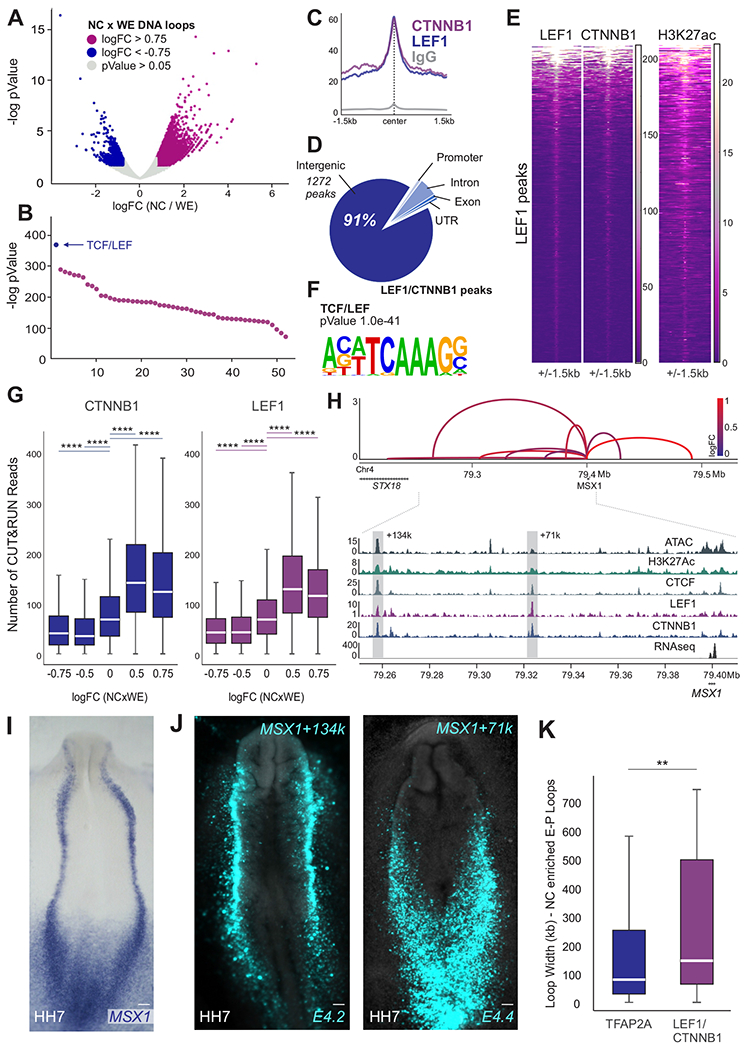
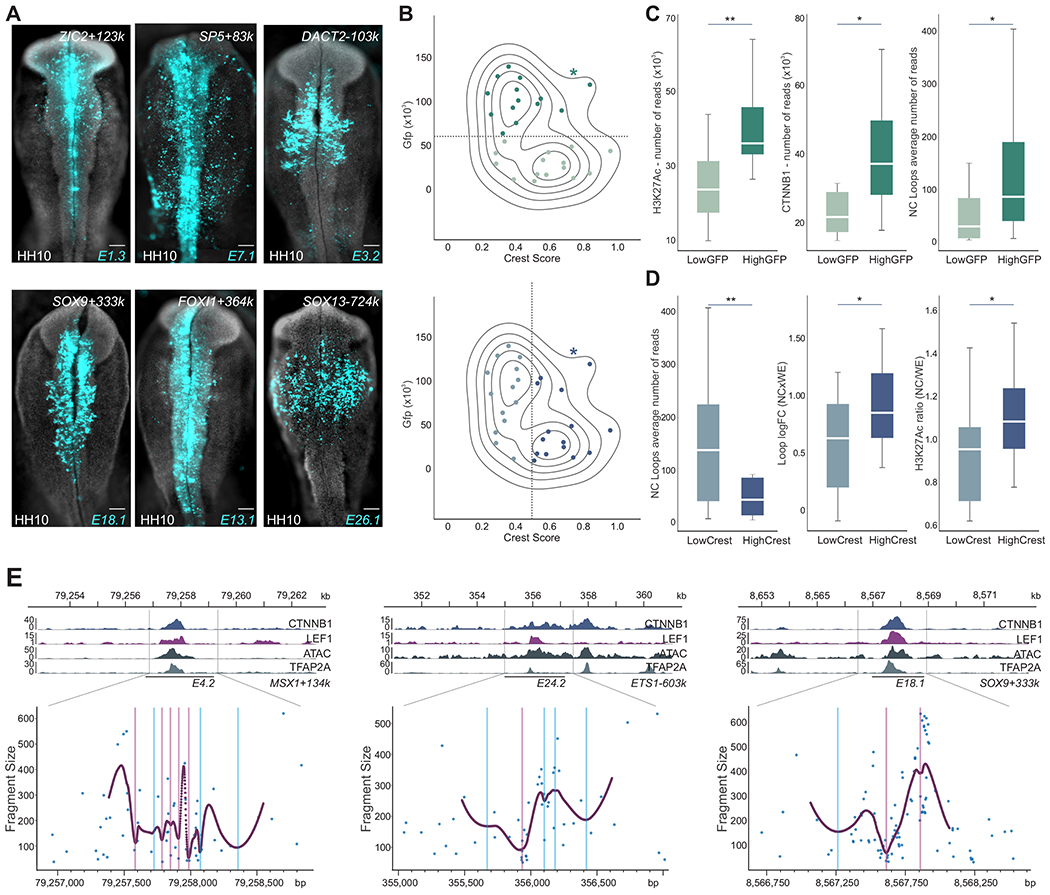
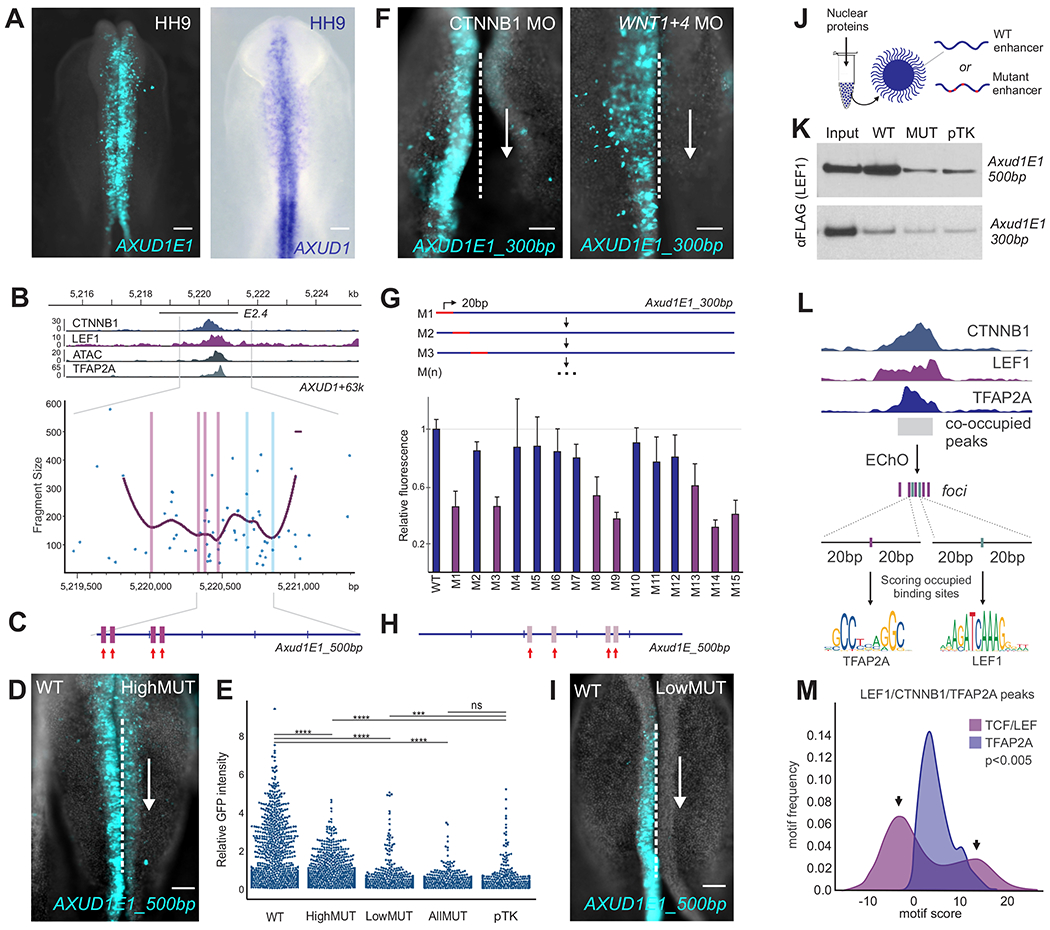
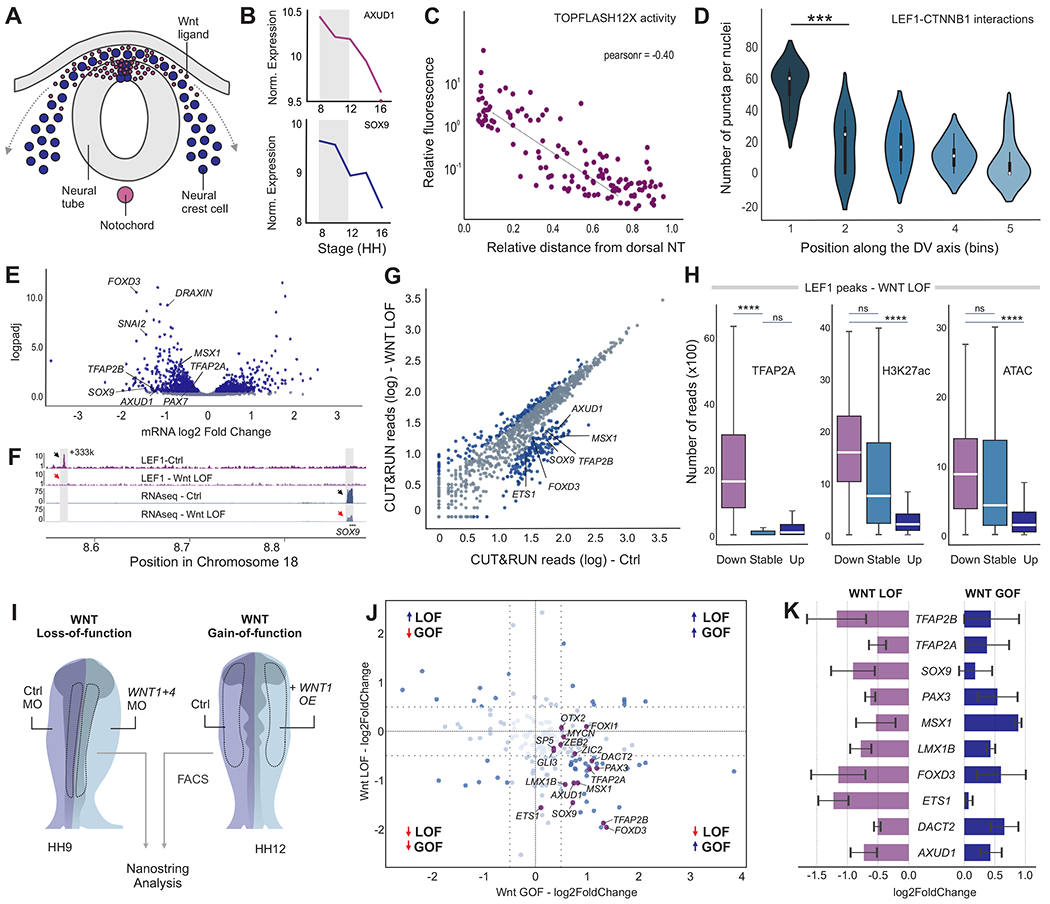
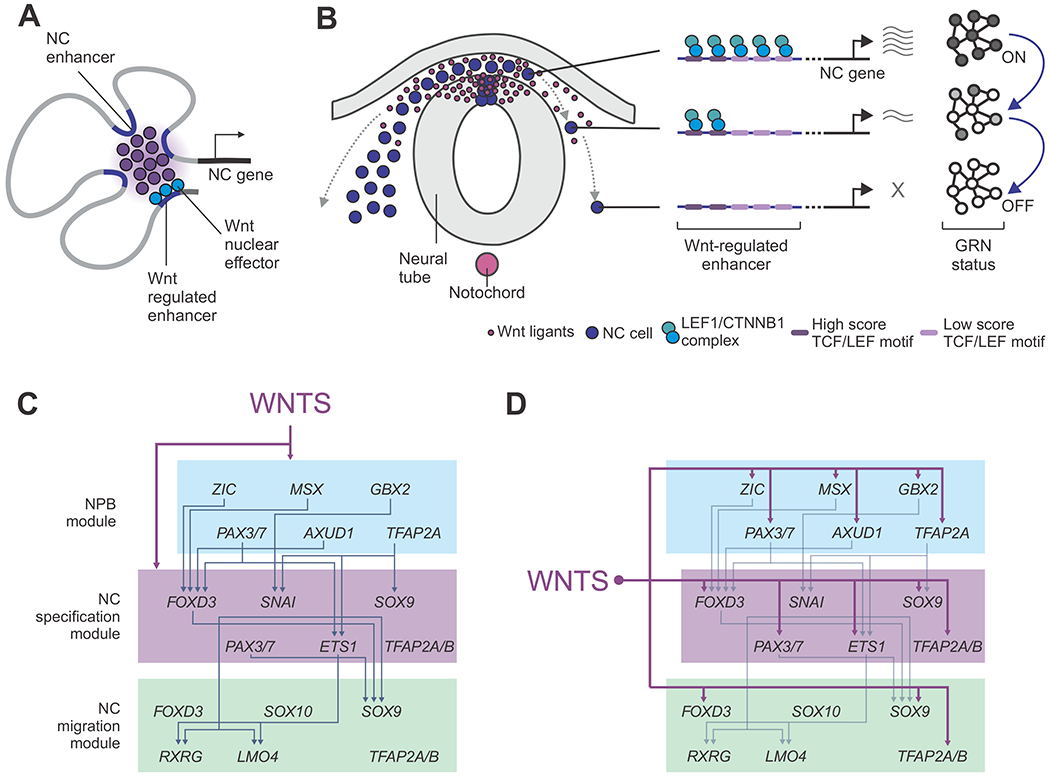
Cell fate commitment is controlled by cis-regulatory elements often located in remote regions of the genome. To examine the role of long-range DNA interactions in early development, we generated a high-resolution contact map of active enhancers in avian neural crest cells. This analysis uncovered a diverse repertoire of enhancers that are part of the gene regulatory network underlying specification. We found that neural crest identity is largely regulated by cis-regulatory elements that propagate signaling inputs to network components. These genomic sensors display a combination of optimal and suboptimal TCF/LEF-binding sites, which allow cells to respond to Wnt signaling in a position-dependent manner. We propose that, rather than acting as upstream activators, signaling systems feed into regulatory circuits in a hub-and-spoke architecture. These results shed light on the tridimensional organization of the neural crest genome and define how signaling systems provide progenitors with spatial cues that transform their molecular identity.

Keywords: Hi-ChIP; Wnt; Wnt signaling; enhancer connectome; enhancers; neural crest cells; nuclear architecture; signaling systems.


Conflict of interest statement

Declaration of interests The authors declare no competing interests.

Figures

Figure 1.
Figure 1.. Mapping of chromatin architecture reveals tissue-specific enhancer-promoter contacts in neural crest cells.
(A) HiChIP contact matrix depicting normalized contact frequencies for NC (red, top right) and Whole Embryo (blue, bottom left) at the TFAP2B TAD. A NC-enriched loop anchored at the TFAP2B promoter is highlighted (TFAP2B-518k). (B) Enhancer-promoter contacts, ATAC-seq, RNA-seq and CUT&RUN profiles for H3K27ac, CTCF, and TFAP2A at the TFAP2B locus. Y-axis represents loop logFC NC vs. WE. Gray bar highlights the loop indicated in (A). (C) Immunohistochemistry (whole-mount and transverse sections) for the endogenous TFAP2B protein (red) in a transgenic embryo. Reporter activity of E3.5 indicates robust and specific GFP (turquoise) expression at the migratory NC. (D) HiChIP matrices depicting normalized contact frequencies for NC (red, top right) and WE (blue, bottom left) in the TFAP2A and SHH loci. NC cells display enrichment (TFAP2A) or depletion (SHH) of putative enhancer-promoter contacts. Dotted boxes highlight the promoter regions of each gene. (E) Scatter plot displaying NC and whole embryo average counts of all valid chromatin contacts. NC-enriched loops are highlighted in red, while depleted contacts are highlighted in blue. (F) Aggregate Peak Analysis (APA) illustrates the significant differences of NC and WE samples. APA plots showing aggregated enrichment of NC and WE datasets across the enriched (logFC>0.75, pValue<0.05) and depleted (logFC<−0.75, pValue<0.05) contacts highlighted in (E). (G) TFAP2A CUT&RUN signal at the genomic regions corresponding to H3K27ac peaks at putative enhancer-promoter contacts binned by logFC (NCxWE). (H) Boxplot depicting putative enhancer-promoter loops logFC (NCxWE) at genes binned by RNA-seq signal enrichment in crest cells. Also see Figure S1. H3K27ac-HiChIP performed in 3 biological replicates. HH, Hamburger and Hamilton; NC, neural crest; WE, whole embryo; Mb, megabase. Scale bar, 100um. **p<0.01, ****p<0.0001.
Figure 2.
Figure 2.. Enrichment and frequency of interaction with promoters are strong predictors of enhancer activity.
Reporter assays in transgenic embryos show domains of activity of enhancers that interact with promoters of NC genes. y-axis in arc plot represents Z-scores calculated from the mean counts of NC HiChIP replicates. All NC-enriched contacts co-occupied by TFAP2A are presented. Enhancer-promoter contacts are identified by its loop width (+, upstream or −, downstream gene’s promoter). Vertical bars indicate regions tested in enhancer-reporter assays. Representative image of enhancer activity is displayed for four elements per gene (See also Figure S2A). Gray bars represent previously published enhancers, green novel distal elements with cranial activity at HH9-10 stages and red bars represent tested regions with no cranial activity at HH9-10 stages. White arrows indicate activity in the NC. Kb, kilobase. Scale bar, 100um.
Figure 3.
Figure 3.. Genome-wide mapping of nuclear effectors identifies direct targets of canonical Wnt signaling.
(A) Volcano plot depicting all enhancer-promoter contacts after quality control. Highlighted dots represent NC-enriched (logFC>0.75, pValue<0.05) and depleted (logFC<−0.75, pValue<0.05) contacts. (B) Transcription factor binding sites identified in NC-enriched vs. depleted putative enhancer-promoter contacts highlighted in (A). (C) CUT&RUN profiles showing binding of LEF1, CTNNB1 and normal rabbit IgG at LEF1 bound peaks. (D) Pie chart depicting genomic location of LEF1/CTNNB1 peaks. (E) Heatmaps displaying LEF1, CTNNB1 and H3K27ac CUT&RUN signal at LEF1 peaks. (F) Motif enrichment analysis shows enrichment for the TCF/LEF motif in regions co-occupied by LEF1/CTNNB1. (G) Boxplots displaying read counts of CTNNB1 and LEF1 CUT&RUN at HiChIP loops. (H) Arc plot depicting putative enhancer-promoter contacts, ATAC-seq, RNA-seq and CUT&RUN profiles for H3K27ac, CTCF, LEF1 and CTNNB1 at the MSX1 locus. y-axis of arc plot represents Z-scores calculated from the mean counts of NC HiChIP replicates. Arc color represents loop enrichment in NC (logFC NCxWE). Dotted boxes highlight enhancers E4.2 (loop MSX1+134k) and E4.4 (loop MSX1+71k). (I-J) Whole-mount in situ hybridization for MSX1 (I) and activity of enhancer regions E4.2 and E4.4 (J) shown via transient transgenesis. Enhancers E4.2 and E4.4 are active in the neural plate border. (K) Size (loop width) of the strongest TFAP2A or LEF1/CTNNB1-bound loop per gene. TFAP2A is a marker of active NC enhancers, and thus represents average NC loop size (Figure S1F) while LEF1/CTNNB1 bound loops display more distal contacts. Also see Figure S3. LEF1 and CTNNB1 CUT&RUN performed in 2 biological replicates. NC, neural crest; WE, whole embryo; HH, Hamburger and Hamilton; kb; kilobase; Mb, megabase. Scale bar, 100um. **p<0.01, ****p<0.0001.
Figure 4.
Figure 4.. Wnt signaling directly regulates a diverse set of active enhancers via multiple binding events.
(A) LEF1/CTNNB1-bound enhancers vary in strength (GFP intensity) and specificity. HH10 embryos displaying GFP expression driven by three highly active enhancers, E1.3 (ZIC2+123K), E7.1 (SP5+83k) and E3.2 (DACT2-103k) and three highly crest-specific enhancers, E18.1 (SOX9+333k), E13.1 (FOXI1+364k) and E26.1 (SOX13-724k). (B) Level plot displaying GFP intensity and specificity score of NC putative enhancers bound by LEF1/CTNNB1. Y-axis represents mean GFP intensity of analyzed cells. X-axis represents a specificity score defined by the ratio of double positive cells (Tfap2aE1:mChe+/GFP+) in the GFP-positive population. *depicts values for the Tfap2aE1 enhancer. (C) Boxplots showing H3K27ac and CTNNB1 binding, and loop reads for the two subpopulations of enhancers defined by the horizontal dotted line in (B). (D) Boxplots showing loop reads, logFC, and H3K27ac binding ratio (NC/WE) for the two subpopulations of enhancers defined by the vertical dotted line in (B). (E) Local minimal DNA protection by transcription factor DNA binding (EChO) reveals multiple LEF1 binding sites across Wnt-regulated enhancers. CTNNB1, LEF1, ATAC and TFAP2A signals and EChO profiles at the putative enhancers E4.2 (MSX1+134k), E24.2 (ETS1-603k) and E18.1 (SOX9+333k). Purple and blue lines represent foci positions associated with high and low score LEF1 motifs, respectively. Also see Figure S4. HH, Hamburger and Hamilton; NC, neural crest; WE, whole embryo; bp, base pair; kb, kilobase. Scale bar, 100um. *p<0.05, **p<0.01.
Figure 5.
Figure 5.. Nuclear effectors of Wnt signaling interact with neural crest enhancers via optimal and suboptimal binding sites.
(A) Transgenic avian embryo showing the activity of Axud1E1 (left) and AXUD1 expression (right). (B) Signal of CTNNB1, LEF1, ATAC and TFAP2A and EChO profiles at the AXUD1 enhancer E2.4 (AXUD1+63k, Axud1E1). Purple and blue lines represent foci positions associated with high and low scoring LEF1 motifs, respectively. (C) Location of high-scoring TCF/LEF binding sites in Axud1E1_500bp. The mutated motifs are identified by red arrows. (D) Whole-mount view of an embryo bilaterally electroporated with the wild-type (left) and mutant (HighMUT, right) constructs (n=6). (E) Scatter plots displaying flow cytometry analysis of enhancer-reporter assays of Axud1E1_500bp wild-type and mutant constructs (n=800 sorted cells). Y-axis represents the GFP/mCherry intensity ratio of HH9 cranial single cells. (F) Axud1E1_300bp displays Wnt signaling-dependent activity (n=5). Bilateral electroporation of CTNNB1 and WNT1/4 morpholinos disrupted activity of the enhancer. (G) Quantification of effect of individual 20bp mutations on Axud1E1_300bp (GFP/mCherry). Enhancer variants with enhancer activity below wild-type threshold are highlighted in purple (n=3, 2 ROIs per embryo). Error bar represents ± S.E.M. (H) Low-score TCF/LEF binding sites identified by mutation analysis. Mutated motifs are identified by red arrows. (I) Mutation of the four low-scoring TCF/LEF motifs at the Axud1E1_500bp (LowMUT) (H) strongly reduces enhancer activity. Whole-mount view of an embryo bilaterally electroporated with the wild-type (left) and mutant (right) constructs (n=4). (J) Diagram of enhancer pulldown assays. Biotinylated enhancers and mutant variants were conjugated with streptavidin beads and incubated with nuclear extracts. Protein-DNA interaction was assayed with western blots. (K) Enhancer pull down of Axud1E1_500bp, Axud1E1_300bp and its mutants variants (_AllMUT and _LowMUT, respectively) showing that suboptimal TCF/LEF binding sites are required for interaction of LEF1 with the Axud1E1 enhancer. (L) Schematic of foci motif analysis. EChO analysis was performed for LEF1 and TFAP2A foci definition at LEF1/CTNNB1/TFAP2A co-occupied regions. LEF1 and TFAP2A foci were extended to a 40bp window and submitted to FIMO for LEF1 and TFAP2A motif score evaluation. (M) Histograms displaying LEF1 (pink) and TFAP2A (purple) motif scores around LEF1 and TFAP2A foci, respectively, as described in (L). LEF1 motifs present a bimodal distribution (arrows) indicating higher variability in binding site sequences. Also see Figure S5. bp, base pair; HH, Hamburger and Hamilton; MO, morpholino. Scale bar, 100um. ***p<0.001, ****p<0.0001.
Figure 6.
Figure 6.. Wnt signaling controls the neural crest gene regulatory network in a position-dependent manner.
(A) Schematic representation of a transverse section of an avian embryo, depicting the migration of NC cells from the Wnt stem cell niche in the dorsal neural tube. (B) Expression levels of Wnt target genes AXUD1 and SOX9 decrease during NC migration. (C-D) Decrease in activity of the Wnt signaling pathway during NC migration. Scatter plot of Wnt reporter fluorescence in NC cells relative to their distance from the dorsal neural tube (C) (n=134 Tfap2AE1:mChe+ cells.) Violin plots of LEF1:CTNNB1 PLA puncta per NC cell across five different dorsal-ventral regions (D) (n=4 embryos). (E) Volcano plot depicting NC transcripts measured by RNA-seq after Wnt loss-of-function (n=3). Blue dots represent transcripts with pValue<0.05. (F) LEF1 signal and RNA-seq profiles for control and Wnt loss-of-function conditions at the SOX9 locus. Shaded box highlights the putative enhancer E18.1 tested in Figure 4B. (G) Scatter plot displaying LEF1 binding at LEF1/CTNNB1-associated peaks in control and upon Wnt knockdown (n=2). Blue dots represent peaks with pValue<0.05 between the two datasets. (H) Box plots depicting TFAP2A, H3K27ac and ATAC-seq signals at peaks that lose, gain or display stable association with LEF1 upon Wnt knockdown. (I) Diagram showing the electroporation scheme for assessing spatial-specific effect of Wnt signaling manipulation. Control and WNT1/4 morpholinos were bilaterally electroporated at HH4 and NC cells were microdissected from embryos at the specification stage (n=3). Conversely, sustained Wnt function was obtained from embryos electroporated with a WNT1 overexpression vector. Late NC migratory cells were FACS-sorted (Tfap2aE1:mChe+) from HH12 embryos (n=3). (J) Representative scatter plot displaying log2FoldChange in a Wnt loss-of-function (y-axis) and a Wnt gain-of-function (x-axis) replicate. Genes contacting Wnt putative enhancers tested in Figure 4 are highlighted (K). (K) Bar plot showing the effect of Wnt loss-of and gain-of-function on expression of GRN components. Also see Figure S6. NT, neural tube; DV dorsal-ventral; LOF, loss-of-function; GOF, gain-of-function; MO, morpholino; OE, overexpression; HH, Hamburger and Hamilton; Mb, megabase. Error bar represents ± S.E.M.
Figure 7.
Figure 7.. Model for position-dependent regulation of the neural crest identity by canonical Wnt signaling.
(A) NC genes are regulated by multiple enhancers that contact promoters in a tissue-specific manner. Essential components of the NC GRN are regulated by at least one Wnt-associated element. (B) Wnt-associated elements act as genomic sensors that respond to environmental inputs. These enhancers possess multiple TCF/LEF binding motifs that allow response to levels of signaling. As cells migrate away from the stem cell niche, these elements lose their interactions with nuclear effectors, resulting in loss of gene expression and inactivation of the GRN. (C-D) Models for the role of Wnt signaling in the control of the NC GRN. Instead of acting as an upstream regulator (C), our results indicate canonical Wnts simultaneously control multiple components the GRN in a hub-and-spoke architecture (D).

References

    1. AMANO T, SAGAI T, TANABE H, MIZUSHINA Y, NAKAZAWA H & SHIROISHI T 2009. Chromosomal dynamics at the Shh locus: limb bud-specific differential regulation of competence and active transcription. Dev Cell, 16, 47–57. - PubMed
    1. AZAMBUJA AP & SIMOES-COSTA M 2021. A regulatory sub-circuit downstream of Wnt signaling controls developmental transitions in neural crest formation. PLoS Genet, 17, e1009296. - PMC - PubMed
    1. BAREMBAUM M & BRONNER ME 2013. Identification and dissection of a key enhancer mediating cranial neural crest specific expression of transcription factor, Ets-1. Dev Biol. - PMC - PubMed
    1. BARON R & KNEISSEL M 2013. WNT signaling in bone homeostasis and disease: from human mutations to treatments. Nat Med, 19, 179–92. - PubMed
    1. BETANCUR P, BRONNER-FRASER M & SAUKA-SPENGLER T 2010. Genomic code for Sox10 activation reveals a key regulatory enhancer for cranial neural crest. Proc Natl Acad Sci U S A, 107, 3570–5. - PMC - PubMed

Publication types