. 2021 May 27;184(11):2939-2954.e9.
doi: 10.1016/j.cell.2021.03.055. Epub 2021 Mar 30.

Antibody evasion by the P.1 strain of SARS-CoV-2

Affiliations

Antibody evasion by the P.1 strain of SARS-CoV-2

Wanwisa Dejnirattisai et al. Cell. .

Abstract

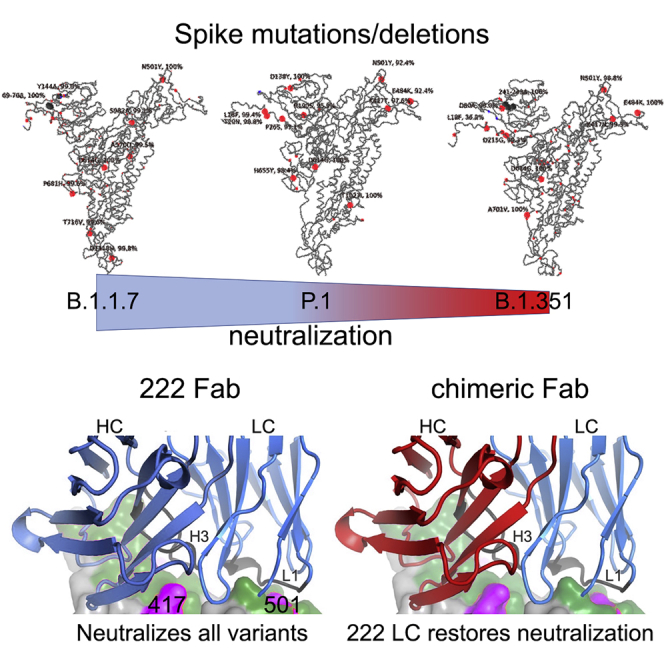
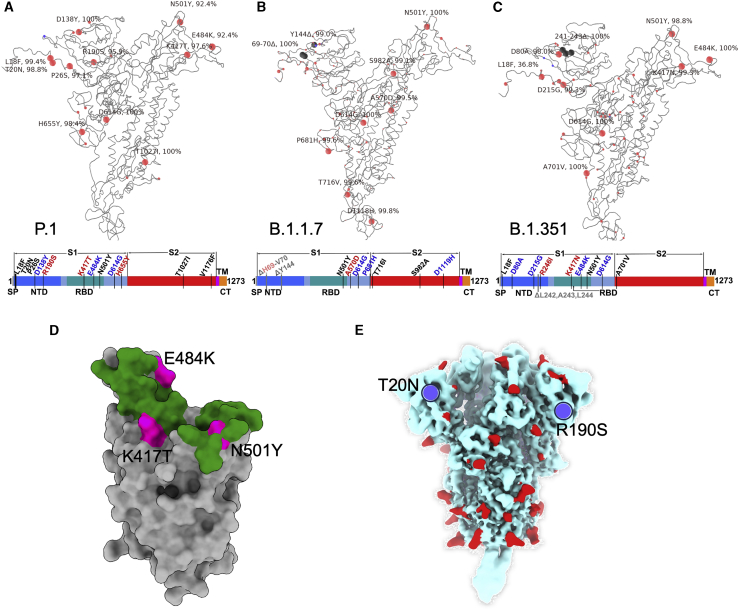
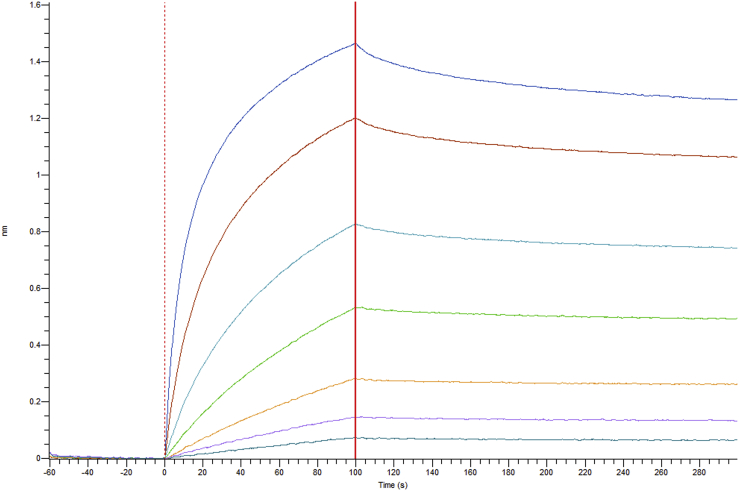
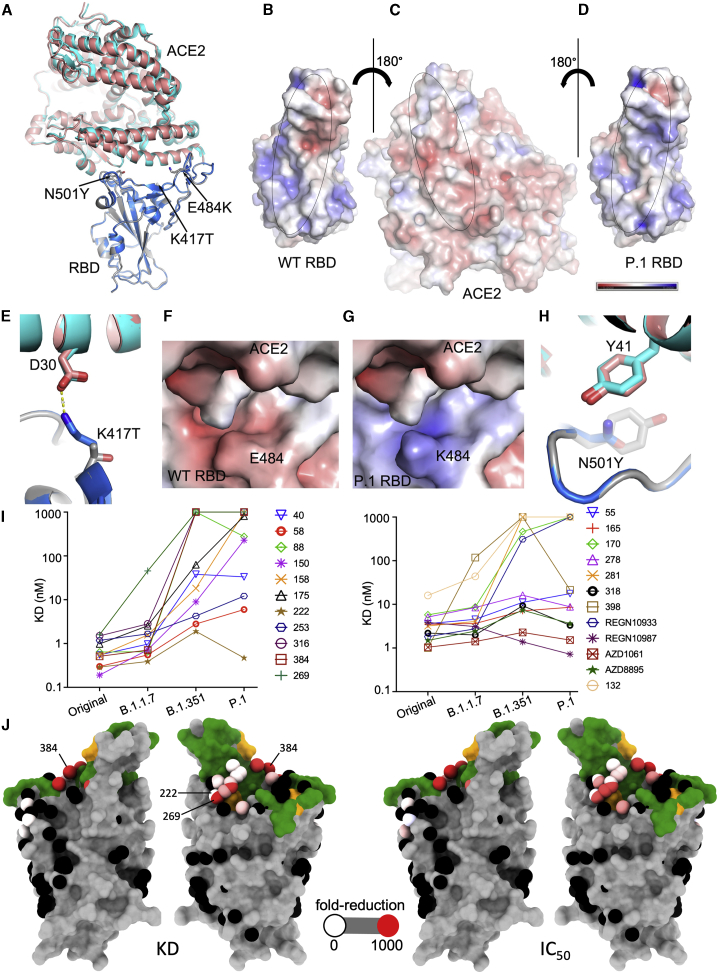
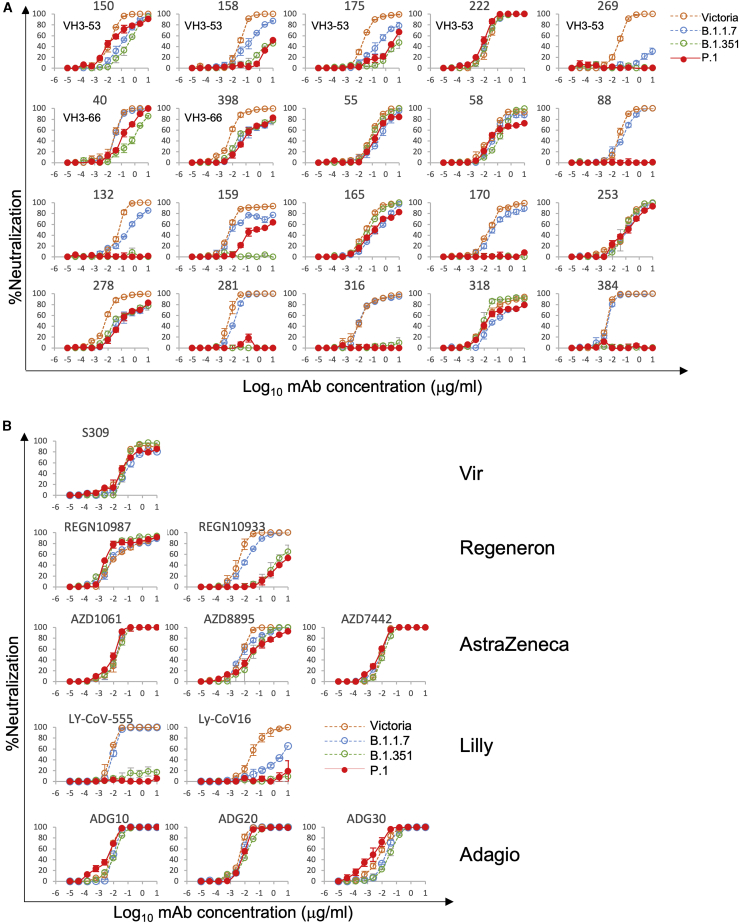
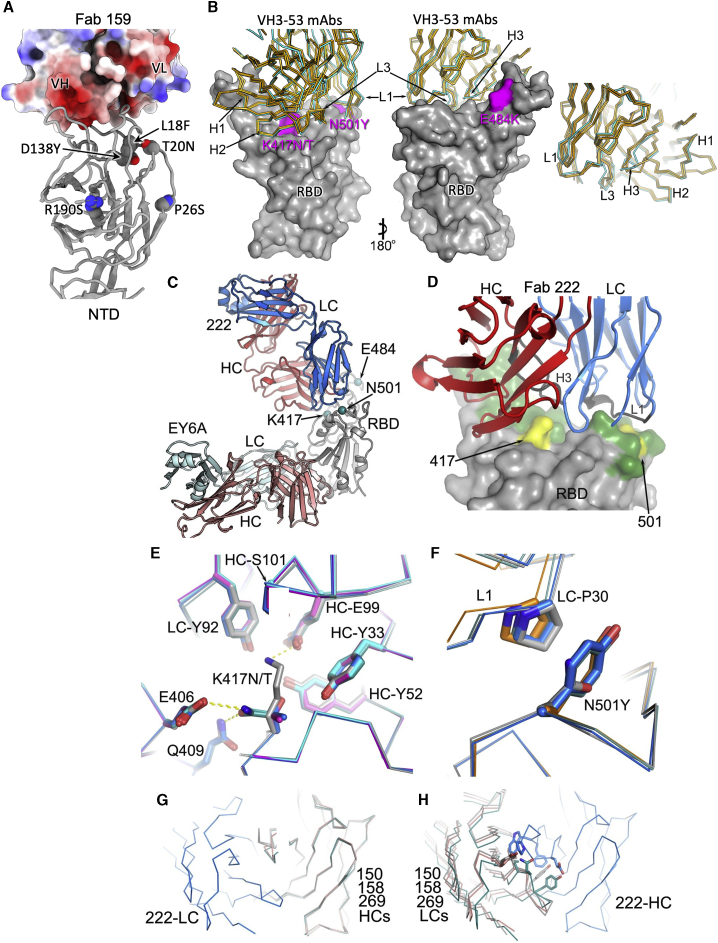
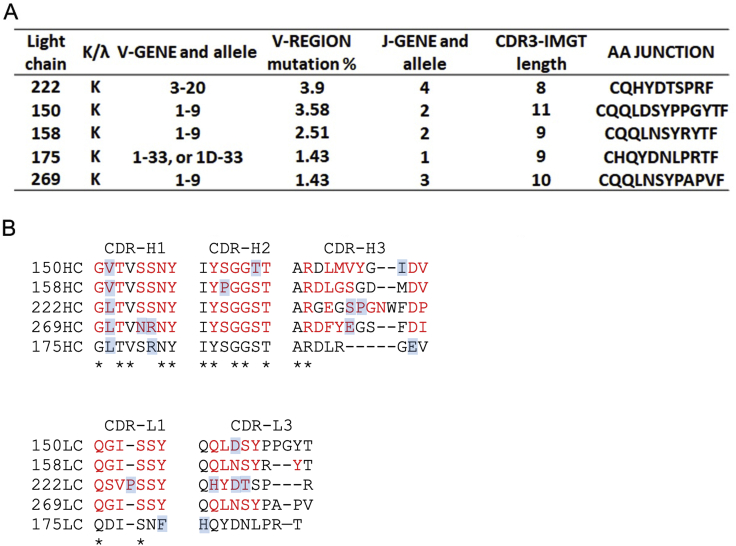
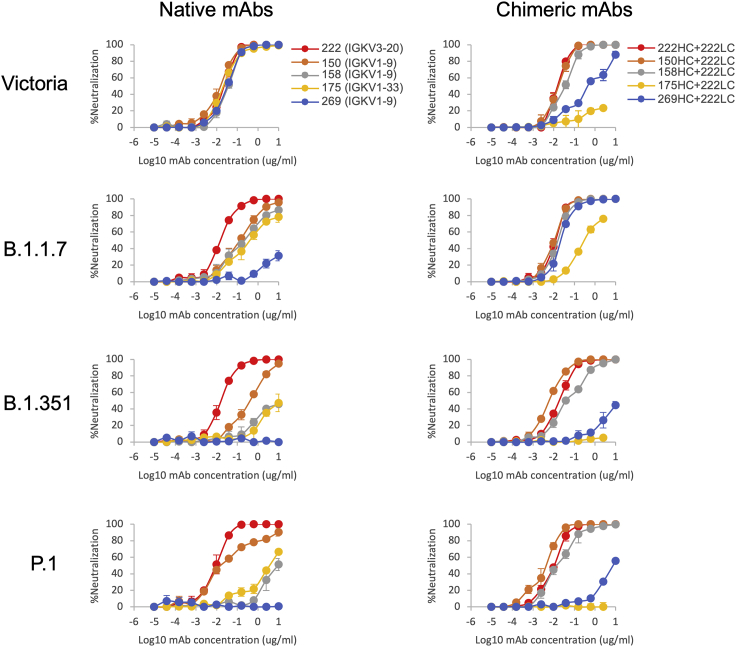
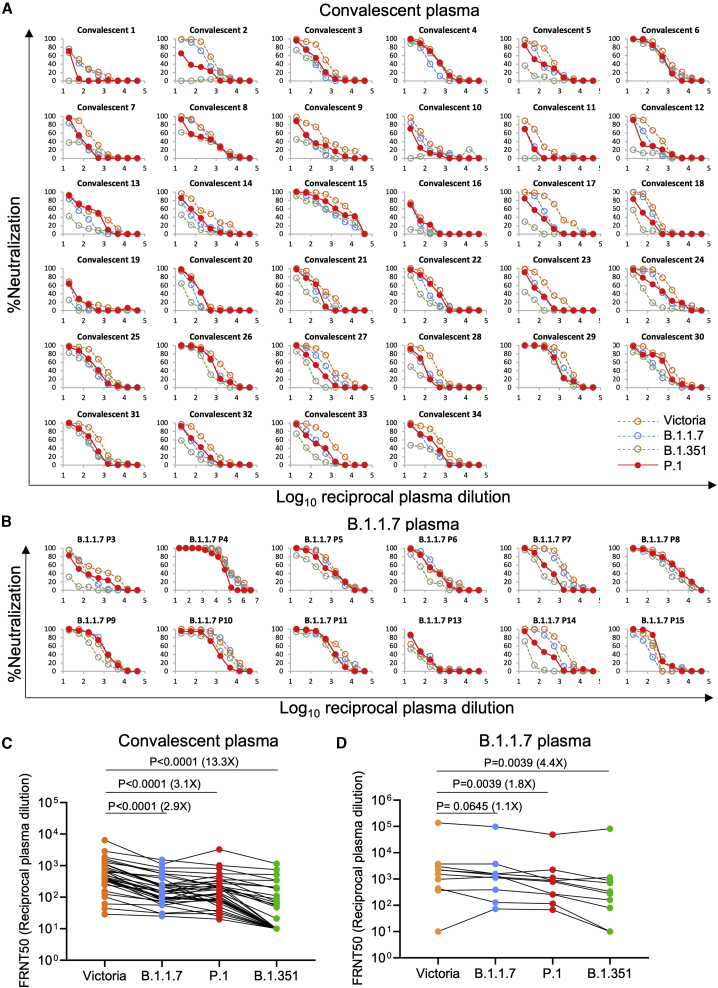
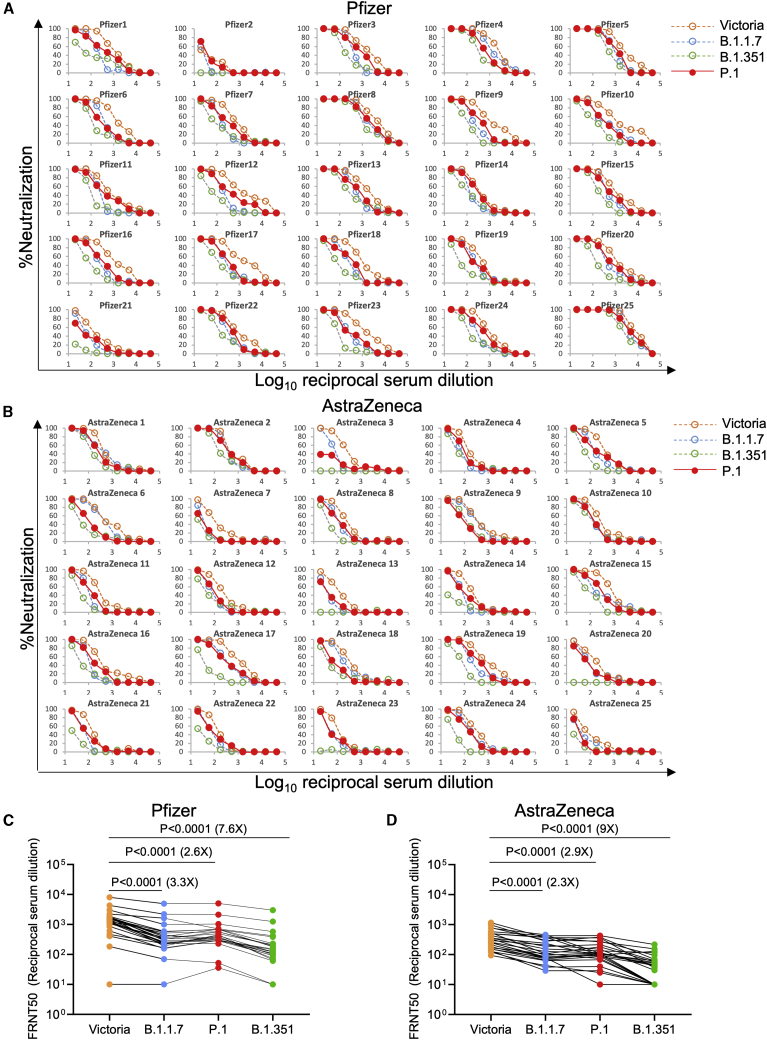
Terminating the SARS-CoV-2 pandemic relies upon pan-global vaccination. Current vaccines elicit neutralizing antibody responses to the virus spike derived from early isolates. However, new strains have emerged with multiple mutations, including P.1 from Brazil, B.1.351 from South Africa, and B.1.1.7 from the UK (12, 10, and 9 changes in the spike, respectively). All have mutations in the ACE2 binding site, with P.1 and B.1.351 having a virtually identical triplet (E484K, K417N/T, and N501Y), which we show confer similar increased affinity for ACE2. We show that, surprisingly, P.1 is significantly less resistant to naturally acquired or vaccine-induced antibody responses than B.1.351, suggesting that changes outside the receptor-binding domain (RBD) impact neutralization. Monoclonal antibody (mAb) 222 neutralizes all three variants despite interacting with two of the ACE2-binding site mutations. We explain this through structural analysis and use the 222 light chain to largely restore neutralization potency to a major class of public antibodies.

Keywords: P.1; RBD; SARS-CoV-2; VH3-53; antibody; escape; neutralization; spike; structure; variant.


Conflict of interest statement

Declaration of interests G.R.S. sits on the GSK Vaccines Scientific Advisory Board. Oxford University holds intellectual property related to the Oxford-AstraZeneca vaccine. A.J.P. is chair of the UK Department Health and Social Care’s (DHSC) Joint Committee on Vaccination & Immunisation (JCVI) but does not participate in the JCVI COVID-19 committee and is a member of the World Health Organization’s (WHO’s) SAGE. The views expressed in this article do not necessarily represent the views of DHSC, JCVI, or WHO. S.C.G. is co-founder of Vaccitech (collaborators in the early development of this vaccine candidate) and is named as an inventor on a patent covering use of ChAdOx1-vectored vaccines and a patent application covering this SARS-CoV-2 vaccine (PCT/GB2012/000467). T.L. is named as an inventor on a patent application covering this SARS-CoV-2 vaccine and was a consultant to Vaccitech for an unrelated project during the conduct of the study. The University of Oxford has entered into a partnership with AstraZeneca on coronavirus vaccine development.The University of Oxford has protected intellectual property disclosed in this publication.

Figures

None
Graphical abstract
Figure S1
Figure S1
Sliding 7-day window depicting proportion of sequences containing K417T, related to Figure 1
Figure 1
Figure 1
Mutational landscape of P.1 (A–C) Schematic showing the locations of amino acid substitutions in P.1 (A), B.1.1.7 (B), and B.1.351 (C) relative to the Wuhan SARS-CoV-2 sequence. The time course of P.1 emergence is shown in Figure S1. Point mutations are shown in red and deletions in dark gray. Under the structural cartoon is a linear representation of S with changes marked on. Where there is a charge change introduced by mutations, the change is colored (red if the change makes the mutant more acidic/less basic and blue if the change makes the mutant more basic/less acidic). (D) Depiction of the RBD as a gray surface with the location of the three mutations (K417T, E484K, and N501Y) (magenta); the ACE2 binding surface of RBD is colored green. (E) Locations of N-linked glycan (red surface) on the S trimer shown in a pale blue surface representation, and the two new sequons found in P.1 are marked in blue.
Figure S2
Figure S2
BLI titration for the attachment and dissociation of ACE2 from P.1 RBD attached to the tip, related to Figure 2
Figure 2
Figure 2
Comparison of wild-type (WT) RBD-ACE2 and P.1 RBD-ACE2 complexes (A) Comparison of P.1 RBD-ACE2 (gray and salmon) with WT RBD-ACE2 (blue and cyan) (PDB: 6LZG) by overlapping the RBDs. The mutations in the P.1 RBD are shown as sticks. (B–D) Open-book view of electrostatic surface of the WT RBD-ACE2 complex (B) and the P.1 RBD/ACE2 complex (C and D). Note the charge difference between the WT and the mutant RBDs. The charge range displayed is ±5 kJ/mol. (E) The K417 of the WT RBD forms a salt bridge with D30 of ACE2. (F and G) Effect of E484K mutation on the electrostatic surface. The tight binding of ACE2 is demonstrated by BLI analysis in Figure S2. (H) Y501 of the P.1 RBD makes a stacking interaction with Y41 of ACE2. (I) KD of RBD-mAb interaction measured by BLI for RBDs of Victoria, B.1.1.7, P.1, and B.1.351 (left to right) (J) BLI data mapped onto the RBD using the method described previously (Dejnirattisai et al., 2021). Front and back views of the RBD are shown. In the left pair, the spheres represent the antibody binding sites colored according to the ratio (KDP.1/KDWuhan). For white, the ratio is 1; for red, it is <0.1 (i.e., at least 10-fold reduction). Black dots refer to mapped antibodies not included in this analysis. Dark green indicates the RBD ACE2 binding surface. Yellow marks mutated K417T, E484K, and N501Y. For the right pair, spheres are colored according to the log of the ratio of neutralization titers (IC50P.1P.1/IC50Victoria). For white, the ratio is 1; for red, it is <0.001 (i.e., at least 1,000-fold reduction). Note the strong agreement between KD and IC50. All relevant data are shown in Table S2.
Figure 3
Figure 3
Neutralization of P.1 by mAbs (A) Neutralization of P.1 by a panel of 20 potent human mAbs. Neutralization was measured by FRNT; curves for P.1 are superimposed onto curves for Victoria, B.1.1.7, and B.1.351 as previously reported (Supasa et al., 2021; Zhou et al., 2021). FRNT50 titers are reported in Table S2. Neutralization curves for mAbs in different stages of development for commercial use are shown. (B) Equivalent plots for the Vir, Regeneron, AstraZeneca, Lilly, and Adagio therapeutic antibodies.
Figure 4
Figure 4
Structures of Fab 222 in complex with WT and mutant RBDs (A) Electrostatic surface depiction of Fab 159 in complex with the NTD depicted as a gray cartoon. Residues mutated in P.1 are shown as vdw radii representation for the original amino acid (oxygen, red; nitrogen, blue; carbon, gray). (B) Left to right: back and front surfaces of the RBD (gray) bound to a number of typical VH3-53 Fabs (Cα trace with 222 shown in cyan and 150, 158, and 269 shown in gold). P1 mutations in the RBD are highlighted in magenta and labeled. In this group, mAb 222 has a slightly longer CDR-H3. (C) Crystal structure of P1 RBD/222 Fab and EY6A Fabs (Zhou et al., 2020). (D) Close-up of 222 CDRs interacting with the RBD (gray), mutations are highlighted in yellow on the green ACE2 interface. (E and F) K417N/T interactions with Fab 222 (E) and N501Y interactions with Fab 222 (F) in the K417N (cyan), K417T (magenta), P.1 (blue), and P.1.351 (teal) RBD-Fab 222 complex structures compared with the WT RBD-Fab 222 (gray) complex by superimposing the RBD. (G) Overlay of Vh domains of Fabs 150 (gray), 158 (teal), 269 (salmon), and 222 (blue) showing that the light chain of 222 does not clash with any of other three heavy chains, while (H) shows the light chains of 150, 158, and 269 clash with the heavy chain of 222. For clarity, only the light chain of 222 in (G) and the heavy chain of 222 in (H) are shown. Light-chain gene usage, RBD contacts, and somatic mutations are shown in Figure S3 and Table S3.
Figure S3
Figure S3
Light-chain gene usage and CDR sequences of the five IGHV3-53 mAbs used in this report, related to Figure 4 (A) Light chain gene usage. (B) Sequence alignment of the CDR regions of both heavy and light chains. Conserved residues are indicated by s and those contact with RBD shown in red. Blue backgrounds mark somatic mutations. There is no structure for 175 and hence contacts are not known. CDR-L2 does not contact the RBD and is therefore not shown.
Figure 5
Figure 5
Neutralization curves of VH3-53 chimeric antibodies Neutralization curves of Victoria, B.1.1.7, B.1.351, and P.1. Left-hand column: neutralization curves using the native antibodies 222, 150, 158, 175, and 269. Right-hand column: neutralization curves for chimeric antibodies. The heavy chains of 150, 158, 175, and 269 are combined with the light chain of 222. Native 222 is used as the control. FRNT50 titers are given in Table S2.
Figure 6
Figure 6
Neutralization of P.1 by convalescent plasma Plasma (n = 34) was collected from volunteers 4–9 weeks following SARS-CoV-2 infection. All samples were collected before June 2020 and therefore represent infection before the emergence of B.1.1.7 in the UK. (A) Neutralization of P.1 was measured by FRNT. Comparison is made with neutralization curves for Victoria, B.1.1.7, and B.1.351 that we have previously generated (Zhou et al., 2021; Supasa et al., 2021). (B) Neutralization of P.1 by plasma taken from volunteers who had suffered infection with B.1.1.7, as evidenced by sequencing or S-gene dropout by diagnostic PCR. Samples were taken at varying times following infection. (C and D) Comparison of FRNT50 titers between Victoria and P.1. Data for B.1.1.7 and B.1.351 are included for comparison, and the Wilcoxon matched-pairs signed rank test was used for the analysis; two-tailed p values were calculated. Geometric mean values are indicated above each column. Relevant data are detailed in Tables S4A and S4B.
Figure 7
Figure 7
Neutralization of P.1 by vaccine serum (A) Pfizer vaccine. Serum (n = 25) was taken 7–17 days following the second dose of the Pfizer-BioNTech vaccine. FRNT titration curves are shown with Victoria, B.1.1.7, and B.1.351 as comparison (Supasa et al., 2021; Zhou et al., 2021). (B) AstraZeneca vaccine. Serum was taken 14 or 28 days following the second dose of the Oxford-AstraZeneca vaccine (n = 25). (C and D) Comparison of FRNT50 titers for individual samples for the Pfizer and AstraZeneca vaccine among Victoria, B.1.1.7, B.1.351, and P.1. The Wilcoxon matched-pairs signed rank test was used for the analysis, and two-tailed p values were calculated. Geometric mean values are indicated above each column. Relevant data are shown in Table S5.

Similar articles

Cited by

References

    1. Aricescu A.R., Lu W., Jones E.Y. A time- and cost-efficient system for high-level protein production in mammalian cells. Acta Crystallogr D Biol Crystallogr. 2006;62:1243–1250. doi: 10.1107/S0907444906029799. - DOI - PubMed
    1. Baden L.R., El Sahly H.M., Essink B., Kotloff K., Frey S., Novak R., Diemert D., Spector S.A., Rouphael N., Creech C.B., COVE Study Group Efficacy and Safety of the mRNA-1273 SARS-CoV-2 Vaccine. N. Engl. J. Med. 2021;384:403–416. - PMC - PubMed
    1. Barnes C.O., West A.P., Jr., Huey-Tubman K.E., Hoffmann M.A.G., Sharaf N.G., Hoffman P.R., Koranda N., Gristick H.B., Gaebler C., Muecksch F. Structures of Human Antibodies Bound to SARS-CoV-2 Spike Reveal Common Epitopes and Recurrent Features of Antibodies. Cell. 2020;182:828–842.e16. - PMC - PubMed
    1. Baum A., Fulton B.O., Wloga E., Copin R., Pascal K.E., Russo V., Giordano S., Lanza K., Negron N., Ni M. Antibody cocktail to SARS-CoV-2 spike protein prevents rapid mutational escape seen with individual antibodies. Science. 2020;369:1014–1018. - PMC - PubMed
    1. Caly L., Druce J., Roberts J., Bond K., Tran T., Kostecki R., Yoga Y., Naughton W., Taiaroa G., Seemann T. Isolation and rapid sharing of the 2019 novel coronavirus (SARS-CoV-2) from the first patient diagnosed with COVID-19 in Australia. Med. J. Aust. 2020;212:459–462. - PMC - PubMed

Publication types

MeSH terms