. 2021 Apr 14;13(1):58.
doi: 10.1186/s13073-021-00871-5.

PRMT1-mediated H4R3me2a recruits SMARCA4 to promote colorectal cancer progression by enhancing EGFR signaling

Affiliations

PRMT1-mediated H4R3me2a recruits SMARCA4 to promote colorectal cancer progression by enhancing EGFR signaling

Bing Yao et al. Genome Med. .

Erratum in

Abstract

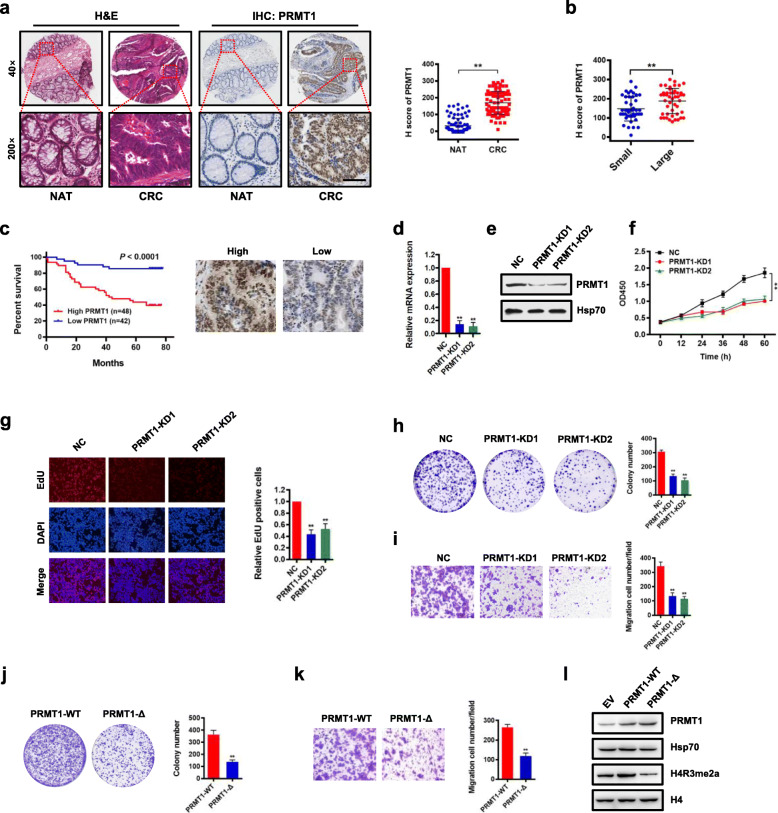
Background: Aberrant changes in epigenetic mechanisms such as histone modifications play an important role in cancer progression. PRMT1 which triggers asymmetric dimethylation of histone H4 on arginine 3 (H4R3me2a) is upregulated in human colorectal cancer (CRC) and is essential for cell proliferation. However, how this dysregulated modification might contribute to malignant transitions of CRC remains poorly understood.

Methods: In this study, we integrated biochemical assays including protein interaction studies and chromatin immunoprecipitation (ChIP), cellular analysis including cell viability, proliferation, colony formation, and migration assays, clinical sample analysis, microarray experiments, and ChIP-Seq data to investigate the potential genomic recognition pattern of H4R3me2s in CRC cells and its effect on CRC progression.

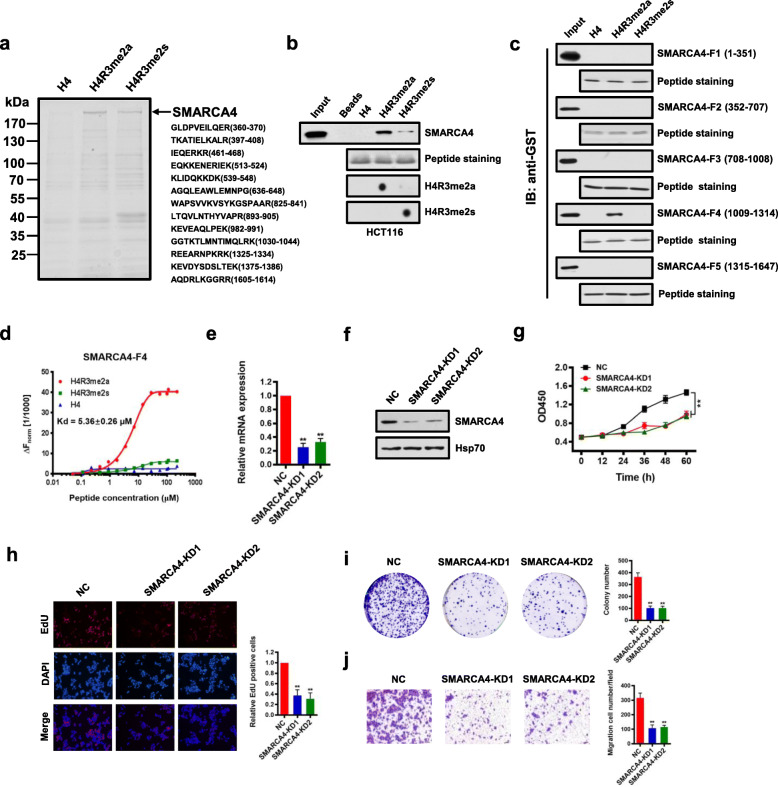
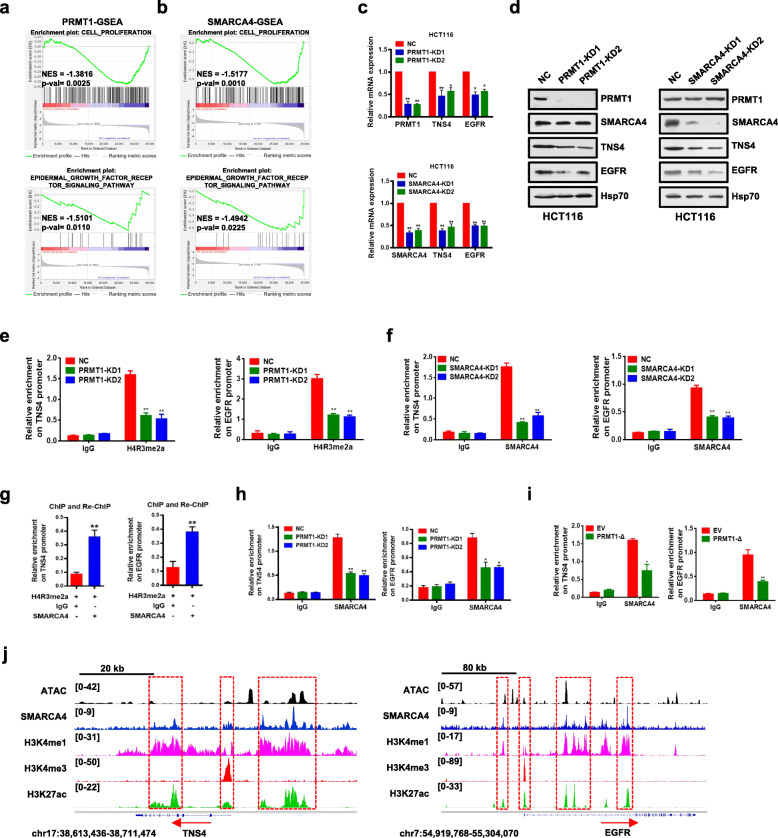
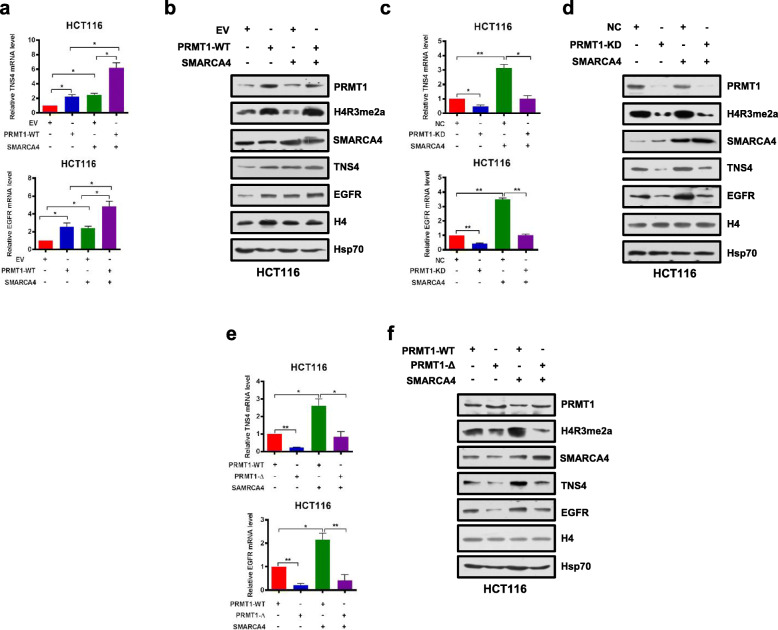
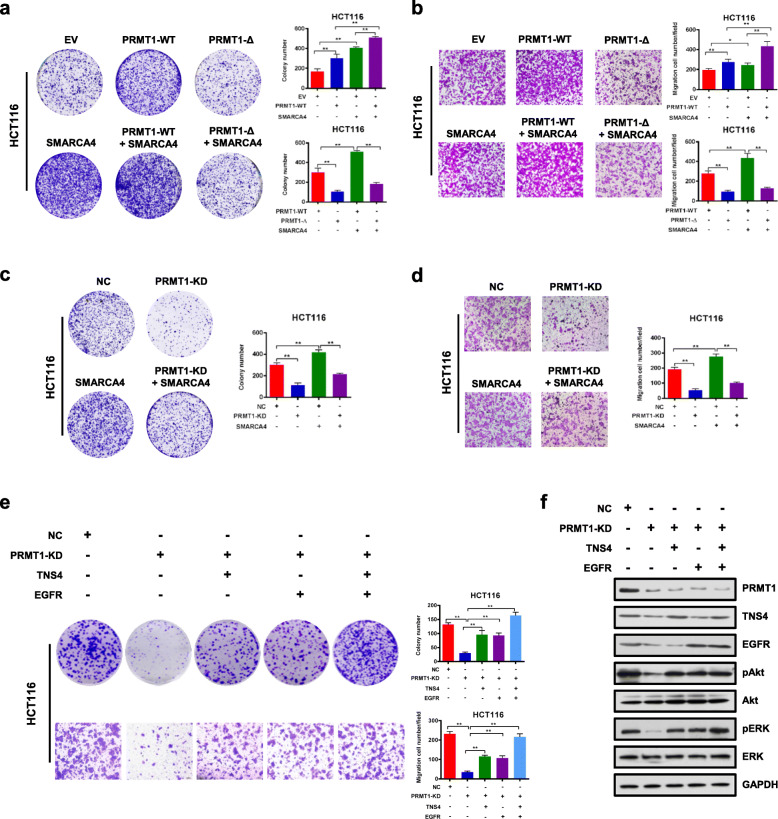
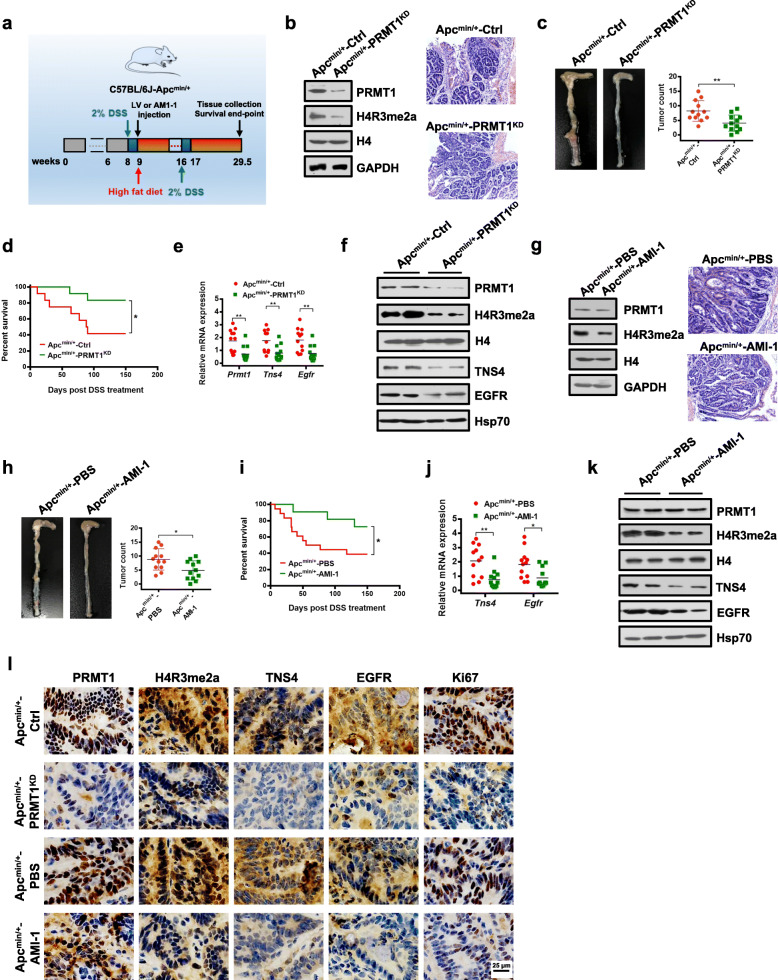
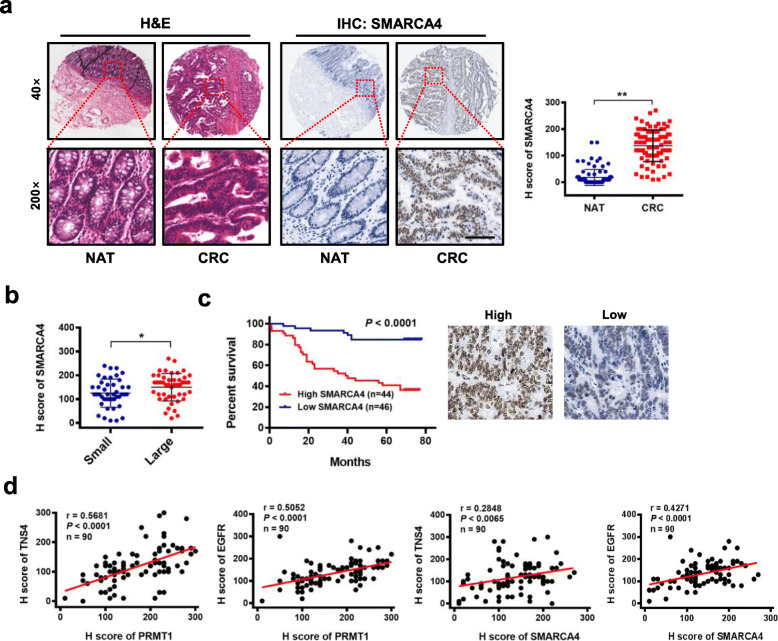
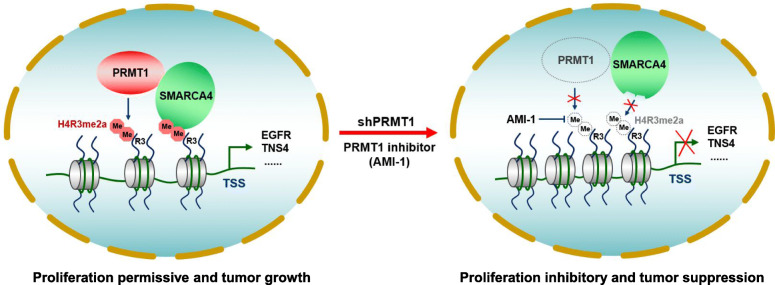
Results: We show that PRMT1 and SMARCA4, an ATPase subunit of the SWI/SNF chromatin remodeling complex, act cooperatively to promote colorectal cancer (CRC) progression. We find that SMARCA4 is a novel effector molecule of PRMT1-mediated H4R3me2a. Mechanistically, we show that H4R3me2a directly recruited SMARCA4 to promote the proliferative, colony-formative, and migratory abilities of CRC cells by enhancing EGFR signaling. We found that EGFR and TNS4 were major direct downstream transcriptional targets of PRMT1 and SMARCA4 in colon cells, and acted in a PRMT1 methyltransferase activity-dependent manner to promote CRC cell proliferation. In vivo, knockdown or inhibition of PRMT1 profoundly attenuated the growth of CRC cells in the C57BL/6 J-ApcMin/+ CRC mice model. Importantly, elevated expression of PRMT1 or SMARCA4 in CRC patients were positively correlated with expression of EGFR and TNS4, and CRC patients had shorter overall survival. These findings reveal a critical interplay between epigenetic and transcriptional control during CRC progression, suggesting that SMARCA4 is a novel key epigenetic modulator of CRC. Our findings thus highlight PRMT1/SMARCA4 inhibition as a potential therapeutic intervention strategy for CRC.

Conclusion: PRMT1-mediated H4R3me2a recruits SMARCA4, which promotes colorectal cancer progression by enhancing EGFR signaling.

Keywords: Colorectal Cancer; Epigenomics; H4R3me2s; PRMT1; SMARCA4; Transcription.


Conflict of interest statement

The authors declare that they have no competing interests.

Figures

Fig. 1
Fig. 1
SMARCA4 is a major H4R3me2a-associated protein and promotes CRC cell proliferation. a Immunoaffinity purification to identify proteins that are associated with H4R3me2a. The protein bands were retrieved and analyzed by mass spectrometry. SMARCA4 peptide fragments identified by mass spectrometric assay (right). b Peptide pull-down assay to detect the interactions between H4, H4R3me2a, and H4R3me2s peptides and SMARCA4 in HCT116 cell nuclear extracts (top panel). Coomassie staining shows equivalent loading of the three peptides (middle panel). The modification of the synthesized peptide was confirmed by dot blot analysis with specific antibodies (bottom panels). c Peptide pull-down experiments were performed with H4, H4R3me2a, and H4R3me2s peptides and purified recombinant glutathione S-transferase (GST) fusion proteins of SMARCA4 fragments expressed in E. coli. as in b. d MST assay to identify direct interactions between SMARCA4-F4 and H4R3me2a peptides. The dissociation constant (Kd) between SMARCA4-F4 and H4R3me2a peptide is 5.36 ± 0.26 μM. e, f Identification of the effect of SMARCA4 knockdown (SMARCA4-KD) in HCT116 cells by quantitative real-time PCR (e) and western blot analysis with indicated antibodies (f). Hsp70 served as a loading control. g Proliferation of HCT116 cells following knockdown of SMARCA4. Values at the indicated time points represent mean ± s.d. from three independent tests; **P < 0.01. h EdU proliferation analysis of the effect of siRNA knockdown of SMARCA4 on the growth of HCT116 cells. Representative images (left panel) and quantitative analyses of the assay (right panel) are shown. i Colony formation assay of HCT116 cells following SMARCA4 knockdown. Representative images (left panel) and quantitative analyses of the colony formation (right panel) are shown. j Migration assay of HCT116 cells following SMARCA4 knockdown. The numbers of migrated cells were quantified by counting the numbers of cells in entire fields at ×200 magnification. Representative images (left panel) and quantitative analyses of the migrated cells (right panel) are shown. For e, h, i, and j, results are shown as mean ± s.d. from three independent experiments; **P < 0.01 compared with the scrambled negative control (NC)
Fig. 2
Fig. 2
Upregulation of PRMT1 in colorectal cancer is associated with poor prognosis, and knockdown of PRMT1 reduces CRC cell proliferation. a Hematoxylin and eosin (H&E) staining and immunohistochemical staining (IHC) of PRMT1 protein in adjacent normal colon tissue controls (NAT) and colorectal cancer (CRC) human tissues. Representative micrographs are shown in original magnification (× 200) as indicated (left); total IHC score of PRMT1 in NAT and CRC tissues (n = 90); **P < 0.01 (right). Scale bar, 50 μm. b Correlation of PRMT1 expression with tumor size; **P < 0.01. c Kaplan–Meier plot of overall survival of 90 patients with colorectal cancer, stratified by PRMT1 expression. Log-rank test, P < 0.0001. d, e Effect of PRMT1 knockdown (PRMT1-KD) in HCT116 cells assessed by quantitative real-time PCR (d) and western blot analyses with the indicated antibodies (e). Hsp70 served as a loading control. f Proliferation of HCT116 cells following PRMT1 knockdown. Values at the indicated time points represent mean ± s.d. from three independent tests; **P < 0.01. g EdU proliferation analysis of the effect of PRMT1-KD on the growth of HCT116 cells compared with NC controls; Representative images (left panel) and quantitative analyses of the assay (right panel) are shown. h Colony formation assay of HCT116 cells following PRMT1 knockdown. Representative images (left panel) and quantitative analyses of the colony formation (right panel) are shown. i Migration assays of HCT116 cells following PRMT1 knockdown. The numbers of migrated cells were quantified by counting the numbers of cells in entire fields at × 200 magnification. Representative images (left panel) and quantitative analyses of the migrated cells (right panel) are shown. j, k Colony formation (j) and migration assays (k) of HCT116 cells overexpressing wild-type PRMT1 (PRMT1-WT) or PRMT1-Δ. l Western blot analysis of indicated proteins from HCT116 cells overexpressing PRMT1-WT, PRMT1-Δ, or EV (empty vector, MSCV). Hsp70 and histone H4 served as loading controls. Data are representative of three independent experiments. All results are shown as mean ± s.d. from three independent experiments; **P < 0.01 compared with the NC control
Fig. 3
Fig. 3
Identification of transcriptional targets of PRMT1 and SMARCA4. a,b Gene set enrichment analysis (GSEA) plots for cell proliferation-related and EGFR signaling pathway-related genes in HCT116 cells following PRMT1 knockdown (a) or SMARCA4 knockdown (b). c Quantitative real-time PCR analysis of PRMT1, TNS4, or EGFR mRNA levels normalized to GAPDH in scrambled negative control HCT116 cells (NC) and PRMT1-KD1/2 or SMARCA4-KD1/2 HCT116 cells. d Western blot analysis of indicated proteins in NC, PRMT-KD, and SMARCA4-KD HCT116 cells. Hsp70 served as a loading control. Data are representative of three independent experiments. e,f ChIP analysis of H4R3me2a and SMARCA4 binding to the TNS4 and EGFR promoter in NC, PRMT-KD, and SMARCA4-KD HCT116 cells. g ChIP-reChIP analysis of chromatin from HCT116 cells. The first antibody (H4R3me2a) and second antibody (SMARCA4) used in the reChIP are shown below the bar plot. The amount recovered from the reChIP was determined by qPCR and is shown as a percentage of the input. h ChIP analysis of SMARCA4 on the TNS4 and EGFR promoter from PRMT1 knockdown cells or NC control cells. i ChIP analysis of SMARCA4 on the TNS4 and EGFR promoter from PRMT1-Δ-overexpressing cells or EV (empty vector, MSCV) control cells. j Genomic tracks of ATAC and ChIP intensities of SMARCA4, H3K4me1, H3K4me3, and H3K27ac in the vicinity of TNS4 and EGRF loci in HCT116 cells. Track height is normalized to relative number of mapped reads. All results are shown as mean ± s.d. from three independent experiments. **P < 0.01 or *P < 0.05 compared to NC control or the indicated control (rabbit IgG)
Fig. 4
Fig. 4
PRMT1 and SMARCA4 cooperatively activate TNS4 and EGFR transcription in HCT116 cells. a, b Quantitative real-time PCR analysis of indicated mRNAs normalized to GAPDH (a) and western blot analysis of indicated proteins normalized to histone H4 and Hsp70 (b) from HCT116 cells that had been transfected with EV (empty vector, MSCV) or PRMT1-WT, and transfected or not with a SMARCA4 expression construct. c, d Quantitative real-time PCR analysis of indicated mRNAs normalized to GAPDH (c) and western blot analysis of indicated proteins normalized to histone H4 and Hsp70 (d) from NC or PRMT1-KD in HCT116 cells transfected or not with a SMARCA4 expression construct. e, f Quantitative real-time PCR analysis of indicated mRNAs normalized to GAPDH (e) and western blot analysis of indicated proteins normalized to histone H4 and Hsp70 (f) from HCT116 cells transfected with PRMT-WT or PRMT1-Δ constructs and transfected or not with a SMARCA4 expression construct. For a, c, and e, results are shown as mean ± s.d. from three independent experiments; *P < 0.05, **P < 0.01 compared with the indicated control
Fig. 5
Fig. 5
SMARCA4 couples with PRMT1 to promote CRC cell proliferation through EGFR signaling in HCT116 cells. a Colony formation assay with HCT116 cells transfected with EV (empty vector, MSCV), PRMT1-WT, PRMT1-Δ, SMARCA4, PRMT1-WT + SMARCA4, or PRMT1-Δ + SMARCA4. Representative images (left panels) and quantitative analyses of colony formation (right panels) are shown. b Cell migration assays with HCT116 cells transfected with MSCV, PRMT1-WT, PRMT1-Δ, SMARCA4, PRMT1-WT + SMARCA4, or PRMT1-Δ + SMARCA4. Representative images (left panels) and quantitative analyses of the migrated cells (right panels) are shown. c Colony formation assays from NC or PRMT1-KD transfected HCT116 cells transfected or not with a SMARCA4 expression construct. Representative images (left panels) and quantitative analyses of the colony formation (right panel) are shown. d Cell migration assays from NC or PRMT1-KD transfected HCT116 cells transfected or not with a SMARCA4 expression construct. Representative images (left panels) and quantitative analyses of the colony formation (right panel) are shown. e Colony formation assays and cell migration assays from NC or PRMT1-KD with ectopic expression of TNS4 or EGFR, or both. Representative images (left panels) and quantitative analyses of the colony formation (right panels) are shown. f Western blot analysis of the expression levels of PRMT1 and EGFR signaling pathway downstream molecules p-AKT, AKT, p-ERK, and ERK in HCT116 cells with ectopic expression of TNS4 or EGFR. GAPDH served as a loading control. All results are shown as mean ± s.d. from three independent experiments; **P < 0.01, *P < 0.05 compared with the indicated control
Fig. 6
Fig. 6
PRMT1 deficiency protects Apcmin/+ mice against DSS-induced CRC progression. a Schematic diagram of DSS-induced CRC in C57BL/6 J-Apcmin/+ mice with high-fat diet and related treatments. Tissue collection, analysis, and survival end-point analyses were performed at day 150 after the first DSS treatment. b Immunoblot analyses of PRMT1 and H4R3me2a in colon tissues (left) and hematoxylin and eosin (H&E) staining of colon tumors (right) from ApcMin/+-Ctrl and ApcMin/+-PRMT1KD mice after the indicated LV infection. c Numbers and size of colon tumors found in ApcMin/+-PRMT1KD mice (n = 12) compared with ApcMin/+-Ctrl mice (n = 12). Results are shown as mean ± s.d.; **P < 0.01 compared with the control mice. d Survival curves of ApcMin/+-Ctrl (n = 12) and ApcMin/+-PRMT1KD (n = 12) mice. Statistical significance was determined by Kaplan–Meier log-rank test; *P < 0.05. e, f Quantitative real-time PCR analysis of indicated mRNAs normalized to GAPDH (e) and western blot analysis of indicated proteins normalized to histone H4 and Hsp70 (f) from colon tissues from ApcMin/+-Ctrl and ApcMin/+-PRMT1KD mice. Results are shown as mean ± s.d. from 12 mice each; **P < 0.01 compared with the control mice. g Immunoblot analyses of PRMT1 and H4R3me2a in colon tissues (left) and hematoxylin and eosin (H&E) staining of colon tumors (right) from ApcMin/+-PBS and ApcMin/+-AMI-1 mice. h Numbers and size of colon tumors found in ApcMin/+-AMI-1 mice (n = 12) compared with ApcMin/+-PBS mice (n = 12). Results are shown as mean ± s.d.; *P < 0.05 compared with the control mice. i Survival curves of ApcMin/+-PBS (n = 12) and ApcMin/+-AMI-1 (n = 12) mice. Statistical significance was determined by the Kaplan–Meier log-rank test. *P < 0.05. j, k Quantitative real-time PCR analysis of indicated mRNAs normalized to GAPDH (j) and western blot analysis of indicated proteins normalized to histone H4 and Hsp70 (k) from colon tissues from ApcMin/+-PBS and ApcMin/+-AMI-1 mice. Results are shown as mean ± s.d. from 12 mice each; *P < 0.05, **P < 0.01 compared with the control mice. l Representative IHC staining of PRMT1, H4R3me2a, TNS4, EGFR, and Ki67 in colon tumor tissues of C57BL/6 J-ApcMin/+ mice from indicated groups
Fig. 7
Fig. 7
Upregulation of SMARCA4 positively correlates with expression of EGFR and TNS4 and is associated with poor prognosis of CRC patients. a Hematoxylin and eosin (H&E) staining and IHC staining of SMARCA4 protein in adjacent normal colon tissue controls (NAT) and colorectal cancer (CRC) in human tissues. Representative micrographs are shown in original magnification (× 200) as indicated (left); total IHC score of SMARCA4 in NAT and CRC tissues (n = 90); **P < 0.01 (right). Scale bar, 50 μm. b Correlation of SMARCA4 expression and tumor size in CRC patients; *P < 0.05. c Kaplan–Meier plot of overall survival of 90 patients with colorectal cancer, stratified by SMARCA4 expression; log-rank test, P < 0.0001. d Pearson correlation scatter plot of H scores of PRMT1 or SMARCA4, and TNS4 or EGFR in human colorectal cancer (n = 90)
Fig. 8
Fig. 8
A hypothetical model of PRMT1 and SMARCA4 regulating cell proliferation and CRC progression

References

    1. Arnold M, Sierra MS, Laversanne M, Soerjomataram I, Bray F. Global patterns and trends in colorectal cancer incidence and mortality. Gut. 2016;66:683–691. doi: 10.1136/gutjnl-2015-310912. - DOI - PubMed
    1. Puccini A, Berger MD, Naseem M, Tokunaga R, Battaglin F, Cao S, Hanna DL, McSkane M, Soni S, Zhang W. Colorectal cancer: Epigenetic alterations and their clinical implications. Biochim Biophys Acta. 1868;2017:439–448. - PMC - PubMed
    1. Cavalli G, Heard E. Advances in epigenetics link genetics to the environment and disease. Nature. 2019;571:489–499. doi: 10.1038/s41586-019-1411-0. - DOI - PubMed
    1. Chi P, Allis CD, Wang GG. Covalent histone modifications--miswritten, misinterpreted and mis-erased in human cancers. Nat Rev Cancer. 2010;10:457–469. doi: 10.1038/nrc2876. - DOI - PMC - PubMed
    1. Zhao Z, Shilatifard A. Epigenetic modifications of histones in cancer. Genome Biol. 2019;20:245. doi: 10.1186/s13059-019-1870-5. - DOI - PMC - PubMed

Publication types

MeSH terms