. 2021 Oct;31(10):1831-1842.
doi: 10.1101/gr.260893.120. Epub 2021 Apr 14.

Profiling single-cell histone modifications using indexing chromatin immunocleavage sequencing

Affiliations

Profiling single-cell histone modifications using indexing chromatin immunocleavage sequencing

Wai Lim Ku et al. Genome Res. 2021 Oct.

Abstract

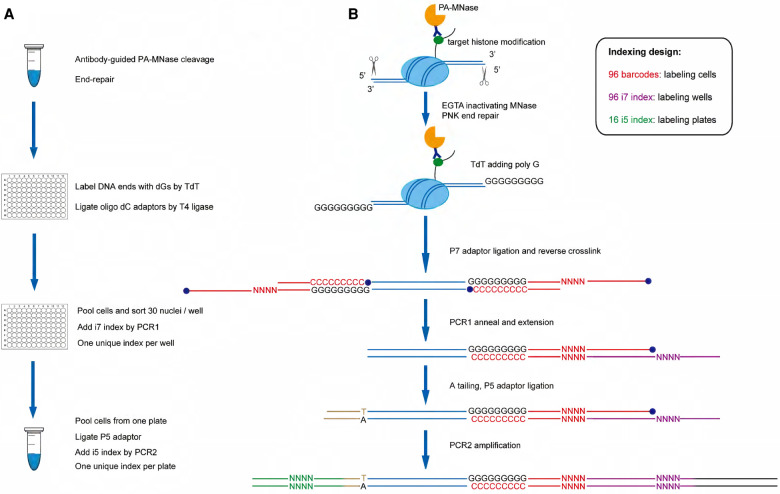
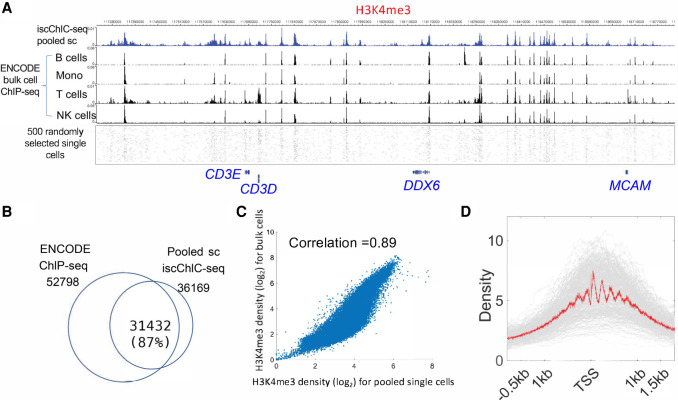
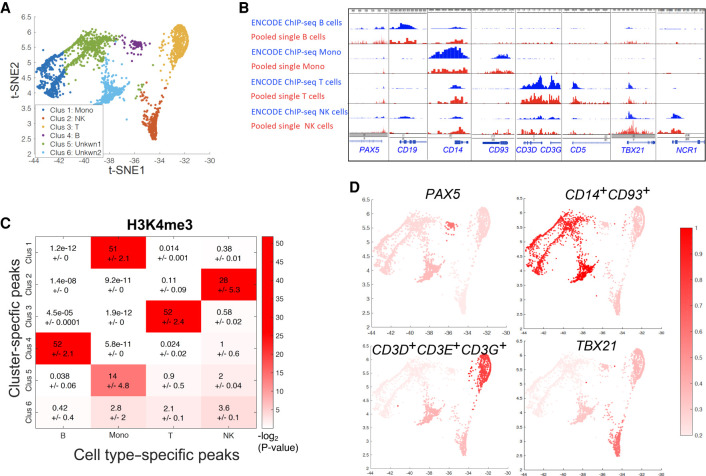
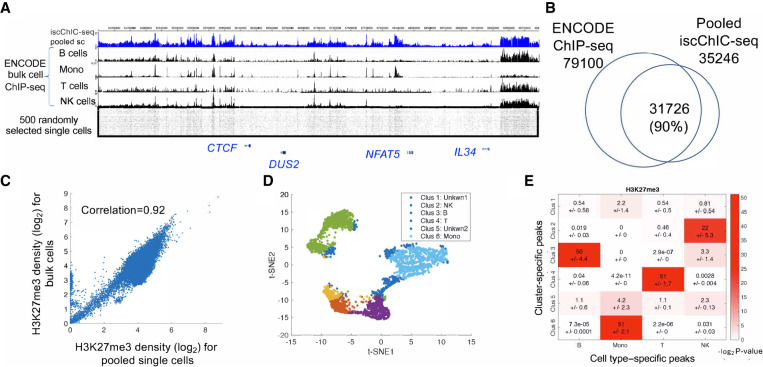
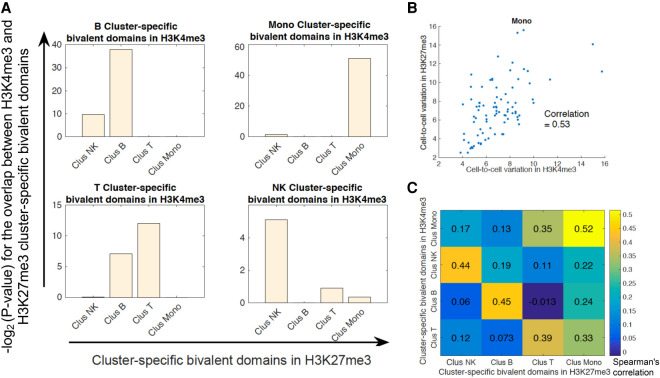
Recently, multiple single-cell assays were developed for detecting histone marks at the single-cell level. These techniques are either limited by the low cell throughput or sparse reads which limit their applications. To address these problems, we introduce indexing single-cell immunocleavage sequencing (iscChIC-seq), a multiplex indexing method based on TdT terminal transferase and T4 DNA ligase-mediated barcoding strategy and single-cell ChIC-seq, which is capable of readily analyzing histone modifications across tens of thousands of single cells in one experiment. Application of iscChIC-seq to profiling H3K4me3 and H3K27me3 in human white blood cells (WBCs) enabled successful detection of more than 10,000 single cells for each histone modification with 11 K and 45 K nonredundant reads per cell, respectively. Cluster analysis of these data allowed identification of monocytes, T cells, B cells, and NK cells from WBCs. The cell types annotated from H3K4me3 single-cell data are specifically correlated with the cell types annotated from H3K27me3 single-cell data. Our data indicate that iscChIC-seq is a reliable technique for profiling histone modifications in a large number of single cells, which may find broad applications in studying cellular heterogeneity and differentiation status in complex developmental and disease systems.


Figures

Figure 1.
Figure 1.
Schematic of iscChIC-seq. (A) Experimental flow. (1) Bulk cells were split into the first 96-well plate after antibody-guided MNase cleavage and end repair. (2) Barcoded cells were pooled together and sorted into the second 96-well plate to introduce the i7 index. (3) Cells were pooled together again from each plate and labeled with the i5 index in PCR2. (B) Illustration of poly(dG) addition to DNA ends by TdT, oligo dC adaptor ligation by T4 DNA ligase, and PCR-mediated barcoding process. Cell barcode (red) is designed into the oligo dC P7 adaptor in which 3′ ends are blocked to prevent nontemplate tailing by TdT. After reverse crosslinking, barcoded DNA fragments could be efficiently labeled with the i7 index (purple) through annealing and PCR extension. The barcoded P5 adaptor is added to the other end of genomic DNA fragments by ligation and PCR2, which is used to amplify the library DNA for NGS sequencing.
Figure 2.
Figure 2.
iscChIC-seq robustly detects H3K4me3 profiles in human white blood cells. (A) A genome browser snapshot showing panels of H3K4me3 profiles in human white blood cells. The top blue track shows the pooled single-cell data from iscChIC-seq. The bottom track shows 500 randomly selected single cells. The middle tracks display the ENCODE bulk cell ChIP-seq data from different cells indicated on the left. (B) A Venn diagram showing the overlap of the enriched regions (peaks) of H3K4me3 profiles measured by ChIP-seq using bulk cells and by the pooled single-cell data. (C) A scatterplot of the H3K4me3 read density of ChIP-seq (bulk-cell) versus that of pooled single cells from iscChIC-seq (2000 cells were randomly selected) at the genome-wide divided bins (the size of the bin is 5 kb). The Pearson's correlation is equal to 0.89. (D) A TSS profile plot showing the H3K4me3 profile around TSSs for all single cells (gray) and the pooled single cells (red).
Figure 3.
Figure 3.
Identification of sub-cell types in white blood cells based on clusters generated from single-cell H3K4me3 profiles. (A) A t-SNE visualization of cells by applying the t-SNE analysis on the matrix Ec. Cell type annotations of clusters were obtained by the analysis in part B. (B) A heat map showing the significance of the overlap between the cluster-specific peaks from the H3K4me3 iscChIC-seq data (Fig. 3A) and cell type–specific peaks from ENCODE H3K4me3 ChIP-seq data. The y-axis refers to the cluster-specific peaks and x-axis refers to the cell type–specific peaks. The values before the +/− sign refer to the average negative logarithm of the P-value for the overlap between the two types of peaks over 100 subsamples. The values behind the +/− sign refer to the standard deviation of the negative logarithm of the P-value over 100 subsamples. (C) Genome browser snapshots showing the H3K4me3 profiles from bulk-cell ChIP-seq data and pooled single-cell iscChIC-seq data. The ChIP-seq data for B cells, monocytes, T cells, and NK cells were downloaded from ENCODE (red). The pooled H3K4me3 iscChIC-seq data for each identified cell type (Fig. 3A) are displayed (blue). For the iscChIC-seq data, 1610 monocytes, 1265 T cells, 898 NK cells, and 446 B cells were used. (D) A t-SNE visualization of cells by applying the t-SNE analysis on the matrix Ec. H3K4me3 density of regions associated with different genes is plotted. The color level indicates the H3K4me3 density level.
Figure 4.
Figure 4.
iscChIC-seq robustly detects H3K27me3 profiles in human white blood cells. (A) A genome browser snapshot showing H3K27me3 profiles in human white blood cells. The top blue track shows the pooled single-cell data from iscChIC-seq. The bottom track shows 500 randomly selected single cells. The middle tracks display the ENCODE bulk-cell ChIP-seq data from different cells indicated on the left. (B) A Venn diagram showing the overlap of the enriched regions (peaks) of H3K27me3 profiles measured by ChIP-seq using bulk cells and by the pooled single-cell data. (C) A scatterplot of the H3K27me3 read density of ChIP-seq (bulk-cell) versus that of pooled single cells from iscChIC-seq (2000 cells were randomly selected) at the genome-wide divided bins (the size of bin is 50 kb). The Pearson's correlation is equal to 0.92. (D) A t-SNE visualization of cells by applying the t-SNE analysis on the matrix Ec. Cell type annotations of clusters were obtained by the analysis in part E. (E) A heat map showing the significance of the overlap between the cluster-specific peaks from the H3K27me3 iscChIC-seq data (Fig. 4D) and cell type–specific peaks from ENCODE H3K27me3 ChIP-seq data. The y-axis refers to the cluster-specific peaks and x-axis refers to the cell type–specific peaks. The values before the +/− sign refer to the average negative logarithm of the P-value for the overlap between the two types of peaks over 100 subsamples. The values behind the +/− sign refer to the standard deviation of the negative logarithm of the P-value over 100 subsamples.
Figure 5.
Figure 5.
Correlation of cell clusters revealed from the single-cell H3K4me3 and H3K27me3 data by bivalent domains. (A) The cluster-specific peaks identified from the single-cell H3K4me3 and H3K27me3 data exhibit the highest overlap if they are from the same cell type. For each subplot, the cluster-specific peaks of H3K4me3 from one annotated cluster (as indicated on the top) were compared with the cluster-specific peaks of H3K27me3 from different clusters (as indicated below the plot). The y-axis in each subplot indicates the −log2 of P-value for the overlap between the cluster-specific peaks of H3K4me3 and cluster-specific peaks of H3K27me3. (B) A scatterplot between the cell-to-cell variation of H3K4me3 and H3K27me3 for clusters annotated as monocytes in bivalent domains (Methods). (C) Cluster-specific bivalent domains associated with H3K4me3 and H3K27me3 were computed for the purpose of finding the relationship between cell-to-cell variation in H3K4me3 and H3K27me3. For each comparison between the H3K4me3 and H3K27me3 clusters, the overlap between cluster-specific bivalent domains was considered; the Spearman's correlation between the coefficient of variation in H3K4me3 and H3K27me3 for these selected bivalent domains was calculated.

Similar articles

Cited by

References

    1. Ai S, Xiong H, Li CC, Luo Y, Shi Q, Liu Y, Yu X, Li C, He A. 2019. Profiling chromatin states using single-cell itChIP-seq. Nat Cell Biol 21: 1164–1172. 10.1038/s41556-019-0383-5 - DOI - PubMed
    1. Barski A, Cuddapah S, Cui K, Roh TY, Schones DE, Wang Z, Wei G, Chepelev I, Zhao K. 2007. High-resolution profiling of histone methylations in the human genome. Cell 129: 823–837. 10.1016/j.cell.2007.05.009 - DOI - PubMed
    1. Bernstein BE, Mikkelsen TS, Xie X, Kamal M, Huebert DJ, Cuff J, Fry B, Meissner A, Wernig M, Plath K, et al. 2006. A bivalent chromatin structure marks key developmental genes in embryonic stem cells. Cell 125: 315–326. 10.1016/j.cell.2006.02.041 - DOI - PubMed
    1. Carter B, Ku WL, Kang JY, Hu G, Perrie J, Tang Q, Zhao K. 2019. Mapping histone modifications in low cell number and single cells using antibody-guided chromatin tagmentation (ACT-seq). Nat Commun 10: 3747. 10.1038/s41467-019-11559-1 - DOI - PMC - PubMed
    1. Creyghton MP, Cheng AW, Welstead GG, Kooistra T, Carey BW, Steine EJ, Hanna J, Lodato MA, Frampton GM, Sharp PA, et al. 2010. Histone H3K27ac separates active from poised enhancers and predicts developmental state. Proc Natl Acad Sci 107: 21931–21936. 10.1073/pnas.1016071107 - DOI - PMC - PubMed

Publication types

MeSH terms