. 2021 Apr 14;6(58):eabf7550.
doi: 10.1126/sciimmunol.abf7550.

SARS-CoV-2 genome-wide T cell epitope mapping reveals immunodominance and substantial CD8+ T cell activation in COVID-19 patients

Affiliations

SARS-CoV-2 genome-wide T cell epitope mapping reveals immunodominance and substantial CD8+ T cell activation in COVID-19 patients

Sunil Kumar Saini et al. Sci Immunol. .

Abstract

T cells are important for effective viral clearance, elimination of virus-infected cells and long-term disease protection. To examine the full-spectrum of CD8+ T cell immunity in COVID-19, we experimentally evaluated 3141 major histocompatibility (MHC) class I-binding peptides covering the complete SARS-CoV-2 genome. Using DNA-barcoded peptide-MHC complex (pMHC) multimers combined with a T cell phenotype panel, we report a comprehensive list of 122 immunogenic and a subset of immunodominant SARS-CoV-2 T cell epitopes. Substantial CD8+ T cell recognition was observed in COVID-19 patients, with up to 27% of all CD8+ lymphocytes interacting with SARS-CoV-2-derived epitopes. Most immunogenic regions were derived from open reading frame (ORF) 1 and ORF3, with ORF1 containing most of the immunodominant epitopes. CD8+ T cell recognition of lower affinity was also observed in healthy donors toward SARS-CoV-2-derived epitopes. This pre-existing T cell recognition signature was partially overlapping with the epitope landscape observed in COVID-19 patients and may drive the further expansion of T cell responses to SARS-CoV-2 infection. Importantly the phenotype of the SARS-CoV-2-specific CD8+ T cells, revealed a strong T cell activation in COVID-19 patients, while minimal T cell activation was seen in healthy individuals. We found that patients with severe disease displayed significantly larger SARS-CoV-2-specific T cell populations compared to patients with mild diseases and these T cells displayed a robust activation profile. These results further our understanding of T cell immunity to SARS-CoV-2 infection and hypothesize that strong antigen-specific T cell responses are associated with different disease outcomes.


Figures

Fig. 1
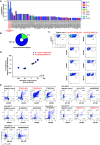
Fig. 1. CD8+ T cell epitope mapping in SARS-CoV-2.
(A) Schematic representation of the complete SARS-CoV-2 genome used for the identification of 3141 peptides with predicted binding rank (NetMHCpan 4.1) of 0.5 (ORF1 protein) and 1 (all remaining proteins) for ten prevalent HLA-A, B, and C molecules. (B) Bar plot showing the distribution of SARS-CoV-2 peptides related to their HLA-restriction (3141 peptide-HLA pairs) across the viral genome. Total peptide-MHC specificities analyzed for each protein are shown in parentheses next to the respective SARS-CoV-2 protein. (C) Experimental pipeline to analyze T cell recognition toward the SARS-CoV-2-derived HLA-binding peptides in PBMCs using DNA-barcoded peptide-MHC (pMHC) multimers. A 13-antibody panel was used for phenotype analysis of pMHC multimer positive CD8+ T cells. pMHC multimers binding CD8+ T cells were sorted based on PE (SARS-CoV-2-specific) or APC (CEF-specific) signal and sequenced to identify antigen-specific CD8+ T cells. (D) Representative analyses for SARS-CoV-2-restricted T cell populations in a COVID-19 patient. Left, flow cytometry plot of pMHC multimer staining of CD8+ T cells from a COVID patient stained with pMHC multimer panel showing SARS-CoV-2 (PE) and CEF (APC) multimer+ T cells that were sorted for DNA-barcode analysis to identify epitopes recognition. Right, CD8+ T cell recognition to individual epitopes were identified based on the enrichment of DNA barcodes associated with each of the tested peptide specificities (LogFc>2 and p <0.001, using barracoda). Significant T cell recognition of individual peptide sequences are colored based on their protein of origin and segregated based on their HLA-specificity. The black dot show CD8+ T cells reactive to one of the CEF peptides (here, CMV pp65; YSEHPTFTSQY-HLA-A01:01). All peptides with no significant enrichments are shown as gray dots. (E) Summary of all the T cell recognition to SARS-CoV-2-derived peptides identified in the 18 analyzed COVID-19- patients. In parentheses, number of peptides tested for each HLA (upper row) and the number of patients analyzed for each HLA pool (lower row). Each dot represents one peptide-HLA combination per patient, and are colored according to their origin of protein, similar to shown in panel A. The black dots show CD8+ T cells reactive to the CEF peptides in all analyzed patients. (F) Bar plots summarize the number of HLA-specific SARS-CoV-2 epitopes identified and the HLA-restricted immunogenicity (% immunogenic peptides) in the analyzed patient cohort. Immunogenicity represents the fraction of T cell recognized peptides out of the total number of peptides analyzed for a given HLA-restriction across the HLA-matching donors (% normalized). (G) Similar to E, a summary of SARS-CoV-2-specific T cell responses separated based on the protein of origin. (H) Bar plots show the number of epitopes derived from each of the SARS-CoV-2 protein and their immunogenicity score (% immunogenic peptides). (I) Estimated frequencies (% of total CD8+ T cells) as sum of all the SARS-CoV-2 epitope reactive T cells identified in individual COVID-19 patients. Bars are colored according to the protein origin of the recognized epitopes.
Fig. 2
Fig. 2. Strong immunodominance of SARS-CoV-2 derived peptides in COVID-19 patients.
(A) The prevalence of T cell recognition toward the individual epitopes detected in COVID-19 patients. Dotted line indicates the epitopes determined as immunodominant, based on the presence of T cell recognition in more than 50% analyzed patients (marked in red throughout this figure). Bars are colored according to their protein of origin, similar as shown in Fig. 1. (B) Pie chart of immunodominant epitopes distributed according to their protein of origin. (C) APC labeled pMHC tetramer-based analyses of CD8+ T cells in PBMCs of seven COVID-19 patients recognizing A01:01/TTDPSFLGRY or B07:02/SPRWYFYYL immunodominant epitopes. Gated population shows the percentage of T cells recognizing pMHC tetramers out of total CD8+ T cells. (D) Correlation of estimated T cell frequencies determined using DNA-barcoded multimer estimation (Table S4) and using conventional tetramer analysis (panel C) for the two most immunodominant epitopes in seven COVID-19 patients. Spearman correlation (p =0.002, r =0.92). (E) Functional validation of SARS-CoV-2-specific T cell responses identified in COVID-19 patient samples. Flow cytometry plots showing intracellular cytokine staining of PBMCs from COVID-19 patients pulsed with selected SARS-CoV-2-derived peptides, selected based on the CD8+ T cell responses identified from the DNA-barcoded multimer analysis (Table S4). PBMCs from seven COVID-19 patients were analyzed for functional activation after stimulation with indicated peptides or with an HLA-matching irrelevant peptide (negative control). The numbers on the plot indicate the frequency (%) of CD8+ T cells positive for the analyzed cytokines, IFN- and TNF-. The gating strategy of the flow cytometry analysis is shown in Fig. S5A.
Fig. 3
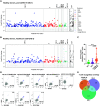
Fig. 3. Broad reactivity toward SARS-CoV-2-derived peptides in healthy individuals.
(A) CD8+ T cell recognition to individual SARS-CoV-2-derived peptides (Table S7) and CEF peptides (Table S5) in the pre-COVID-19 healthy donor cohort (n=18 individuals) identified based on the enrichment of DNA barcodes associated with each of the tested peptide specificities (LogFc>2 and p < 0.001, barracoda). Significant SARS-CoV-2-specific T cell recognition of individual peptide sequences are colored and segregated based on their protein of origin. The black dots show CD8+ T cells reactive to the CEF peptides in all analyzed donors. (B) T cell recognition in the high-exposure risk healthy donor cohort (Tables S7 and S5) (n=20 individuals). (C) Staining index of CD8+ T cells binding SARS-CoV-2-specific pMHC multimers in the three evaluated cohorts. One-Way ANOVA (Kruskal-Wallis test) p <0.0001 (patient vs. HD-1 <0.0001, patient vs. HD-2 <0.0001); n=18 (patient), n=18 (HD-1), and n=20 (HD-2). (D) Flow cytometry dot plots showing in-vitro expanded T cells from healthy donors recognizing SARS-CoV-2 derived epitopes, detected by combinatorial tetramer staining. T cell binding to each pMHC specificity is detected using pMHC tetramers prepared in a two-color combination (blue dots), gray dots show tetramer negative T cells, and the number on the plots shows the frequency (%) of tetramer+ of the CD8+ T cells. Gating strategy used for the flow cytometry analysis is shown in Fig. S11A. (E) Venn diagram illustrating the overlap of T cell recognition toward SARS-CoV-2-derived peptides in COVID-19 patient and healthy donor cohorts.
Fig. 4
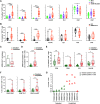
Fig. 4. Enhanced activation profile of SARS-CoV-2-specific T cells correlates with COVID-19 disease severity.
(A) Box plots comparing percentages of SARS-CoV-2 pMHC multimer binding CD8+ T cells expressing the indicated phenotype surface markers in the COVID-19 patient and the two healthy donor cohorts (n=18 individuals for each cohort). Each dot represents one sample. Frequencies were quantified from flow cytometry data processed using the gating strategy applied in Fig. S11. P-values for One-Way ANOVA (Kruskal-Wallis test): CD38 <0.0001 (HD-1 vs. patient <0.0001, HD-2 vs. patient <0.0001), CD39 <0.0001 (HD-1 vs. patient =0.006, HD-2 vs. patient <0.0001), CD69 <0.0001 (HD-1 vs. patient <0.0001, HD-2 vs. patient <0.0001), HLA-DR =0.002 (HD-1 vs. patient =0.02, HD-2 vs. patient <0.004), and CD27 =0.03 (HD-1 vs. patient =0.03). (B) Box plots comparing the percentage of SARS-CoV-2 pMHC multimer+ (n=18 patients) and CEF pMHC multimer+ (n=14 patients) CD8+ T cells expressing the indicated surface markers in the COVID-19 patient cohort. Each dot represents one sample. P-values for hypothesis (Mann-Whitney) test: =0.0002 (CD38), <0.0001 (CD39), 0.0001 (CD69), =0.009 (HLA-DR), =0.04 (CD27). (C) Number of SARS-CoV-2 epitopes recognized by T cells in outpatient (n=7) and hospitalized (n=11) patient samples. (D) Box plots show frequencies of SARS-CoV-2 multimer+ CD8+ T cells in outpatient (n = 20) and hospitalized patients (n=21). P-value (Mann-Whitney test) = <0.0001. (E) Box plots showing the percentage of SARS-CoV-2 pMHC multimer positive CD8+ T cells expressing the indicated surface markers in outpatients (n=20) and hospitalized patients (n=21). Each dot represents one sample. P-values for hypothesis (Mann-Whitney) test: =0.001 (CD38), =0.036 (CD39), <0.0001 (PD-1), and =0.027 (HLA-DR). (F) Comparison of the frequency of SARS-CoV-2 pMHC multimer+ CD8+ T cells expressing activation markers (CD39, and HLA-DR) and PD-1 in combination with CD38 (as shown in the representative plots (Fig. S8), in hospitalized and outpatient samples. P-values for hypothesis (Mann-Whitney) testing: =0.04 (CD38+ CD39+), = 0.005 (CD38+ HLA-DR+), and <0.0001 (CD38+ PD-1+). (G) Comparison of tetramer binding (conventional single-color tetramers) and functional (cytokine secreting) T cells recognizing the two immunodominant epitopes in 10 patients, grouped according to COVID-19 disease severity.
Fig. 5
Fig. 5. A fraction of SARS-CoV-2 epitopes shares sequence homology with widely circulating common cold coronaviruses.
(A) SARS-CoV-2 T cell immunogenicity map across the viral proteome comparing the distribution of identified SARS-CoV-2 epitopes (patient cohort, orange line; n=16 patients) with the total analyzed peptides (gray line). The height of a peak indicates the number of ligands (right y-axis) analyzed in a particular region and the number of identified epitopes (left y-axis). The lower panel similarly maps epitopes and ligands from healthy donors (green line, n=31 individuals). Positions significantly enriched (p-value <0.05) with epitopes compared to the number of tested ligands are marked with asterisk. (B) T cell epitopes selected based on their immunodominant characteristics either in the patient (orange) or healthy donor (green) cohort, or represented in both (red) is evaluated for their T cell recognition prevalence in both cohorts. (C) Sequence similarity SARS-CoV-2 peptides with the other four common cold coronaviruses (HCoV): HCoV-HKU1, HCoV-NL63, and HCoV-229E. The gray pie chart indicates the sequence similarity of total predicted peptides from SARS-CoV-2 with any one (+1), two (+2), three (+3), or all four (+4) HCoV peptides with a variation limit of up to two amino acids within the full-length peptide. The colored pie chart shows a similar analysis for epitopes detected in the patient (n=16) or healthy donor cohort (combined analysis of HD-1 and HD-2, n=31) for full-length peptide and peptide core. (D) Examples of sequence homology for shared (between patient and healthy donors) and patient-specific T cell epitopes with one or more HCoV peptide sequence. Non-matching amino acids are shown in gray.

References

    1. Coronavirus disease (COVID-19), (available at https://www.who.int/emergencies/diseases/novel-coronavirus-2019).
    1. Caete P. F., Vinuesa C. G., COVID-19 makes B cells forget, but T cells remember. Cell 183, 13–15. (2020). 10.1016/j.cell.2020.09.013 - DOI - PMC - PubMed
    1. Vabret N., Antibody responses to SARS-CoV-2 short-lived. Nat. Rev. Immunol. 20, 519–519. (2020). 10.1038/s41577-020-0405-3 - DOI - PMC - PubMed
    1. Seow J., Graham C., Merrick B., Acors S., Pickering S., Steel K. J. A., Hemmings O., OByrne A., Kouphou N., Galao R. P., Betancor G., Wilson H. D., Signell A. W., Winstone H., Kerridge C., Huettner I., Jimenez-Guardeo J. M., Lista M. J., Temperton N., Snell L. B., Bisnauthsing K., Moore A., Green A., Martinez L., Stokes B., Honey J., Izquierdo-Barras A., Arbane G., Patel A., Tan M. K. I., OConnell L., OHara G., MacMahon E., Douthwaite S., Nebbia G., Batra R., Martinez-Nunez R., Shankar-Hari M., Edgeworth J. D., Neil S. J. D., Malim M. H., Doores K. J., Longitudinal observation and decline of neutralizing antibody responses in the three months following SARS-CoV-2 infection in humans. Nat. Microbiol. 5, 1598–1607. (2020). 10.1038/s41564-020-00813-8 - DOI - PMC - PubMed
    1. Bonifacius A., Tischer-Zimmermann S., Dragon A. C., Gussarow D., Vogel A., Krettek U., Gdecke N., Yilmaz M., Kraft A. R. M., Hoeper M. M., Pink I., Schmidt J. J., Li Y., Welte T., Maecker-Kolhoff B., Martens J., Berger M. M., Lobenwein C., Stankov M. V., Cornberg M., David S., Behrens G. M. N., Witzke O., Blasczyk R., Eiz-Vesper B., COVID-19 immune signatures reveal stable antiviral Tcell function despite declining humoral responses. Immunity 54, 340–354.e6. (2021). 10.1016/j.immuni.2021.01.008 - DOI - PMC - PubMed

Publication types