. 2021 Apr 14;13(589):eabc3961.
doi: 10.1126/scitranslmed.abc3961.

Rituximab-resistant splenic memory B cells and newly engaged naive B cells fuel relapses in patients with immune thrombocytopenia

Affiliations

Rituximab-resistant splenic memory B cells and newly engaged naive B cells fuel relapses in patients with immune thrombocytopenia

Etienne Crickx et al. Sci Transl Med. .

Abstract

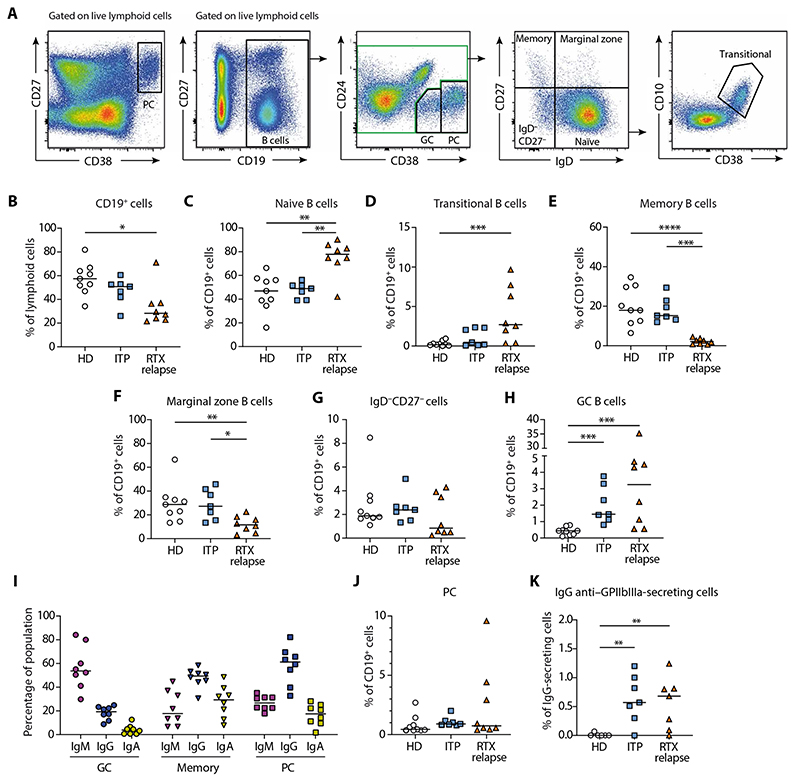
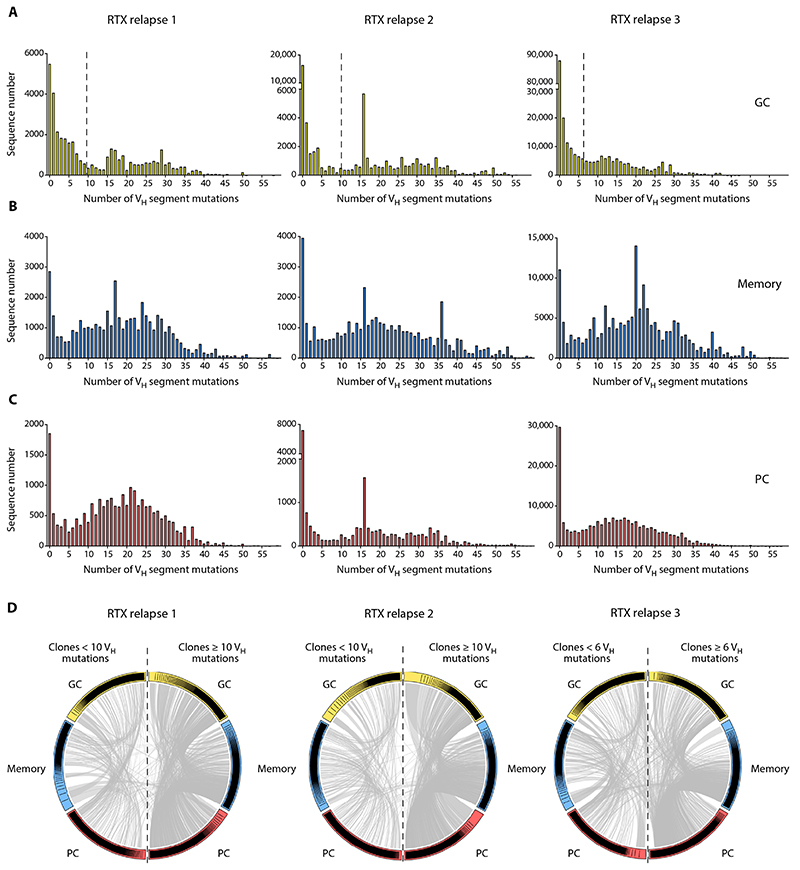
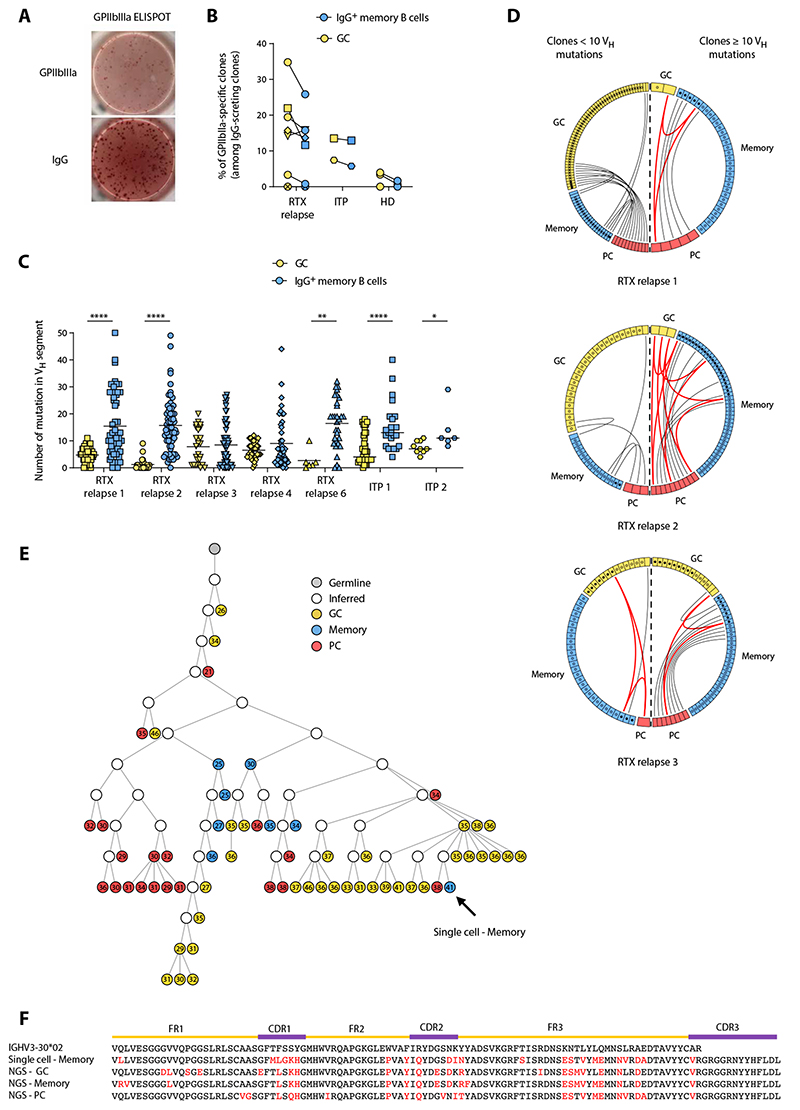
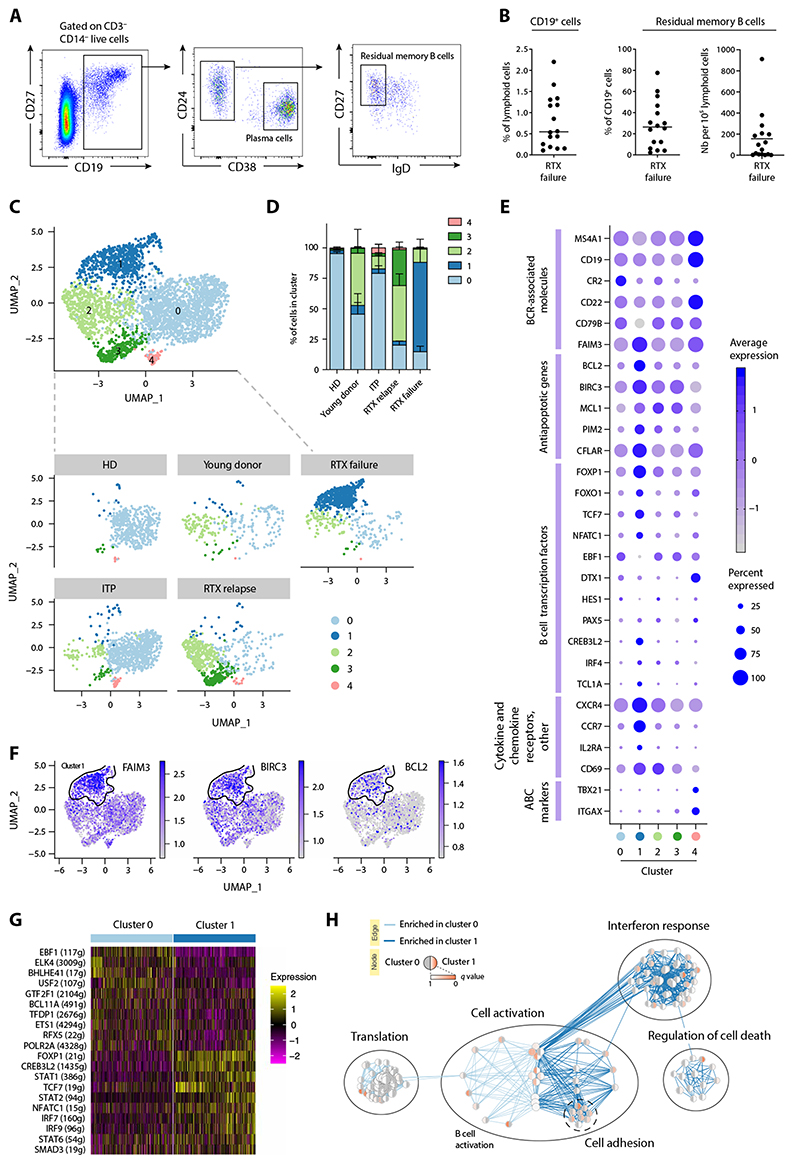
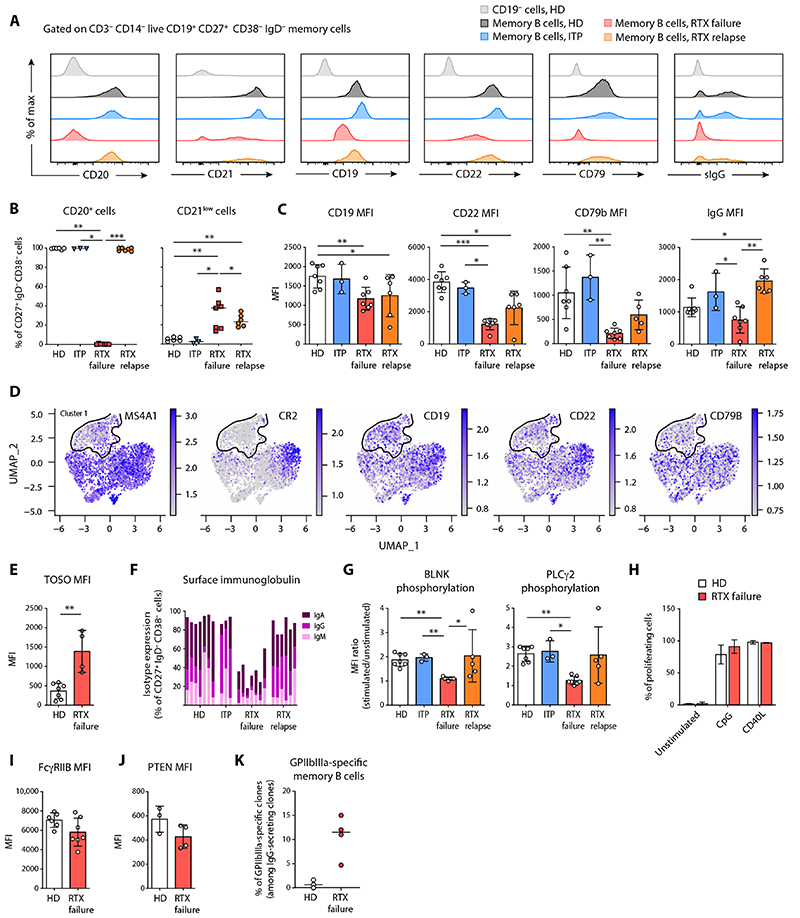
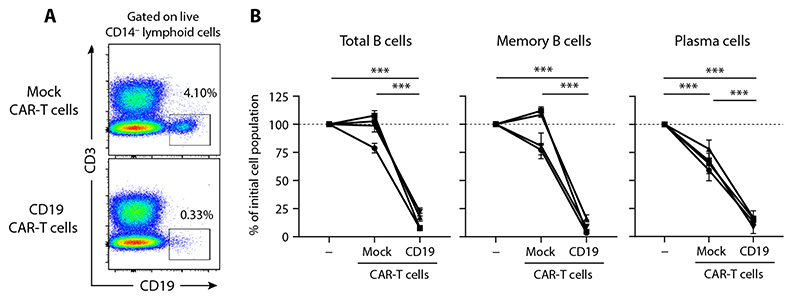
Rituximab (RTX), an antibody targeting CD20, is widely used as a first-line therapeutic strategy in B cell-mediated autoimmune diseases. However, a large proportion of patients either do not respond to the treatment or relapse during B cell reconstitution. Here, we characterize the cellular basis responsible for disease relapse in secondary lymphoid organs in humans, taking advantage of the opportunity offered by therapeutic splenectomy in patients with relapsing immune thrombocytopenia. By analyzing the B and plasma cell immunoglobulin gene repertoire at bulk and antigen-specific single-cell level, we demonstrate that relapses are associated with two responses coexisting in germinal centers and involving preexisting mutated memory B cells that survived RTX treatment and naive B cells generated upon reconstitution of the B cell compartment. To identify distinctive characteristics of the memory B cells that escaped RTX-mediated depletion, we analyzed RTX refractory patients who did not respond to treatment at the time of B cell depletion. We identified, by single-cell RNA sequencing (scRNA-seq) analysis, a population of quiescent splenic memory B cells that present a unique, yet reversible, RTX-shaped phenotype characterized by down-modulation of B cell-specific factors and expression of prosurvival genes. Our results clearly demonstrate that these RTX-resistant autoreactive memory B cells reactivate as RTX is cleared and give rise to plasma cells and further germinal center reactions. Their continued surface expression of CD19 makes them efficient targets for current anti-CD19 therapies. This study thus identifies a pathogenic contributor to autoimmune diseases that can be targeted by available therapeutic agents.


Conflict of interest statement

Competing interests: B.G. served as an expert for AMGEN, Novartis, LFB, and Roche. He received funds for research from AMGEN and Roche. M. Michel received consultancy fees from Amgen, Novartis, and Argenx. M. Mahévas received research funds from GSK. J.-C.W. is a scientific consultant of Institut Merieux. The other authors declare that they have no competing interests.

Figures

Fig. 1
Fig. 1. A GC-derived autoimmune response leads to the generation of IgG anti-GPIIbIIIa plasma cells in the spleen of RTX relapse patients.
(A) Representative dot plots showing gating strategy for flow cytometry analysis of splenic mononuclear cells labeled with antibodies to CD19, CD24, CD27, CD38, and IgD. Plasma cells (PC) were identified as CD27hiCD38hi cells among live lymphoid cells. After gating on CD19+ cells among live lymphoid cells, germinal center (GC) B cells were identified as CD24CD38int. After exclusion of GC and PC (green gate), B cells were further subdivided into CD27+IgD resting memory (memory) B cells, CD27IgD double-negative B cells, CD27+IgD+ marginal zone B cells, and CD27IgD+ naive B cells. Transitional B cells were further identified from naive B cells as CD38hiCD10+. (B to H) Proportion of total splenic B cells (B), naive B cells (C), transitional B cells (D), memory B cells (E), marginal zone B cells (F), CD27IgD B cells (G), and GC B cells (H), in HD (n = 9), patients with ITP (n = 7), and RTX relapse patients (n = 8). (I) Proportion of IgM, IgG, and IgA expressing splenic GC B cells, memory B cell, and PC assessed by flow cytometry analysis after intracellular staining in RTX relapse patients (n = 8). (J) Proportion of splenic PC and (K) frequency of IgG anti–GPIIbIIIa-secreting cells among IgG-secreting cells assessed by ELISPOT assay in HD (n = 6), patients with ITP (n = 7), and RTX relapse patients (n = 7). Kruskall-Wallis and corrections for multiple comparisons were performed. (***P < 0.001, **P < 0.01, and *P < 0.05). Symbols indicate individual samples; horizontal bars represent median values.
Fig. 2
Fig. 2. RTX-resistant and newly generated B cells coexist in the spleen of RTX relapse patients.
(A to C) VH segment mutation distribution in IgM and IgG sequences from (A) splenic GC (yellow), (B) memory (blue), and (C) PC (red) populations from three RTX relapse patients was assessed by high-throughput IgH sequencing. All subpopulations displayed a bimodal distribution with two peaks corresponding to unmutated or lowly mutated cells and highly mutated cells. Dotted vertical lines indicate the threshold used in (D) to discriminate lowly mutated clones and highly mutated clones. (D) Circos plot showing clonal relationships shared between IgM and IgG sequences from GC, memory, and PC splenic populations. According to the mutation distribution in GC shown in (A), clones from each population were classified into “lowly mutated” (left side of the plot) and “highly mutated” (right side of the plot) based on the clone median mutation number. Each colored sector represents one subpopulation and is divided into segments representing individual clones in rank-sized order. The gray internal connections show clones common to multiple subpopulations.
Fig. 3
Fig. 3. GPIIbIIIa-specific B cells are found in both RTX-resistant and newly generated B cell populations.
(A) Representative GPIIbIIIa and IgG ELISPOT from a GPIIbIIa-specific clone obtained after single-cell culture of sorted memory B cell from a patient with relapse after RTX. (B) Frequency of GPIIbIIIa-specific clones among GC (yellow) and IgG memory B cell (blue) populations in RTX relapse patients, patients with ITP, and HD. The total number of tested cells is provided in table S2. RTX relapse patient 8 was not tested because of low culture yield. (C) Number of mutations in the VH segment for individual GPIIbIIIa-specific GC (yellow) and IgG memory (blue) B cells from RTX relapse patients #1, #2, #3, #4, and #6 and from two patients with ITP. Two-tailed Mann-Whitney tests (****P < 0.0001, **P < 0.01, and *P < 0.05). Symbols indicate individual cells; horizontal bars represent mean values. (D) Circos plot showing clonal relationships between individual sequences from GPIIbIIIa-specific GC or IgG+ memory B cells and sequences obtained from high-throughput IgH analysis of RTX relapse patients #1, #2, and #3. Each colored sector represents one subpopulation and is divided into segments representing individual clones. Each circle represents a sequence originating from GPIIbIIIa B cells and is filled with black if the sequence was found in high-throughput IgH sequencing data from the same subpopulation. The internal connections show clones shared by two or three subpopulations, depicted in gray or red, respectively. According to the mutation distribution in GC shown in Fig. 2, clones from each population were classified into lowly mutated (left side of the plot) and highly mutated (right side of the plot) based on the clone mutation number (median clone mutation number was used for clones from high-throughput IgH sequencing data). Only clonal relationships shared between individual sequences and high-throughput IgH analysis data are shown. (E) Phylogenetic analysis of a representative clone from the high-throughput IgH sequencing data that includes one of the anti-GPIIbIIIa memory B cell isolated from RTX relapse patient #1. Germline sequence is represented in gray, GC in yellow, memory B cells in blue, and PC in red, and open circles represent inferred precursors. The number of mutations in VH segment is indicated in each circle. All sequences are of the IgG isotype. The arrow indicates the position in the tree of the anti-GPIIbIIIa memory B cell. (F) Alignment of representative sequences from the clone shown in (E); amino acid changes from the germline are shown in red.
Fig. 4
Fig. 4. RTX failure patients harbor a distinct RTX-resistant memory B cell population with a unique transcriptional program.
(A) Representative dot plots showing the gating strategy for flow cytometry analysis of splenic mononuclear cells labeled with antibodies to CD3, CD14, CD19, CD24, CD27, CD38, and IgD. After gating on CD19+ B cells among live CD3CD14 lymphoid cells, memory B cells were identified as CD24+ CD38IgD and PC as CD27+CD24CD38hi. (B) Proportion of CD19+ B cells (left), residual memory B cells (middle), and number of residual memory B cells (right) in the spleen of RTX failure patients (n = 16). (C to H) Single-cell RNA sequencing was performed after single-cell sorting of memory B cells from healthy donors (HD), young donors, patients with ITP, RTX relapse patients, and RTX failure patients (SORT-seq) and analyzed using the Seurat R pipeline. (C) UMAP and cluster attributions after graph-based clustering (Louvain) of all sorted memory B cells (resolution = 0.6) (top) or memory B cells from each individual donor or patient’s group (bottom). (D) Repartition of single memory B cells in each cluster according to donor type. (E) Dot plots showing a selection of differentially expressed genes between cluster 1 and other clusters. Each dot size is proportional to the number of cells expressing this gene and is colored according to the average expression of that gene in a given cluster. ABC: Atypical B cells (F) Feature plots showing differential gene expression for each cell from all donors for a selection of genes up-regulated in cluster 1. The outline of cluster 1 (highly enriched for RTX-failure memory B cells) is displayed. (G) Heatmap showing the scaled expression (row-normalized area under the curve score) of the top 10 most significantly up-regulated SCENIC regulons in clusters 0 and 1. (H) Pathway enrichment analysis based on gene up- and down-regulated in cluster 1 as compared to cluster 0 resting memory B cells. Each dot represents a unique gene set and is colored on the basis of the P value of its enrichment in cluster 0 (left side) or cluster 1 (right side).
Fig. 5
Fig. 5. RTX-resistant memory B cells have a unique surface phenotype and contain autoreactive clones.
(A) Representative overlays of surface markers assessed by flow cytometry expressed on CD19 cells from HD (light gray), memory B cells from HD (dark gray), memory B cells from patients with ITP (blue), memory B cells from RTX relapse patients (orange), and residual memory B cells from RTX failure patients (red). (B) Proportions of CD20+ cells and CD21low cells and (C) median fluorescence intensities (MFIs) ± SD of CD19, CD22, CD79b, and IgG in memory B cells from HD (n = 6), ITP (n = 3), RTX relapse (n = 7), and RTX failure (n = 7) patients. (D) Feature plots showing differential gene expression for each single cell (see Fig. 4) from all donors for CD20 (MS4A1), CD21 (CR2), CD19, CD22, and CD79b. The outline of cluster 1 (highly enriched for RTX-failure memory B cells) is displayed. (E) MFIs ± SD of TOSO in memory B cells from HD (n = 3) and RTX failure (n = 3) patients. (F) Cumulative proportions of surface IgM, IgG, and IgA in memory B cells from HD, ITP, and RTX failure patients. Each bar represents one patient. (G) BLNK and PLCγ2 phosphorylation assessed by stimulating total splenocytes from HD, ITP, and RTX failure patients with anti-IgG/A/M antibodies. Ratio of MFI ± SD from stimulated over nonstimulated cells are indicated for each group. (H) Splenocytes from HD (n = 3) and RTX failure patients (n = 3) were stimulated by CpG or CD40L and interleukin-21 (IL-21), IL-2, IL-4, and B cell activating factor. Percentage of proliferating memory B cells was assessed after 5 days of culture with cell proliferation dye eFluor 450. (I and J) MFIs ± SD of FCγRIIB (I) and PTEN (J) in memory B cells from HD (n = 3) and RTX failure (n = 3) patients. (K) Frequency of GPIIbIIIa-specific clones among memory B cells in RTX failure patients (red) and HD (green). The total number of tested cells is given in table S2. Kruskall-Wallis with corrections for multiple comparisons or two-tailed Mann-Whitney tests were performed. (***P < 0.001, **P < 0.01, and *P < 0.05). Symbols indicate individual samples; horizontal bars represent median values.
Fig. 6
Fig. 6. RTX-resistant memory B cells can be depleted in vitro by targeting CD19.
(A) Representative flow cytometry analysis of CD3-depleted splenocytes from a RTX failure patient after overnight incubation with either CD19 CAR-T cells or mock CAR-T cells. (B) Percentage of the remaining CD19+ B cells (left), CD19+CD38 memory B cells (middle), and CD19+CD38+ PC (right) after overnight incubation in each condition. n = 4 RTX failure patients analyzed in triplicate, two independent experiments. Data are presented as means ± SD. CD19+ cells without CAR-T cells were used as a reference for calculating percentages. Two-way analysis of variance (ANOVA) tests were performed (***P < 0.001).

References

    1. Dörner T, Lipsky PE. B cells: Depletion or functional modulation in rheumatic diseases. Curr Opin Rheumatol. 2014;26:228–236. - PubMed
    1. Huang H, Benoist C, Mathis D. Rituximab specifically depletes short-lived autoreactive plasma cells in a mouse model of inflammatory arthritis. Proc Natl Acad Sci USA. 2010;107:4658–4663. - PMC - PubMed
    1. Khellaf M, Charles-Nelson A, Fain O, Terriou L, Viallard J-F, Cheze S, Graveleau J, Slama B, Audia S, Ebbo M, Le Guenno G, et al. Safety and efficacy of rituximab in adult immune thrombocytopenia: Results from a prospective registry including 248 patients. Blood. 2014;124:3228–3236. - PubMed
    1. Patel VL, Mahévas M, Lee SY, Stasi R, Cunningham-Rundles S, Godeau B, Kanter J, Neufeld E, Taube T, Ramenghi U, Shenoy S, et al. Outcomes 5 years after response to rituximab therapy in children and adults with immune thrombocytopenia. Blood. 2012;119:5989–5995. - PMC - PubMed
    1. Lioger B, Edupuganti SR, Mulleman D, Passot C, Desvignes C, Bejan-Angoulvant T, Thibault G, Gouilleux-Gruart V, Mélet J, Paintaud G, Ternant D. Antigenic burden and serum IgG concentrations influence rituximab pharmacokinetics in rheumatoid arthritis patients. Br J Clin Pharmacol. 2017;83:1773–1781. - PMC - PubMed

Publication types

Substances

LinkOut - more resources