. 2021 Apr 14;12(4):403.
doi: 10.1038/s41419-021-03687-8.

Spine impairment in mice high-expressing neuregulin 1 due to LIMK1 activation

Affiliations

Spine impairment in mice high-expressing neuregulin 1 due to LIMK1 activation

Peng Chen et al. Cell Death Dis. .

Abstract

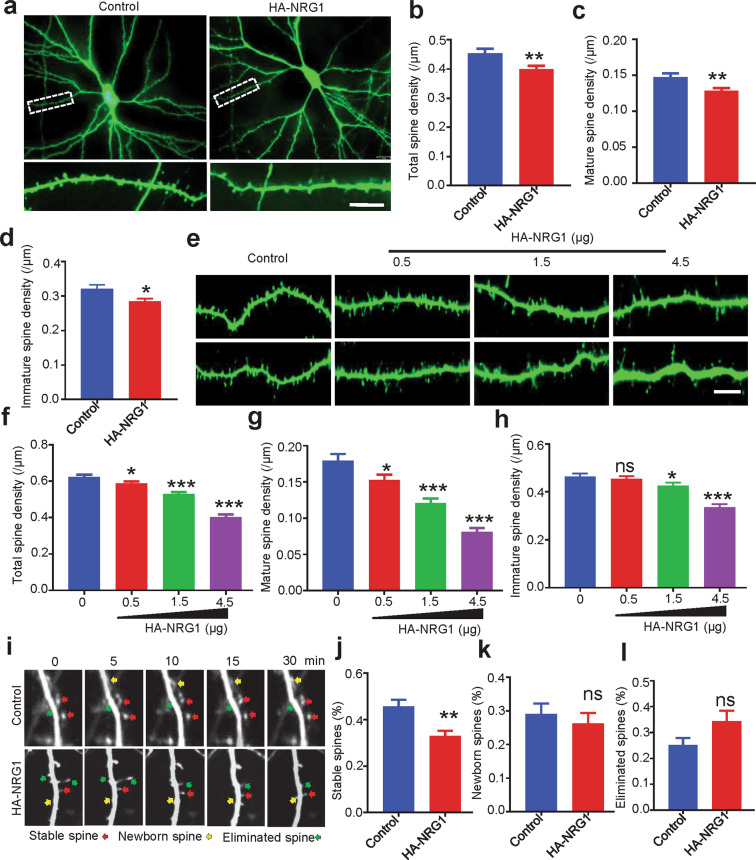
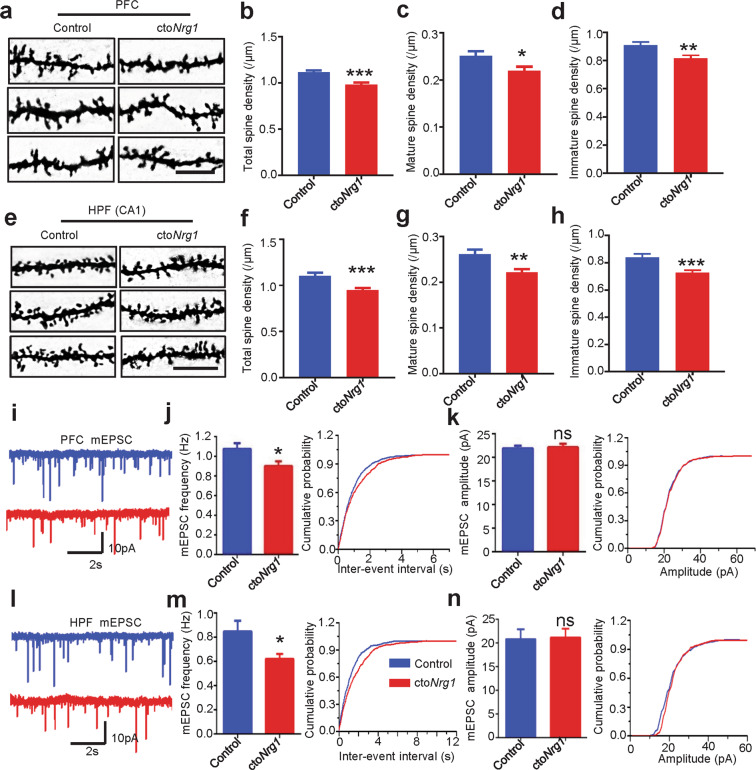
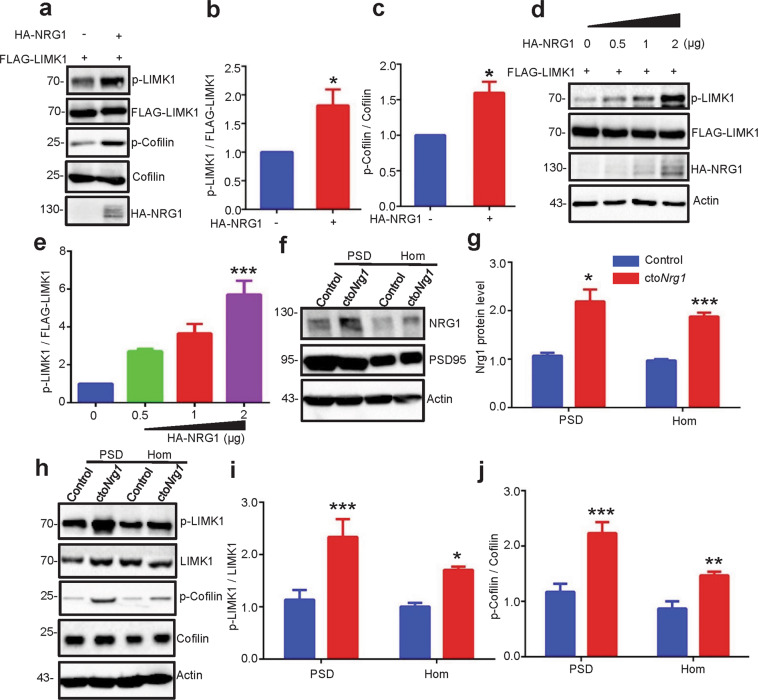
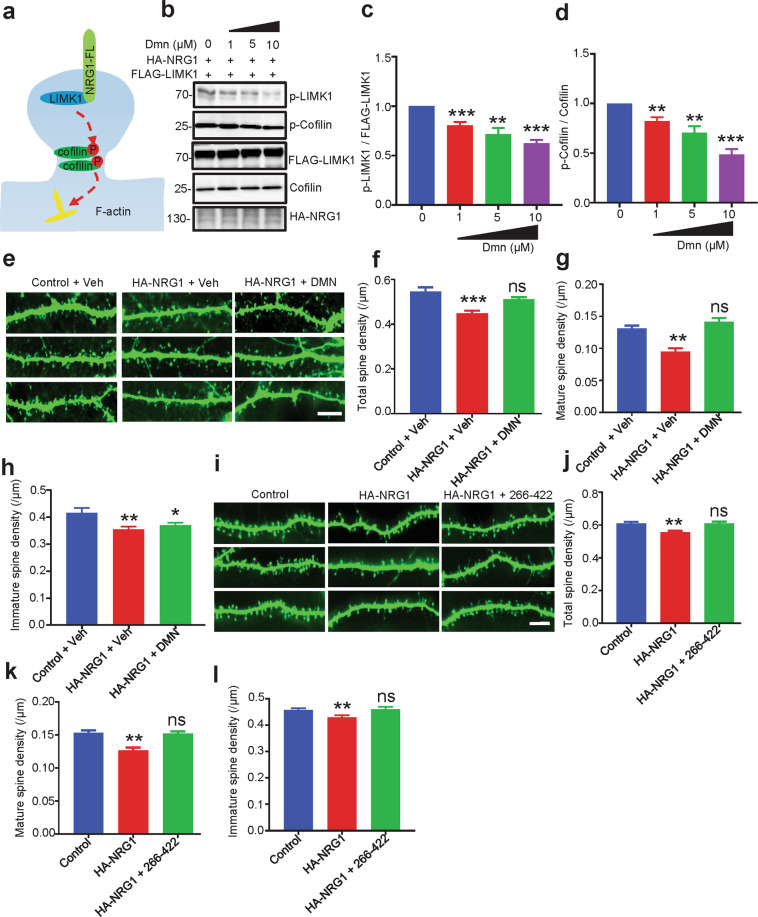
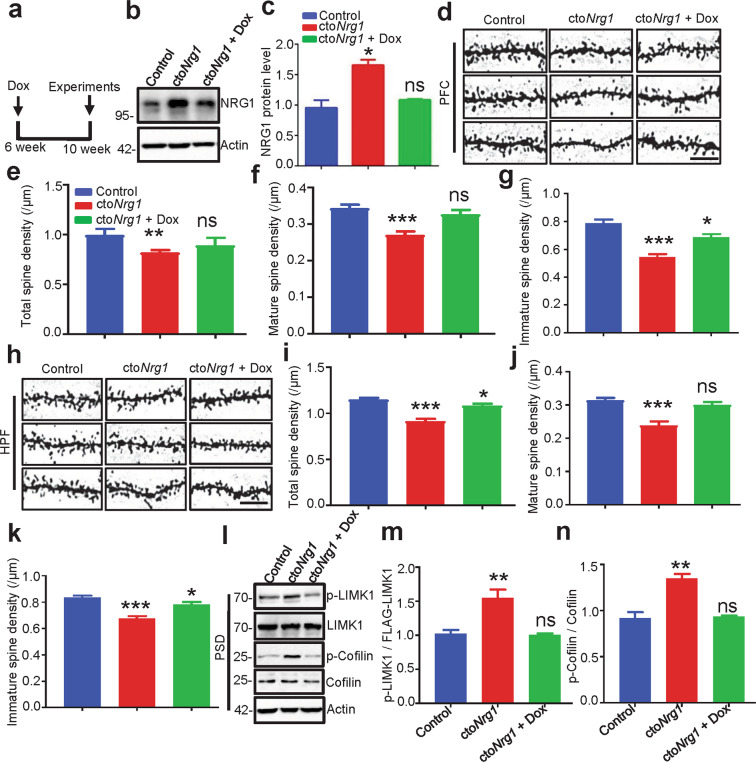
The genes encoding for neuregulin1 (NRG1), a growth factor, and its receptor ErbB4 are both risk factors of major depression disorder and schizophrenia (SZ). They have been implicated in neural development and synaptic plasticity. However, exactly how NRG1 variations lead to SZ remains unclear. Indeed, NRG1 levels are increased in postmortem brain tissues of patients with brain disorders. Here, we studied the effects of high-level NRG1 on dendritic spine development and function. We showed that spine density in the prefrontal cortex and hippocampus was reduced in mice (ctoNrg1) that overexpressed NRG1 in neurons. The frequency of miniature excitatory postsynaptic currents (mEPSCs) was reduced in both brain regions of ctoNrg1 mice. High expression of NRG1 activated LIMK1 and increased cofilin phosphorylation in postsynaptic densities. Spine reduction was attenuated by inhibiting LIMK1 or blocking the NRG1-LIMK1 interaction, or by restoring NRG1 protein level. These results indicate that a normal NRG1 protein level is necessary for spine homeostasis and suggest a pathophysiological mechanism of abnormal spines in relevant brain disorders.


Conflict of interest statement

The authors declare no competing interests.

Figures

Fig. 1
Fig. 1. Reduced dendritic spine density in high-expressing NRG1 neurons.
a Representative images of neuronal morphology and spine density in hippocampal pyramidal neurons. Neurons were isolated at embryonic 18 (E18) rat to culture for 9 days and transfected with 1.5 µg control (empty HA vector) or HA-NRG1 construct, and fixed for staining at DIV17. Scale bar, 10 μm. Statistical analysis of data in a for total (b), mature (c) and immature (d) spine density. N = 32 neurons for control, N = 45 neurons for HA-NRG1 (p = 0.0066 for total spine density; p = 0.0048 for mature spine density; p = 0.0109 for immature spine density). *p < 0.05, and **p < 0.01; Student’s t-test. e Representative images of spine density in hippocampal neurons transfected with HA-NRG1 in gradient. Scale bar, 10 μm. fh The statistical results for total (f), mature (g) and immature (h) spine density. N = 28 neurons for control, N = 32 neurons for 0.5 μg HA-NRG1, N = 31 neurons for 1.5 μg, N = 34 neurons for 4.5 μg (p = 0.0169 for 0.5 μg, p < 0.001 for 1.5 μg and 4.5 μg for total spines; p = 0.0251 for 0.5 μg, p < 0.001 for 1.5 and 4.5 μg for mature spines; p = 0.6044 for 0.5 μg, p = 0.0446 for 1.5 μg and p < 0.001 for 4.5 μg for immature spines). Data were shown as mean ± SEM; *p < 0.05, **p < 0.01, and ***p < 0.001, one-way ANOVA. i Representative images of time-lapse imaging from hippocampal neurons transfected with HA-NRG1 or control taken at five adjacent time points during the 30-min live-imaging period. Cultured neurons were transfected with indicated constructs at DIV9 and imaged every minute for 30-min at DIV17. N = 10 neurons for control, N = 11 neurons for HA-NRG1. jl Quantitative analysis for percentages of stable (red arrow), newborn (yellow arrow) and eliminated (green arrow) spines. p = 0.003 for stable spines, p = 0.571 for newborn spines, and p = 0.07 for eliminated spines. Data were shown as mean ± SEM; **p < 0.01; ns, p > 0.05; Student’s t-test.
Fig. 2
Fig. 2. Reduced spine density and glutamatergic transmission in ctoNrg1 mice.
a, e Representative Golgi staining images of apical dendrites of pyramidal neurons in PFC and HPF. Scale bars,10 μm. bd and fh Quantitative analysis of total (b and f), mature (c and g) and immature (d and h) spine densities in a and e. N = 5 mice for each genotype (p = 0.0017 for total, p = 0.0162 for mature and p = 0.0028 for immature spine in PFC; p = 0.004 for total spine, p = 0.0012 for mature and p = 0.005 for immature spine in HPF). Data were shown as mean ± SEM; *p < 0.05, **p < 0.01, and ***p < 0.001; Student’s t-test. i, l Representative traces of mEPSCs from pyramidal neurons of PFC prelimbic (PrL) and HPF CA1. Scale bars, 10 pA, 2 s. j, k and m, n Histogram summary and cumulative probability plots of mEPSC interevent intervals (j and m) and amplitude (k and n) in i and l. N = 13 neurons from three control mice, N = 12 neurons from 3 ctoNrg1 mice in PrL region (p = 0.0316 for frequency, p = 0.7892 for amplitude); N = 14 neurons from three control mice, N = 15 neurons from 3 ctoNrg1 mice in CA1 region (p = 0.0197 for frequency, p = 0.6902 for amplitude). Data were shown as mean ± SEM. *p < 0.01; Student’s t-test.
Fig. 3
Fig. 3. Activation of LIMK1 by NRG1 overexpression.
ac NRG1 overexpression increased phosphorylations of LIMK1 and its downstream Cofilin in HEK293 cells. HEK293 cells were co-transfected with FLAG-LIMK1 and 1.5 µg HA-NRG1 or HA empty vector and subjected to WB with indicated antibodies (a). The relative intensities of phosphorylated LIMK1 (p-LIMK1, Thr505) to FLAG-LIMK1 (b) and of phosphorylated Cofilin (p-Cofilin, Ser3) to Cofilin (c) from three independent experiments were quantified (p = 0.0432 for p-LIMK1; p = 0.0185 for p-Cofilin). Data were shown as mean ± SEM. *p < 0.05, Student’s t-test. d, e NRG1 overexpression increased LIMK1 phosphorylation in a dose-dependent manner. FLAG-LIMK1 were co-transfected with different amounts of HA-NRG1 in gradient into HEK293 cells for WB with indicated antibodies. Actin served as a loading control (d). Quantitative analysis of relative p-LIMK1 levels in d (p < 0.001 for 0.5, 1, 2 µg in p-LIMK1) (e). Data were from three independent experiments and shown as mean ± SEM. ***p < 0.001, one-way ANOVA. f, g NRG1 level was increased in the PSDs of ctoNrg1 mice. Aliquots of whole brain homogenates (Hom. Whole-cell lysates) and PSD fractions from cto Nrg1 and control mice were probed for NRG1, PSD95 (a PSD marker) and actin (f). Quantitative analysis of NRG1 levels in f (g). hj Phosphorylations of LIMK1 and Cofilin were increased in PSD of ctoNrg1 mice. Representative images of WB with indicated antibodies (h). Quantitative analysis of relative p-LIMK1 (i) and p-Cofilin (j) levels in h. N = 9 mice for each genotype (p = 0.004 in Hom, p = 0.0111 in PSD for NRG1 level in g; p = 0.0176 in Hom, p = 0.004 in PSD for p-LIMK1 in i; p = 0.0088 in Hom, p = 0.0005 in PSD for p-Cofilin in j). Data were shown as mean ± SEM. *p < 0.05, **p < 0.01, and ***p < 0.001, Student’s t-test.
Fig. 4
Fig. 4. Requirement of NRG1–LIMK1 interaction for LIMK1 activation.
a Schematic illustration of constructs with different NRG1 domain structures. ECD, extracellular domain; TM, transmembrane domain; ICD, intracellular domain; FL, full length; △266–422, deletion of amino acids 266–422. b NRG1 266-422 domain was necessary for NRG1-LIMK1 interaction. HA-FL, HA-△266–422 or HA empty vector were co-transfected with FLAG-LIMK1 into HEK293 cells for immunoprecipitation (IP) with anti-FLAG antibody. c, d NRG1 266-422 domain was sufficient for NRG1-LIMK1 interaction. Myc-tagged ICD (c) or 266-422 (d) were co-transfected with FLAG-LIMK1 into HEK293 cells for IP with anti-FLAG antibody. eh NRG1 266-422 fragment blocked NRG1–LIMK1 interaction, but not LIMK1 activation. Different amounts of Myc-266-422 were co-transfected with Myc-ICD and FLAG-LIMK1 into HEK293 cells for IP with anti-FLAG antibody (e). Quantitative analysis of relative co-IPed NRG1-ICD protein levels in e (f) (p = 0.03405 for 0.5 µg, p = 0.01204 for 1.5 µg). Data were from three independent experiments and shown as mean ± SEM. *p < 0.05, one-way ANOVA. HEK293 cells were co-transfected with FLAG-LIMK1 and Myc-266–422 or Myc empty vector for WB with indicated antibodies (g). Quantitative analysis of relative p-LIMK1 in g (h) (p = 0.6322 for Myc-266–422). ns: p > 0.05, Student’s t-test. Data were from three independent experiments and shown as mean ± SEM. i, j NRG1 without 266-422 domain could not activate LIMK1. HA-FL, HA-△266–422 or HA empty vector were co-transfected with FLAG-LIMK1 into HEK293 cells for WB with indicated antibodies (i). Quantitative analysis of relative p-LIMK1 in i (j) (p = 0.2095 for HA-△266–422, p = 0.0162 for HA-FL). Data were from three independent experiments and shown as mean ± SEM. ns: p > 0.05, *p < 0.05, one-way ANOVA.
Fig. 5
Fig. 5. Reduced spine deficiency by LIMK1 inhibition and by blocking NRG1–LIMK1 interaction.
a A working model shows NRG1 interacted with and activated LIMK1 to affect dendritic spine development in the PSD. b–d NRG1-induced LIMK1 activation was inhibited by LIMK1 inhibitor Dmn. HEK293 cells co-transfected with HA-NRG1 and FLAG-LIMK1 were treated with different concentrations of Dmn for 4 h and subjectd to WB with indicate antibodies (b). Quantitative analysis of relative p-LIMK1 (c) and p-Cofilin (d) levels in b (p = 0.0009 for 1 µM, p = 0.004 for 5 µM, p < 0.001 for 10 µM in p-LIMK1; p = 0.0038 for 1 µM, p = 0.0036 for 5 µM, p < 0.001 for 10 µM in p-Cofilin). Data were shown as mean ± SEM. *p < 0.05, **p < 0.01, ***p < 0.001, one-way ANOVA. eh Spine deficiency in NRG1 high-expressing neurons was rescued by Dmn treatment. Representative images of dendritic spines of cultured neurons. Scale bar, 10 μm (e). Primary hippocampal neurons were transfected with HA-NRG1 or control at DIV9 and treated with 10 µM Dmn or its vehicle DMSO for 12 h. Quantitative analysis of total (f), mature (g), and immature (h) spine densities in e. N = 21 neurons for control + Veh; N = 24 neurons for HA-NRG1 + Veh; N = 27 neurons for HA-NRG1 + Dmn (p < 0.001 for HA-NRG1 + Veh, p = 0.0581 for HA-NRG1 + Dmn in total spine; p < 0.001 for HA-NRG1 + Veh, p = 0.2183 for HA-NRG1 + Dmn in mature spine; p = 0.0037 for HA-NRG1 + Veh in immature spine, p = 0.0117 for HA-NRG1 + Dmn in immature spine). Data were shown as mean ± SEM. **p < 0.01, ***p < 0.001, one-way ANOVA. il Spine deficiency in NRG1 high-expressing neurons was rescued by NRG1 266-422 fragment. Representative images of dendritic spines of cultured neurons (i). Scale bar, 10 μm. Hippocampal neurons (DIV9) were transfected with HA-NRG1 or HA-NRG1 plus 266-422, and fixed at DIV17 for immunostaining. Quantitative analysis of total (j), mature (k) and immature (l) spine densities in i. N = 27 neurons for control, N = 35 for HA-NRG1, N = 29 neurons for HA-NRG1 + 266-422 (p = 0.006 for HA-NRG1, p = 0.9457 for HA-NRG1 + 266–422 in total spine; p = 0.0015 for HA-NRG1, p = 0.8421 for HA-NRG1 + 266–422 in mature spine; p = 0.007 for HA-NRG1, p = 0.8374 for HA-NRG1 + 266–22 in immature spine). Data were shown as mean ± SEM. ns, p > 0.05, **p < 0.01, and ***p < 0.001, one-way ANOVA.
Fig. 6
Fig. 6. Rescued spine deficiency in ctoNrg1 mice by restoring NRG1 level.
a Schematic schedule of Dox treatment. Male 6-week ctoNrg1 mice were treated with Dox or water for 4 weeks and subjected to WB and Golgi staining. b, c Increased NRG1 level in the forebrain of ctoNrg1 mice was restored after Dox treatment. Forebrain lysates from ctoNrg1, ctoNrg1 treated with Dox or control mice were probed with anti-NRG1 antibody. Quantification of NRG1 level (c), N = 3 mice for each group (p = 0.0101 for ctoNrg1, p = 0.363 for ctoNrg1 + Dox). Data were shown as mean ± SEM. *p < 0.05, one-way ANOVA. dk Reduced spine densities in PFC (dg) and HPF (hk) of ctoNrg1 mice were rescued after Dox treatment. Representative Golgi staining images for spine densities in control, ctoNrg1, and ctoNrg1 + dox mice. Scale bar, 10 μm (d and h). Quantitative analysis of total (e and i), mature (f and j) and immature (g and k) spine densities in d and h. N = 3 mice for each group (In PFC: p < 0.001 for ctoNrg1 and p = 0.2265 for ctoNrg1 + Dox for total spine, p < 0.001 for ctoNrg1 and p = 0.5548 for ctoNrg1 + Dox for mature spine, p < 0.0001 for ctoNrg1 and p = 0.013 for ctoNrg1 + Dox for immature spine; in HPF: p < 0.001 for ctoNrg1 and p = 0.0182 for ctoNrg1 + Dox for total spine, p < 0.001 for ctoNrg1 and p = 0.2532 for ctoNrg1 + Dox for mature spine, p < 0.0001 for ctoNrg1 and p = 0.0259 for ctoNrg1 + Dox for immature spine). Data were shown as mean ± SEM. *p < 0.05, **p < 0.01, and ***p < 0.001, one-way ANOVA. ln LIMK1 and Cofilin phosphorylation in PSDs of ctoNrg1 were restored after Dox treatment. PSD fractions of control, ctoNrg1, and ctoNrg1 + Dox mice were probed with indicated with antibodies (l). Quantitative analysis of relative levels of p-LIMK1 and p-Cofilin in l (m, n). N = 5 mice for each group (p = 0.0087 for ctoNrg1, p = 0.7758 for ctoNrg1 + Dox in p-LIMK1; p = 0.0019 for ctoNrg1, p = 08239 for ctoNrg1 + Dox in p-Cofilin). Data were shown as mean ± SEM. **p < 0.01 and ns, p > 0.5. one-way ANOVA.

References

    1. Mei L, Nave KA. Neuregulin-ERBB signaling in the nervous system and neuropsychiatric diseases. Neuron. 2014;83:27–49. doi: 10.1016/j.neuron.2014.06.007. - DOI - PMC - PubMed
    1. Pinkas-Kramarski R, et al. Brain neurons and glial cells express Neu differentiation factor/heregulin: a survival factor for astrocytes. Proc. Natl Acad. Sci. USA. 1994;91:9387–9391. doi: 10.1073/pnas.91.20.9387. - DOI - PMC - PubMed
    1. Corfas G, Rosen KM, Aratake H, Krauss R, Fischbach GD. Differential expression of Aria Isoforms in the rat-brain. Neuron. 1995;14:103–115. doi: 10.1016/0896-6273(95)90244-9. - DOI - PubMed
    1. Lu HS, et al. Studies on the structure and function of glycosylated and nonglycosylated neu differentiation factors. Similarities and differences of the alpha and beta isoforms. J. Biol. Chem. 1995;270:4784–4791. doi: 10.1074/jbc.270.9.4784. - DOI - PubMed
    1. Chuah MI, et al. Glial growth factor 2 induces proliferation and structural changes in ensheathing cells. Brain Res. 2000;857:265–274. doi: 10.1016/S0006-8993(99)02455-5. - DOI - PubMed

Publication types