. 2021 Apr 14;12(1):2244.
doi: 10.1038/s41467-021-22471-y.

Ferroptotic cell death triggered by conjugated linolenic acids is mediated by ACSL1

Affiliations

Ferroptotic cell death triggered by conjugated linolenic acids is mediated by ACSL1

Alexander Beatty et al. Nat Commun. .

Abstract

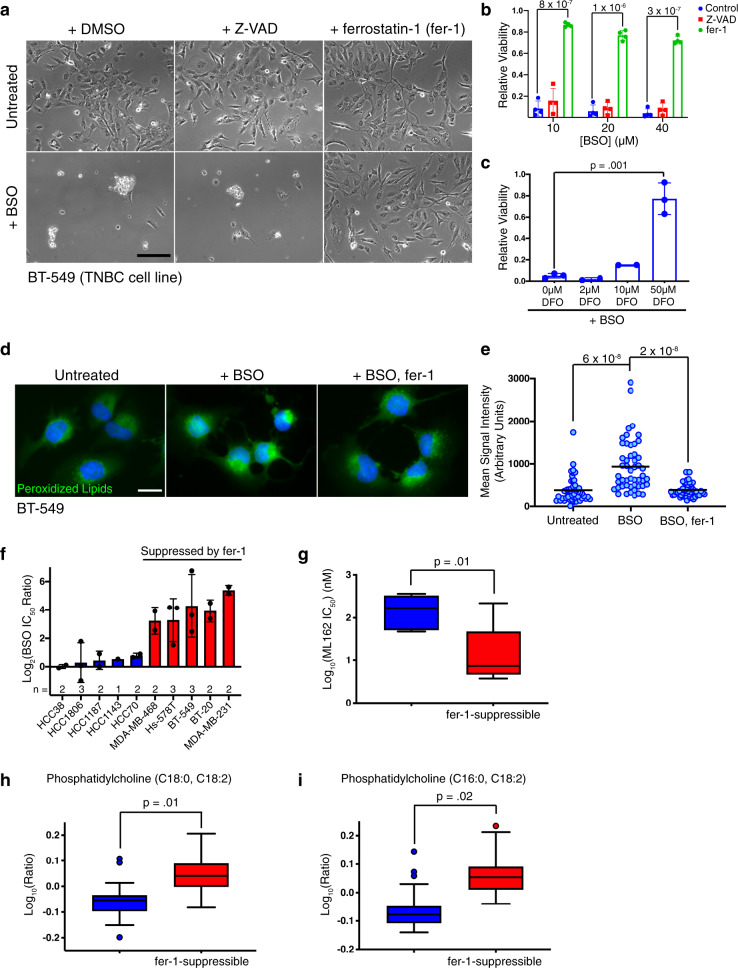
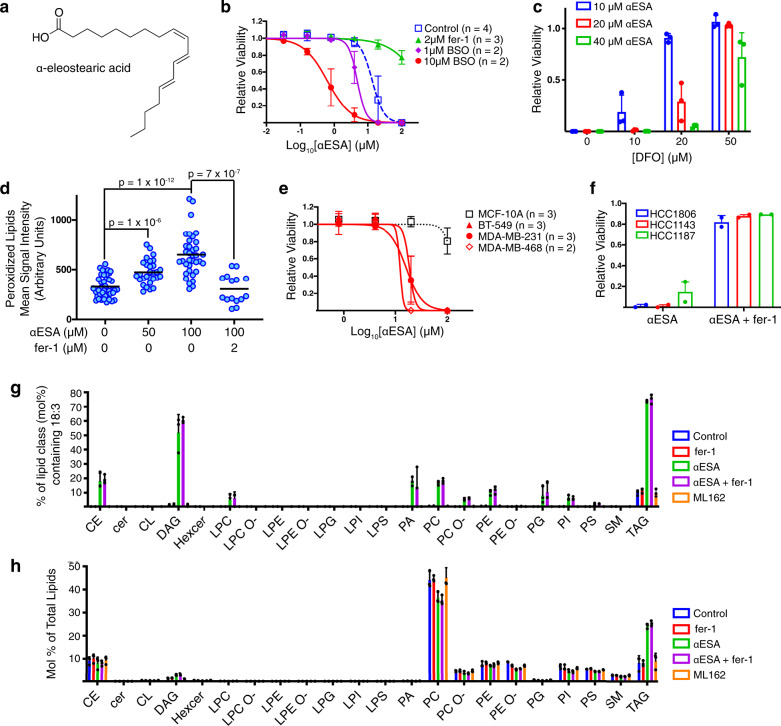
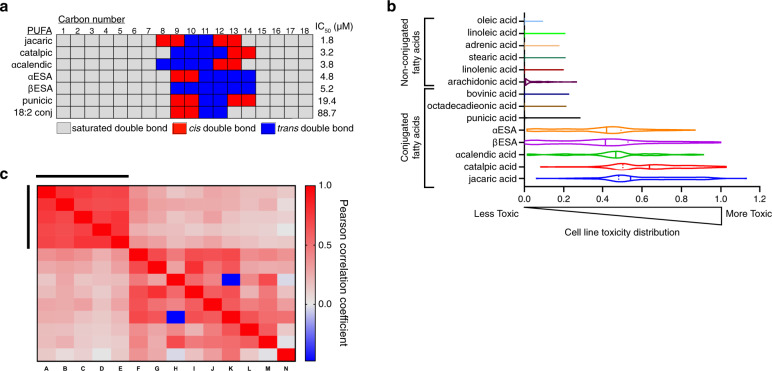
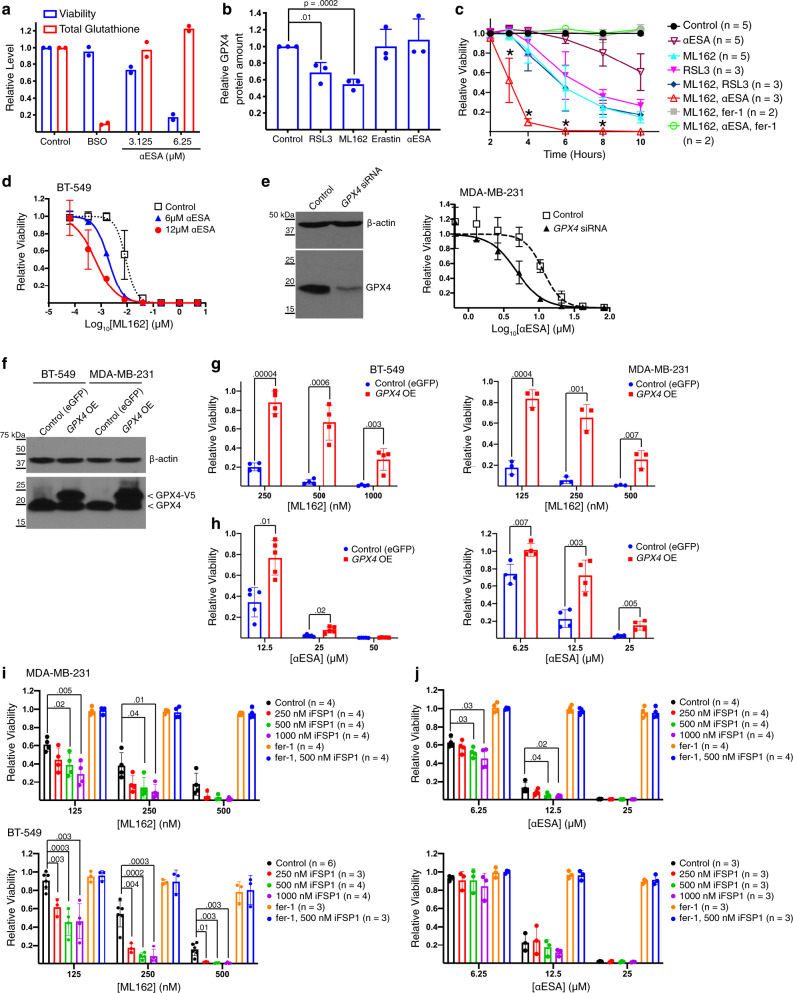
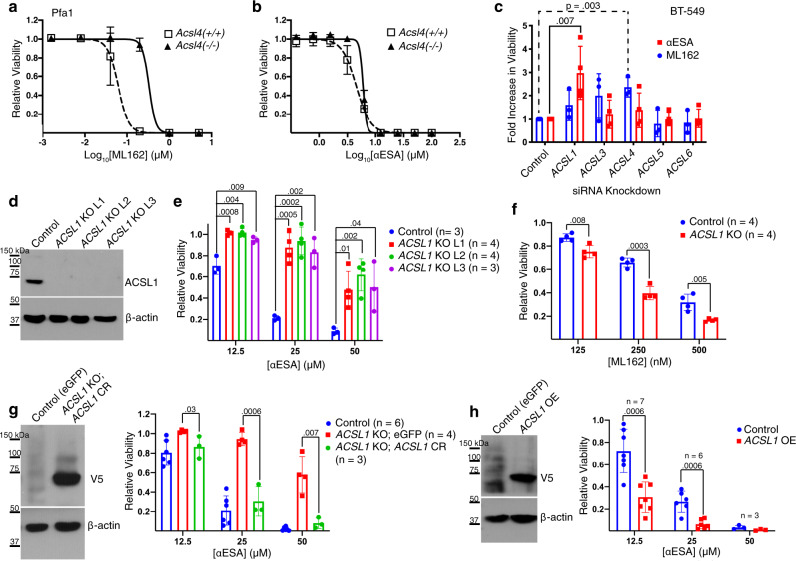
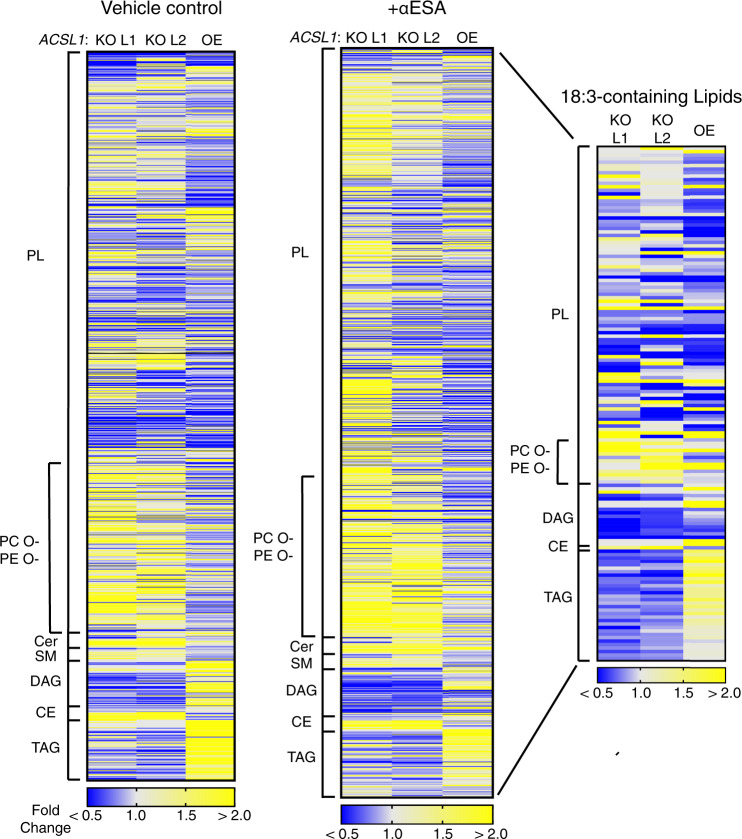
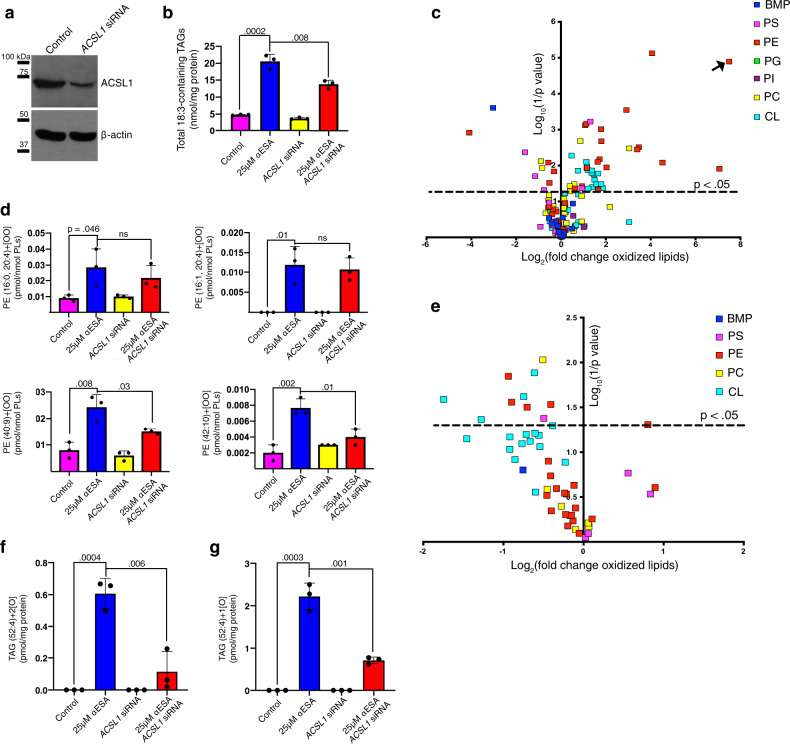
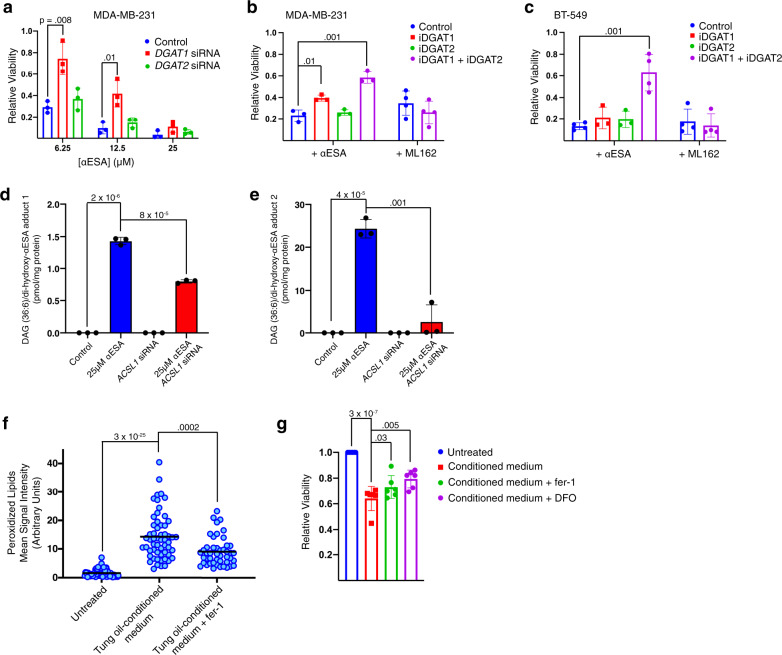
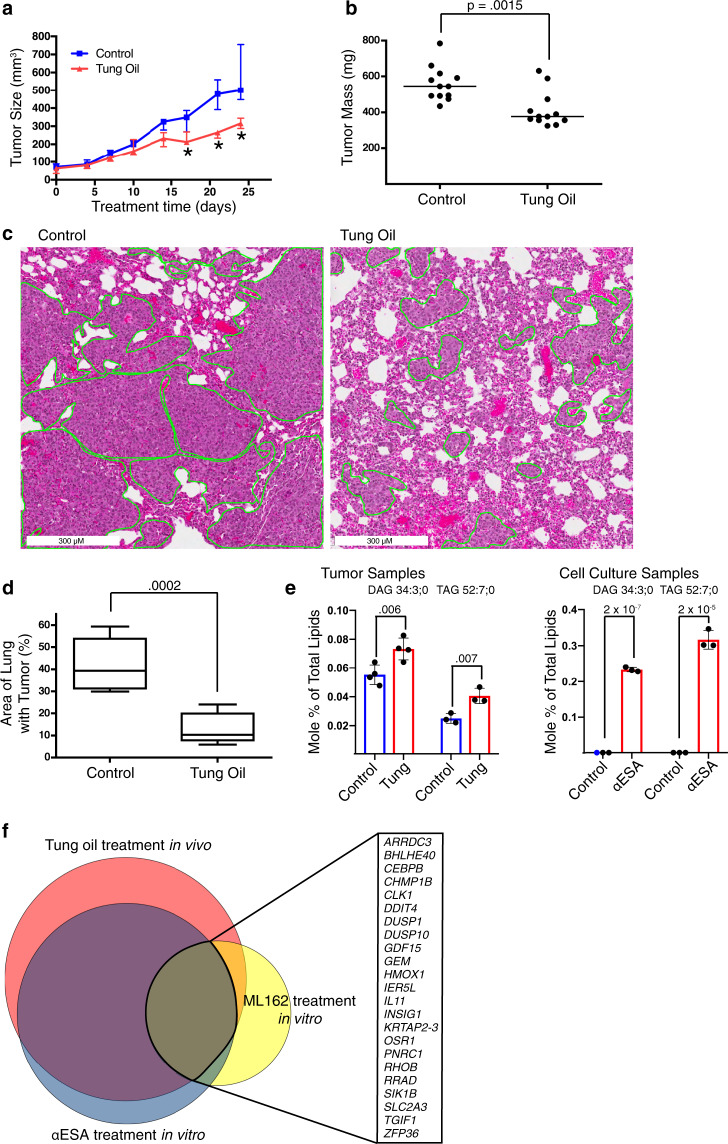
Ferroptosis is associated with lipid hydroperoxides generated by the oxidation of polyunsaturated acyl chains. Lipid hydroperoxides are reduced by glutathione peroxidase 4 (GPX4) and GPX4 inhibitors induce ferroptosis. However, the therapeutic potential of triggering ferroptosis in cancer cells with polyunsaturated fatty acids is unknown. Here, we identify conjugated linoleates including α-eleostearic acid (αESA) as ferroptosis inducers. αESA does not alter GPX4 activity but is incorporated into cellular lipids and promotes lipid peroxidation and cell death in diverse cancer cell types. αESA-triggered death is mediated by acyl-CoA synthetase long-chain isoform 1, which promotes αESA incorporation into neutral lipids including triacylglycerols. Interfering with triacylglycerol biosynthesis suppresses ferroptosis triggered by αESA but not by GPX4 inhibition. Oral administration of tung oil, naturally rich in αESA, to mice limits tumor growth and metastasis with transcriptional changes consistent with ferroptosis. Overall, these findings illuminate a potential approach to ferroptosis, complementary to GPX4 inhibition.


Conflict of interest statement

Ulrike Rennefahrt is a former employee of Metanomics Health, GmbH. Marcus Conrad is an inventor on patents for some of the compounds described herein, and shareholder of ROSCUE Therapeutics GmbH. The remaining authors declare no competing interests.

Figures

Fig. 1
Fig. 1. Glutathione depletion triggers ferroptosis in a subset of TNBC cell lines and elevated polyunsaturated fatty acid levels are associated with vulnerability to ferroptosis.
a Light micrographs of BT-549 cells treated with 10 μM BSO for 72 h in the presence or absence of 20 μM Z-VAD-FMK or fer-1. Scale bar represents 200 μm. b BT-549 relative cell viability after 72 h of BSO treatment with vehicle, 20 μM Z-VAD-FMK, or 2 μM fer-1 (n = 4 independent experiments). Error bars, here and below, denote standard deviation centered on the mean. The numbers above the brackets are p values from Student’s t-tests (two-sided) unless otherwise noted. p values were not corrected for multiple testing unless stated. c Relative viability of BT-549 cells treated with 10 μM BSO and the indicated concentration of deferoxamine (DFO) for 72 h (n = 3). Values were normalized to account for loss of viability associated with DFO. d Representative fluorescent micrographs of BT-549 cells treated with vehicle, BSO (50 μM), or BSO and fer-1 (2 μM) for 48 h. Green corresponds to cellular macromolecules modified with peroxidized lipid breakdown products (Click-iT lipid peroxidation detection kit, ThermoFisher Scientific). DNA is stained blue. Scale bar represents 20 μm. e Quantitation of lipid peroxidation products from individual cells (n = 50 per condition) in d. Lines represent the mean. f The log2-transformed ratio of the IC50 of BSO in the presence or absence of 2 μM fer-1 for each cell line. Cell lines in which fer-1 reduced cell death from BSO > 8-fold are designated “fer-1-suppressible”. g Box and whiskers plot of the log2-transformed IC50 values for ML162 in non-fer-1-suppressible (blue) and fer-1-suppressible (red) TNBC cell lines (as defined in f). The line represents the median value, the box defines the interquartile range (25th to 75th percentile), and the whiskers show minimum and maximum values. h Box plots showing the log10-transformed, median-normalized relative levels of phosphatidylcholine (C18:0, C18:2) and i phosphatidylcholine (C16:0, C18:2) in non-fer-1-suppressible and fer-1-suppressible TNBC cell lines. Each cell line is represented by at least 5 replicates. p values based on ANOVA and corrected for multiple testing. The line shows the median value, the box shows the interquartile range, the whiskers represent the upper and lower adjacent values, and outliers are shown as dots. Source data are provided as a Source Data file.
Fig. 2
Fig. 2. The conjugated linolenic fatty acid α-eleostearic acid is incorporated into cellular lipids and induces ferroptosis.
a Structure of α-eleostearic acid (αESA). b Cell viability dose-response curves for αESA and the specified additional compound in MDA-MB-231 cells. Cells were treated for 72 h. Error bars in this and subsequent panels represent standard deviation centered on the mean. c Relative viability of MDA-MB-231 cells incubated with the indicated doses of αESA and DFO for 72 h (n = 3 independent experiments). Values were normalized to account for loss of viability associated with DFO. d Quantitation of lipid peroxidation products in individual cells after 4 h of treatment with the specified agent. The line indicates the mean. From left to right, n = 42, 29, 36, and 15. p values from two-sided Student’s t tests are shown. e Cell viability dose-response curves for αESA for three TNBC cell lines (red lines) and non-cancerous MCF-10A controls (black dashed line) after 72 h of treatment. f Relative cell viability for three TNBC cell lines after 72 h of treatment with αESA or the combination of αESA and fer-1 (2 μM) (n = 2 independent experiments). The dose αESA was 100 μM for HCC1806 and HCC1143 and 20 μM for HCC1187. g Percent of the mole fraction for each of the indicated classes of lipid that contain 18:3 (18 carbon, 3 double bonds) fatty acids consistent with αESA (n = 3 biological replicates for each condition). h Mole percent of each lipid class as a fraction of total lipids in MDA-MB-231 cells incubated with vehicle, 2 μM fer-1, 50 μM αESA, 50 μM αESA and 2 μM fer-1, or 250 nM ML162 for 3 h (n = 3 biological replicates for each condition). CE = cholesterol esters, Cer = ceramide, DAG = diacylglycerol, Hexcer = hexosylceramide, LPC = lysophosphatidylcholine, LPC O- = ether-linked lysophosphatidylcholine, LPE = lysophosphatidylethanolamine, LPE O- = ether-linked lysophosphatidylethanolamine, LPG = lysophosphatidylglycerol, LPI = lysophosphatidylinositol, LPS = lysophosphatidylserine, PA = phosphatidate, PC = phosphatidylcholine, PC O- = ether-linked phosphatidylcholine, PE = phosphatidylethanolamine, PE O- = ether-linked phosphatidylethanolamine, PG = phosphatidylglycerol, PI = phosphatidylinositol, PS = phosphatidylserine, SM = sphingomyelin, TAG = triacylglycerol. Source data are provided as a Source Data file.
Fig. 3
Fig. 3. Conjugated linolenic fatty acids are generally toxic to diverse cancer cells.
a Schematic representing the location and double bond geometry of 18-carbon conjugated polyunsaturated fatty acids. Cell viability IC50 values are shown for each conjugated PUFA from at least two biological replicate measurements in MDA-MB-231 cells after 72 h of treatment. b Assessment of fatty acid toxicity across cancer cell lines. A mixture of 100 barcoded human cancer cell lines were treated in triplicate with the indicated fatty acid at doses from 0–35 µM. Viable cells of each cell line in the mixture were quantified at 48 h of treatment. A violin plot illustrates the distribution of cell line-specific toxicities (calculated as the area over the dose dependent-cell viability curve across the treatment dose range). A toxicity value of 1 denotes complete loss of viable cells and 0 corresponds to viability similar to vehicle-treated controls. Dark bars denote median toxicity against all cell lines in the panel and dotted lines indicate quartile boundaries. c Heatmap presenting the Pearson correlation coefficients of the activity areas across the cancer cell line panel in b for each pair of fatty acids in the test set of fourteen. Red shows positive correlation and blue indicates negative correlation. The bars denote the position of the following conjugated linolenic acids from left to right and top to bottom: jacaric acid, catalpic acid, α-calendic acid, βESA, and αESA. Source data are provided as a Source Data file.
Fig. 4
Fig. 4. Mechanistic analysis of αESA-induced ferroptosis.
a Relative viability (blue) and levels of total glutathione (red) in MDA-MB-231 cells after 24 h of treatment with 20 μM BSO, or the specified dose of αESA (n = 2 independent experiments). b Densitometric quantification of GPX4 protein levels from western blots of lysates from MDA-MB-231 cells that were treated for 4 h with the indicated agent. n = 3 independent experiments. Error bars in this and subsequent panels represent standard deviation centered on the mean. p values in this and subsequent panels were calculated using two-sided Student’s t tests. c Cell viability over time for MDA-MB-231 cells treated as specified. * denote p values comparing viability of cells treated with ML162 and RSL3 to cells treated with αESA and ML162. p values from left to right are 0.003, 0.0001, 0.02, and 0.008. d Cell viability dose-response curves for ML162 and the indicated dose of αESA in BT-549 cells after 72 h of treatment (n = 2 independent experiments). e Western blot showing GPX4 protein level in MDA-MB-231 cells 48 h after transfection with a pool of GPX4-targeted siRNA or non-targeting siRNA. β-actin is the loading control for this and the subsequent western blots unless otherwise specified. The right panel shows cell viability dose–response curves for αESA in GPX4-depleted and control MDA-MB-231 cells (n = 3 independent experiments). αESA was added to cells 48 h after transfection for 24 h. f Western blot of endogenous GPX4 and exogenously expressed V5-tagged GXP4 in BT-549 and MDA-MB-231 cells. Relative viability of these cells after 48 h incubation with the indicated dose of g, ML162 (n = 4 and 3 for BT-549 and MDA-MB-231, respectively) or h, αESA (n = 5 and 4 for BT-549 and MDA-MB-231, respectively). p-values from Student’s t-tests are shown. Relative viability of MDA-MB-231 or BT-549 cells after 48 h of treatment with the indicated dose of either i, ML162 or j, αESA and vehicle, iFSP1, fer-1 (2 μM), or iFSP1 and fer-1. Source data are provided as a Source Data file.
Fig. 5
Fig. 5. ACSL1 mediates ferroptosis triggered by αESA.
Cell viability dose-response curves for control and ACSL4-deficient Pfa cells treated with a, ML162 or b, αESA. Error bars indicate standard deviation from three independent experiments centered on the mean. c Bar charts showing fold change in the fraction of viable BT-549 relative to cells transfected with a non-targeting siRNA, 72 h after transfection with the designated ACSLI-targeted siRNA followed by 24-h treatment with either ML162 (blue, n = 3 independent experiments) or αESA (red, n = 4 independent experiments). Error bars in this and subsequent panels show standard deviation centered on the mean. p values < 0.05 from Student’s t-test (one-sided) are indicated. d Western showing ACSL1 protein levels in control BT-549 cells expressing a non-targeting guide RNA and three single-cell BT-549 clones in which ACSL1 was disrupted using CRISPR/Cas9 technology (ACSL1 KO L1–3). Similar results were observed using an independent ACSL1-targeting guide RNA (Supplementary Fig. 4g). e Relative cell viability of control and ACSL1 KO lines after 48 h of treatment with the specified dose of αESA or f, ML162 (n = 4 independent experiments). p-values are shown above comparator bars in this and subsequent panels (two-sided Student’s t-test). g V5 western blot (left) showing transgenic re-expression of V5-tagged, CRISPR-resistant ACSL1 (ACSL1 CR) and (right) relative viability of control (eGFP), ACSL1 KO (eGFP), or ACSL1 KO cells expressing ACSL1 CR after 48 h of treatment with the indicated dose of αESA. h Western blot (left) of V5-tagged ACSL1 in BT-549 cells stably over-expressing the protein compared to a control line expressing eGFP, and (right) the fraction of viable cells remaining for each cell line after 48 h of treatment with the noted dose of αESA. Source data are provided as a Source Data file.
Fig. 6
Fig. 6. ACSL1 drives incorporation of αESA into neutral lipids.
Heatmaps representing relative lipid abundance in ACSL1-deficient (ACSL1 KO L1, L2) or overexpressing (ACSL1 OE) BT-549 cells as fold-change in mole percent compared to control cells after 16 h treatment with 50 μM αESA (right and middle) or in untreated cells (left). The rightmost heatmap shows only the subset of lipids with 18:3 acyl chains. Yellow indicates an increase in relative abundance and blue shows a decrease in relative abundance. PL = phospholipids, CE = cholesterol esters, Cer = ceramide, DAG = diacylglycerol, PC O- = ether-linked phosphatidylcholine, PE O- = ether-linked phosphatidylethanolamine, SM = sphingomyelin, TAG = triacylglycerol. Source data are provided as a Source Data file.
Fig. 7
Fig. 7. Lipid peroxidation by αESA is promoted by ACSL1.
a Western blot showing ACSL1 protein expression in control or ACSL1-silenced cells. The efficiency of the siRNA knockdown was independently confirmed using quantitative PCR (qPCR) (Supplementary Fig. 4b). b Bar charts showing the overall amount of 18:3-containing TAGs in BT-549 cells under the specified condition (n = 3 biological replicates for this and subsequent bar charts). Cells were treated for 8 h with 25 μM αESA or vehicle. Treatments were added 72 h after transfection with a pool of either ACSL1-targeting or non-targeting siRNA. In this and subsequent panels, mean values ± standard deviation are presented, and p-values are shown above comparator bars (two-sided Student’s t-test). c Volcano plot showing log2(fold change) and significance (log10(1/p)) for oxidized phospholipids in BT-549 cells incubated for 8 h with 25 μM αESA compared to cells incubated with vehicle (methanol). Each lipid species is colored according to phospholipid class. BMP = bis(monoacylglycero)phosphate, PS = phosphatidylserine, PE = phosphatidylethanolamine, PG = phosphatidylglycerol, PI = phosphatidylinositol, PC = phosphatidylcholine, CL = cardiolipin. The arrow indicates a lipid species for which a fold change could not be computed because it was only detected after αESA treatment. d Bar charts showing the amounts of di-oxygenated PE species that were significantly increased by αESA treatment compared to vehicle-treated controls. e Volcano plot depicts log2(fold change) versus log10(1/p-value) for oxidized phospholipids in BT-549 cells transfected with a pool of ACSL1 siRNA and incubated with 25 μM αESA for 8 h compared to αESA-treated cells transfected with non-targeting siRNA. The set is limited to the 51 oxidized phospholipid species that were significantly changed by αESA treatment as shown in c. Bar charts showing the amount of a (f), di-oxygenated and (g), mono-oxygenated TAG species that were significantly increased by αESA treatment in an ACSL1-dependent manner. Source data are provided as a Source Data file.
Fig. 8
Fig. 8. Incorporation of αESA into triacylglycerols promotes ferroptosis.
a Relative viability of MDA-MB-231 cells 72 h after transfection with either DGAT1-targeting, DGAT2-targeting, or non-targeting siRNA followed by 24-hour treatment with indicated dose of αESA (n = 3 independent experiments). Error bars in this and subsequent panels show standard deviation centered on the mean, and p-values above comparator bars in this and subsequent panels are from two-sided Student’s t-tests unless noted. Bar charts showing the fraction of viable (b), MDA-MB-231 or (c), BT-549 cells incubated for 48 h with either 6.25 μM αESA (n = 3 and 4 for MDA-MB-231 and BT-549, respectively) or 62.5 nM ML162 (n = 4) and either vehicle, a DGAT1 inhibitor (4 μM PF-04620110), a DGAT2 inhibitor (4 μM PF-06424439), or both inhibitors. d, e Bar charts showing the amount of two DAG (18:3/18:3)/dihydroxy αESA adducts that were detected following treatment with αESA and were significantly decreased by ACSL1 depletion (n = 3 biological replicates). The m/z of adduct 1 and adduct 2 are 940.7278 and 942.7439, respectively. f Quantitation of lipid peroxidation products in individual BT-549 cells after being cultured for 2 h with normal medium, tung oil-conditioned medium, or tung oil-conditioned medium containing 2 μM fer-1. The line indicates the mean. From left to right, n = 71, 57, and 46. g Bar charts showing relative cell viability for BT-549 cells cultured in normal growth medium or tung oil-conditioned medium with or without 2 μM fer-1 or 50 μM DFO (n = 6 independent experiments). The values above the comparator bars represent the p-values from one-sided Student’s t-tests. Source data are provided as a Source Data file.
Fig. 9
Fig. 9. Tung oil suppresses TNBC xenograft growth and metastasis with markers of ferroptosis.
a Median tumor volumes over time for orthotopic MDA-MB-231 xenografts in NSG mice treated orally with either safflower oil (control) or tung oil (n = 6 mice per group with bilateral tumors). * denote p-values from two-sided Student’s t-test, which are 0.003, 0.00001, and 0.0003 from left to right. Error bars show interquartile range. b Final tumor masses of individual tumors following 24 days of treatment. Lines represent median values. The p-value above the comparator bar is from a two-sided Student’s t-test. c Representative hematoxylin and eosin-stained lung sections. Regions containing metastatic TNBC cells are outlined in green. d Quantification of the percentage of lung area infiltrated by metastatic cells. The line represents the median value, the box shows the interquartile range (25th to 75th percentile), and the whiskers show minimum and maximum values. This analysis was performed once. The p-value above the comparator bar is from a two-sided Student’s t-test. e Mole percent of total lipids for DAG 34:3 and TAG 52:7 in tumors treated with tung oil (left, n = 4 and 3 biological replicates for DAG 34:3 and TAG 52:7, respectively) or in MDA-MB-231 cells grown in culture and incubated with 50 μM αESA for 3 h (right, n = 3 biological replicates). Error bars represent standard deviation centered on the mean. The p-values were calculated using a one-sided Student’s t-test, not adjusted for multiple hypothesis testing. f Proportional Venn diagram showing the overlap in genes with transcript levels that were significantly altered by >2-fold (5% false discovery rate) after a 5 h incubation with 100 μM αESA or 125 nM ML-162 or in orthotopic MDA-MB-231 xenograft tumors treated as described above for a. Genes commonly altered in all three data sets are listed. Source data are provided as a Source Data file.

Similar articles

Cited by

References

    1. Cao JY, Dixon SJ. Mechanisms of ferroptosis. Cell Mol. Life Sci. 2016;73:2195–2209. doi: 10.1007/s00018-016-2194-1. - DOI - PMC - PubMed
    1. Xie Y, et al. Ferroptosis: process and function. Cell Death Differ. 2016;23:369–379. doi: 10.1038/cdd.2015.158. - DOI - PMC - PubMed
    1. Yang WS, Stockwell BR. Ferroptosis: death by lipid peroxidation. Trends Cell Biol. 2016;26:165–176. doi: 10.1016/j.tcb.2015.10.014. - DOI - PMC - PubMed
    1. Stockwell BR, et al. Ferroptosis: a regulated cell death nexus linking metabolism, redox biology, and disease. Cell. 2017;171:273–285. doi: 10.1016/j.cell.2017.09.021. - DOI - PMC - PubMed
    1. Friedmann-Angeli, J. P., Miyamoto, S. & Schulze, A. Ferroptosis: the greasy side of cell death. Chem. Res. Toxicol.32, 362–369 (2019). - PubMed

Publication types

MeSH terms