. 2021 Apr 14;12(1):2242.
doi: 10.1038/s41467-021-22445-0.

Defining super-enhancer landscape in triple-negative breast cancer by multiomic profiling

Affiliations

Defining super-enhancer landscape in triple-negative breast cancer by multiomic profiling

Hao Huang et al. Nat Commun. .

Abstract

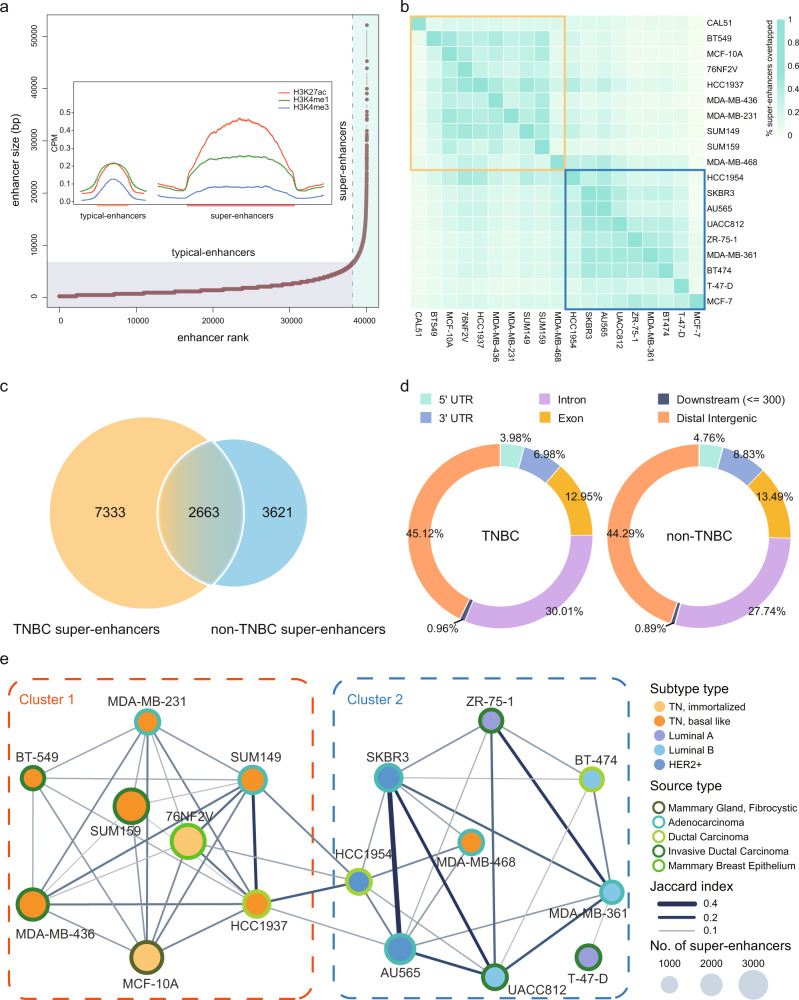
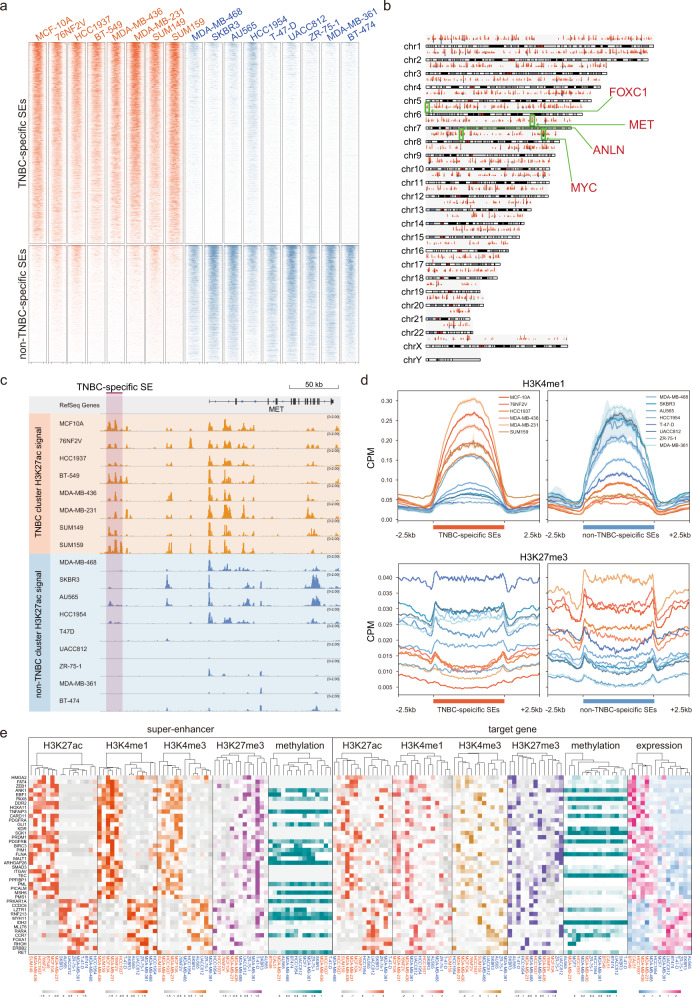
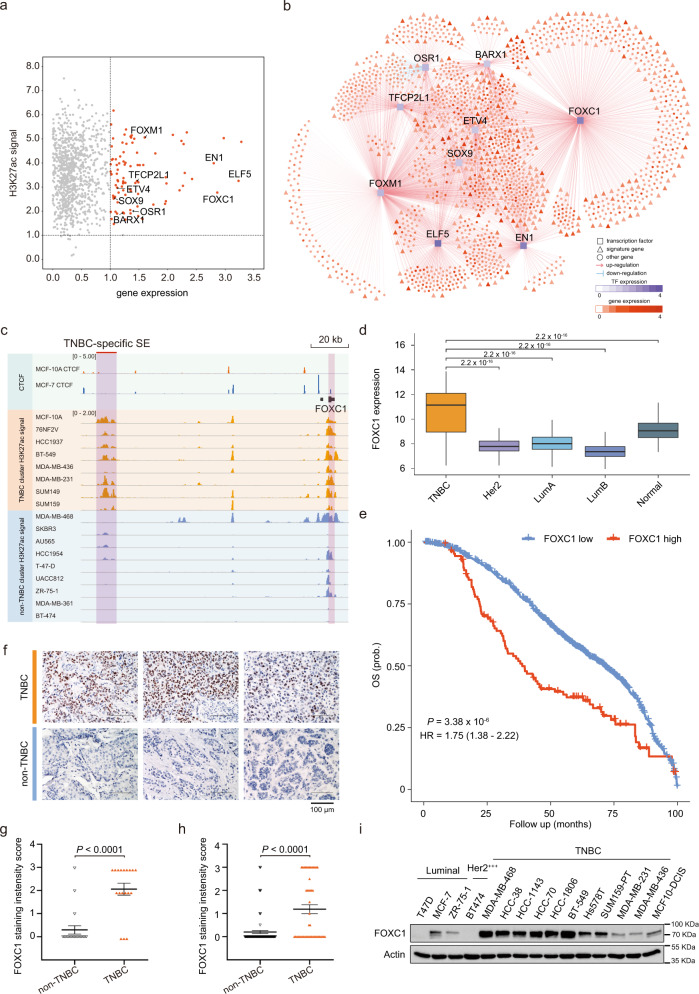
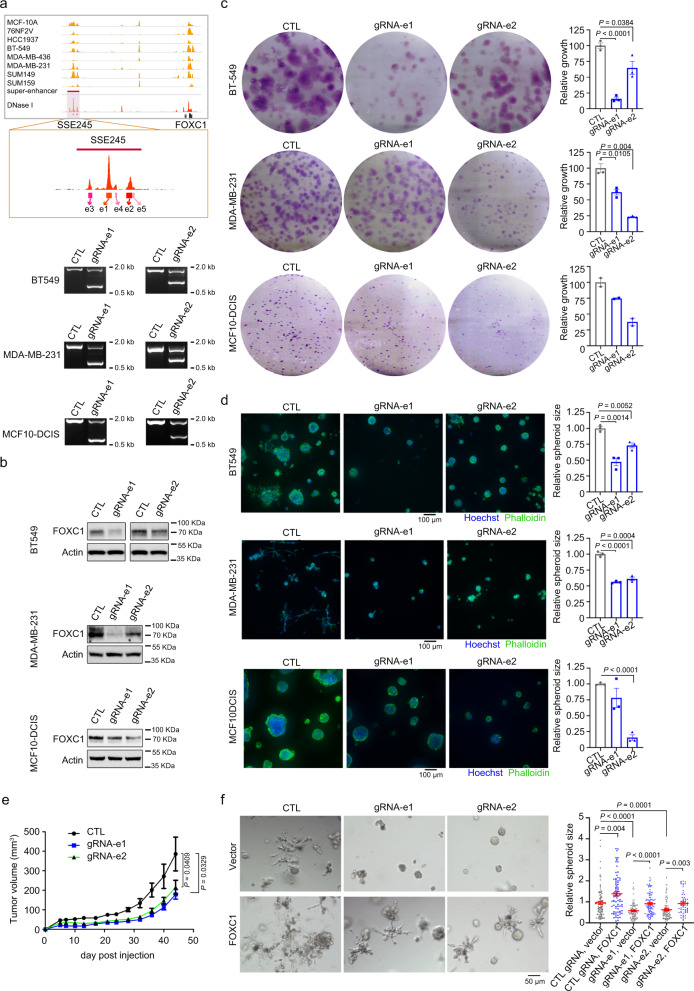
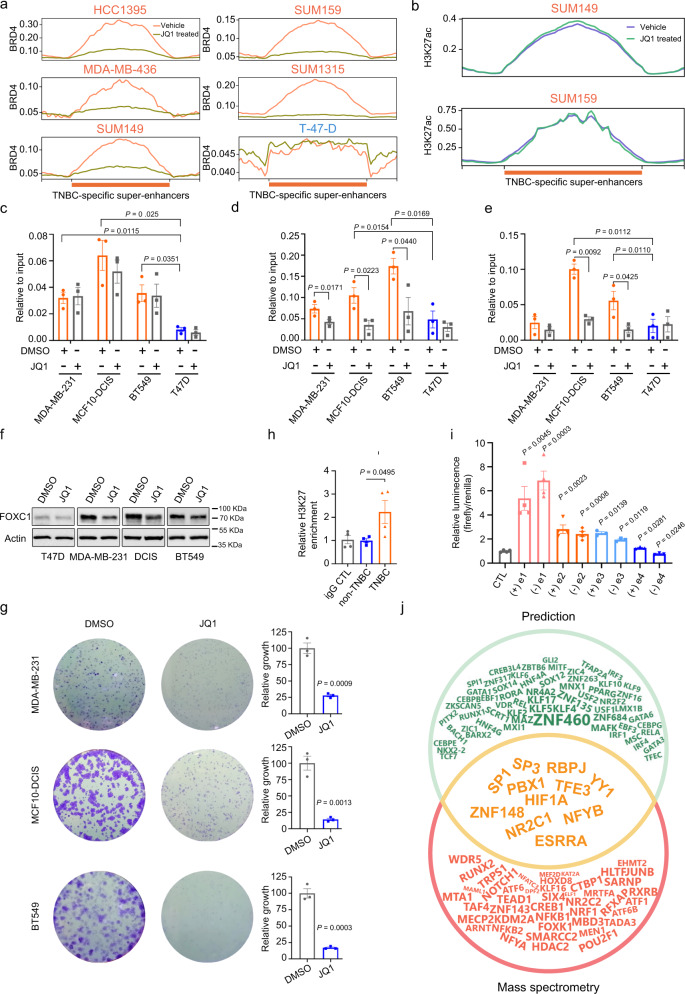
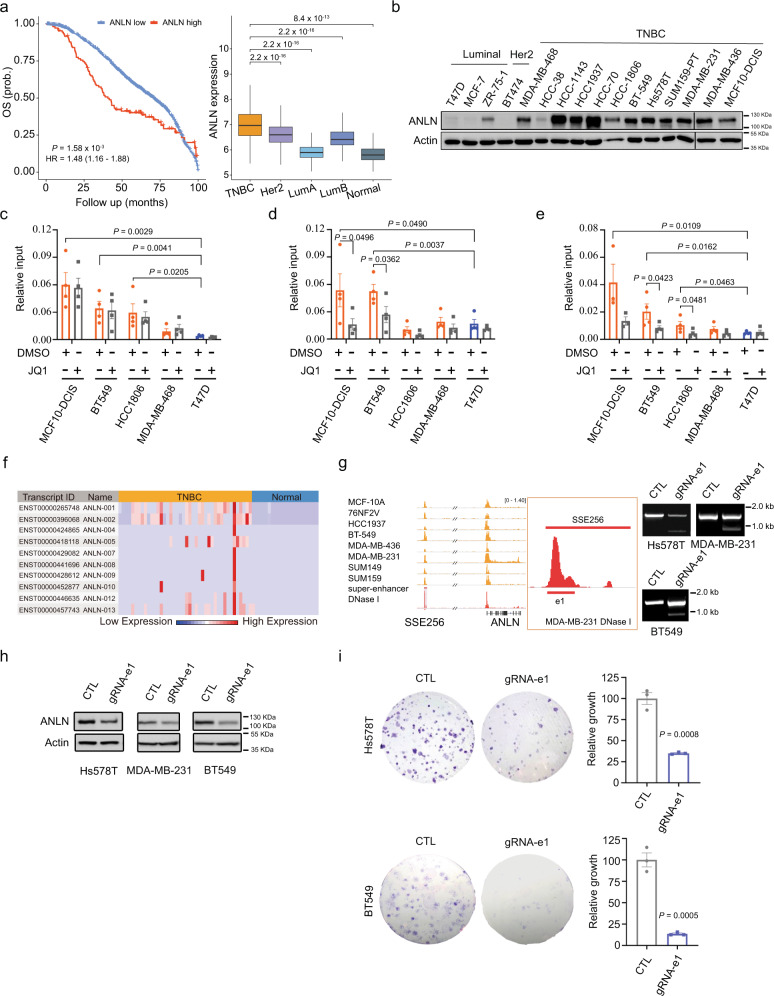
Breast cancer is a heterogeneous disease, affecting over 3.5 million women worldwide, yet the functional role of cis-regulatory elements including super-enhancers in different breast cancer subtypes remains poorly characterized. Triple-negative breast cancer (TNBC) is an aggressive subtype of breast cancer with a poor prognosis. Here we apply integrated epigenomic and transcriptomic profiling to uncover super-enhancer heterogeneity between breast cancer subtypes, and provide clinically relevant biological insights towards TNBC. Using CRISPR/Cas9-mediated gene editing, we identify genes that are specifically regulated by TNBC-specific super-enhancers, including FOXC1 and MET, thereby unveiling a mechanism for specific overexpression of the key oncogenes in TNBC. We also identify ANLN as a TNBC-specific gene regulated by super-enhancer. Our studies reveal a TNBC-specific epigenomic landscape, contributing to the dysregulated oncogene expression in breast tumorigenesis.


Conflict of interest statement

The authors declare no competing interests.

Figures

Fig. 1
Fig. 1. Epigenomic profiling identifies putative distal super-enhancers in breast cancer subtypes.
a SEs were distinguished from typical enhancers using LOESS regression, fitting the size distribution of the enhancers followed by identification of the inflection point (slope = 1). Using AU565 cell line as an example, the identified SEs were enriched for higher H3K27ac and H3K4me1 signals, and lower H3K4me3 signals. b Cell lines belonging to the same subtype showed a higher degree of co-occurrence of SEs. The matrix shows pair-wise similarity of SEs detected in different cell types. The degree of similarity is colored in proportion to the overlap percentage. The top left part (orange rectangle) represents the TN cell lines, the bottom right part (blue rectangle) represents the non-TNBC cell lines. c Venn diagram shows the number of SEs uniquely found in at least one TNBC and non-TNBC cell lines, respectively, as well as those found both in TNBC and non-TNBC cell lines. d Genome-wide annotations of SEs detected in TNBC and non-TNBC cell lines, respectively. e A network of SE similarities between breast cancer cell lines. Each node represents a cell line and edge width corresponds to the significant Jaccard similarity coefficient (BH-adjusted P < 0.001, one-sided hypergeometric test). Based on network partition, two clusters of cell lines were identified, which recapitulates the subtype identify (TNBC vs. non-TNBC).
Fig. 2
Fig. 2. Multiomic characterization of subtype-specific super-enhancers.
a Heatmap compares H3K27ac enrichment patterns between TNBC-specific SEs and non-TNBC-specific SEs across TNBC and non-TNBC cell lines. b A genome-wide overview of the loci and co-occurrence frequencies of identified TNBC-specific SEs in TNBC cell lines. Oncogenes FOXC1, MET and MYC were indicated. c Genome browser plot illustrates TNBC-specific SE detected in the upstream region of MET. d Higher enrichment of H3K4me1 signals was observed in TNBC-specific SEs in TNBC cell lines than non-TNBC cell lines, whereas H3K27me3 signals were depleted in TNBC-specific SEs in TNBC cell lines. e Heatmaps illustrate gene expression, DNA methylation, H3K27ac, H3K4me1, H3K4me3, H3K27me3 patterns of cancer-related genes in TNBC cell lines compared to non-TNBC cell lines. In each heatmap, the cell lines were organized by hierarchical clustering, with labels colored in orange and blue highlighting TN lines and non-TNBC lines, respectively.
Fig. 3
Fig. 3. Identification of FOXC1 as a super-enhancer-driven master regulator of invasion and metastasis in TNBC.
a Prediction of potential target genes of TNBC-specific SEs. The X-axis represents log2 fold change of gene expression between TNBC and non-TNBC samples in the TCGA-BRCA cohort. Y-axis represents log2 fold enrichment of H3K27ac signal of TNBC-specific SEs between TNBC and non-TNBC cell lines. Among all predicted target genes, nine transcription factors were identified and highlighted. b A regulatory network was inferred by integrative analysis of SE-regulated TFs and gene expression data in the TCGA-BRCA dataset. FOXC1 was identified as a master regulator of activating invasion and metastasis in TNBC. Predicted genes regulated by the nine TFs were colored in proportion to their differential expression levels between TNBC and non-TNBC samples. c Genome browser plot shows higher enrichment of H3K27ac signal in the SEs proximal to FOXC1 in the TNBC cell lines than the non-TNBC cell lines. d FOXC1 showed significantly higher expression in TNBC samples (n = 327) than those classified to the other subtypes (Her2 n = 237, LumA n = 706, LumB n = 484, and Normal-like n = 199) in the METABRIC cohort (two-sided Wilcoxon signed-rank tests). The boxes represent the 25th percentile, median, and 75th percentile, whiskers were extended to the furthest value that is no more than 1.5 times the inter-quartile range. e Kaplan–Meier plot shows that breast cancer patients with high expression of FOXC1 (top 10%) showed significantly poorer overall survival than the others in the METABRIC cohort. The statistical significance was calculated by a log-rank test (one-sided). (f, g) Immunohistochemistry of FOXC1 expression in 38 surgical breast cancer samples (18 TNBC, 20 non-TNBC). Representative FOXC1 staining images are shown. The bar graph shows the mean staining intensity score of FOXC1 in the surgical samples. (h) The mean staining intensity score of FOXC1 in tissue microarray samples of TNBC (n = 48) and non-TNBC (n = 102). i Immunoblotting detection of FOXC1 expression in a panel of breast cancer cell lines, repeated independently twice with similar results. Data are represented as mean ± SEM in (g) and (h). P-values were calculated by two-sided Student’s t test in (g) and (h). Source data are provided as a Source Data file.
Fig. 4
Fig. 4. Deletion of FOXC1 SE reduces TNBC spheroid growth and invasion.
a Schematic of FOXC1 SE (SSE245) and PCR detection of CRISPR/Cas9-mediated deletion of e1 and e2. Inset shows 5 constituent enhancers (e1–e5) within SSE245 and their sensitivities to DNase I in MDA-MB-231 cells. 1203 and 907 base pairs of e1 and e2 were deleted, respectively. b Immunoblotting of FOXC1 in BT549, MDA-MB-231, and MCF10-DCIS upon deletion of e1 or e2 of SSE245. Experiments in (a) and (b) were repeated twice independently with similar results. c Clonogenic assay of BT549, MDA-MB-231, and MCF10-DCIS with or without deletion of e1 or e2. Bar graphs show the quantification of clonogenic proliferation, n = 3 independent experiments for BT549 and MDA-MB-231, n = 2 for MCF10-DCIS. d Phalloidin and Hoechst staining of BT549, MDA-MB-231 and MCF10DCIS spheroids. Bar graphs show the quantification of spheroid size. n = 3 independent experiments. e Tumor volume of MDA-MB-231 xenografts with or without e1, e2 deletion. Tumor number of each group n = 7. f Growth of MDA-MB-231 spheroids with or without e1, e2 deletion in the presence of FOXC1 overexpression. Right panel, quantification of spheroid size. n = 98, 81, 87, 93, 99, 60 spheroids (from left to right) examined over 3 independent experiments. Data are represented as mean ± SEM in (cf). P-values were calculated by two-sided Student’s t test in (cf). Source data are provided as a Source Data file.
Fig. 5
Fig. 5. Epigenetic regulation of FOXC1 expression in TNBC.
a ChIP-seq profiles for BRD4 in a panel of JQ1 or DMSO (vehicle control) treated breast tumor lines. b H3K27ac enrichment at TNBC-specific SEs with or without JQ1 treatment. c–e H3K27ac (c), Brd4 (d), and P300 (e) ChIP-qPCR of indicated cell lines using primer amplifying e1 of FOXC1 SE. n = 3 independent experiments. f Immunoblotting detection of FOXC1 expression in cells treated with JQ1 or DMSO, repeated independently twice with similar results. g Clonogenic growth of indicated cells with or without 0.3 µM JQ1 treatment. n = 3 independent experiments. h H3K27ac ChIP-qPCR of clinical breast cancer samples using primer amplifying e1 of FOXC1 SE. Four TNBC and four non-TNBC fresh frozen samples were tested. i Activity of constituent enhancers of FOXC1 SE measured in BT-549 cells by Dual-Luciferase reporter assay. n = 3 independent experiments. (j) Venn diagram shows TFs potentially binding to the SE region identified by prediction and mass spectrometry. The size of TFs uniquely found by prediction was proportionate to -log10 transformed p-value, and the size of TFs found by mass spectrometry only was in proportion to -log10 transformed BH-adjusted p-value. Data are represented as mean ± SEM in (ce) and (gi). P-values were calculated by two-sided Student’s t test in (ce) and (gi). Source data are provided as a Source Data file.
Fig. 6
Fig. 6. Functional importance of ANLN super-enhancer in TNBC clonogenicity.
a Higher expression of ANLN is associated with poor prognosis of breast cancer patients in the METABRIC cohort. The statistical significance was calculated by a log-rank test (one-sided). Increased expression of ANLN in TNBC samples (n = 327), compared to other subtypes (Her2 n = 237, LumA n = 706, LumB n = 484, and Normal-like n = 199; two-sided Wilcoxon signed-rank tests). The boxes represent the 25th percentile, median, and 75th percentile, whiskers were extended to the furthest value that is no more than 1.5 times the inter-quartile range. b Immunoblotting detection of ANLN expression in a panel of breast cancer cell lines, repeated independently twice with similar results. ce H3K27ac (c), Brd4 (d), and P300 (e) ChIP-qPCR of indicated cell lines using primer amplifying e1 of ANLN SE. n of independent experiments is indicated by scatter dots. f mRNA expression levels of ANLN, data from Cancer RNA-seq Nexus. TNBC n = 42 samples, Normal tissue n = 21 samples adjacent to TNBC. g Schematic of ANLN SE (SSE256) and detection of e1 deletion of ANLN SE by PCR in Hs578T, MDA-MB-231 and BT549 cells, repeated independently twice with similar results. h Immunoblotting detection of ANLN upon deletion of SSE256 e1 region, repeated independently twice with similar results. i Clonogenic assay of Hs578t and BT549 cells with or without deletion of SSE256 e1. n = 3 independent experiments. Data are represented as mean ± SEM in (ce) and (i). P-values were calculated by one-sided Student’s t test in (ce). P-values were calculated by two-sided Student’s t test in (i). Source data are provided as a Source Data file.

References

    1. Bray F, et al. Global cancer statistics 2018: GLOBOCAN estimates of incidence and mortality worldwide for 36 cancers in 185 countries. CA: Cancer J. Clinicians. 2018;68:394–424. - PubMed
    1. Lehmann BD, et al. Identification of human triple-negative breast cancer subtypes and preclinical models for selection of targeted therapies. J. Clin. Investig. 2011;121:2750–2767. doi: 10.1172/JCI45014. - DOI - PMC - PubMed
    1. Cancer Genome Atlas N. Comprehensive molecular portraits of human breast tumours. Nature. 2012;490:61–70. doi: 10.1038/nature11412. - DOI - PMC - PubMed
    1. Mansour MR, et al. Oncogene regulation. An oncogenic super-enhancer formed through somatic mutation of a noncoding intergenic element. Science. 2014;346:1373–1377. doi: 10.1126/science.1259037. - DOI - PMC - PubMed
    1. Loven J, et al. Selective inhibition of tumor oncogenes by disruption of super-enhancers. Cell. 2013;153:320–334. doi: 10.1016/j.cell.2013.03.036. - DOI - PMC - PubMed

Publication types