Observational Study
. 2021 Apr 14;12(1):2241.
doi: 10.1038/s41467-021-22302-0.

Microbiota-based markers predictive of development of Clostridioides difficile infection

Collaborators, Affiliations
Observational Study

Microbiota-based markers predictive of development of Clostridioides difficile infection

Matilda Berkell et al. Nat Commun. .

Abstract

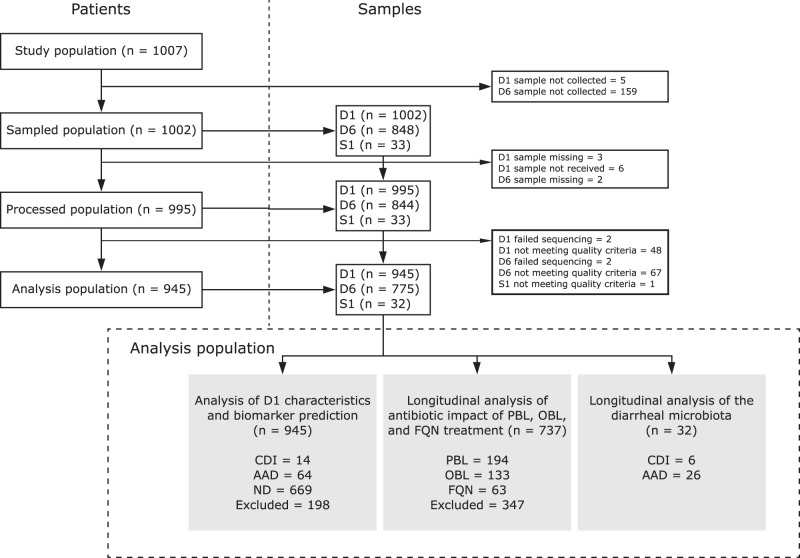
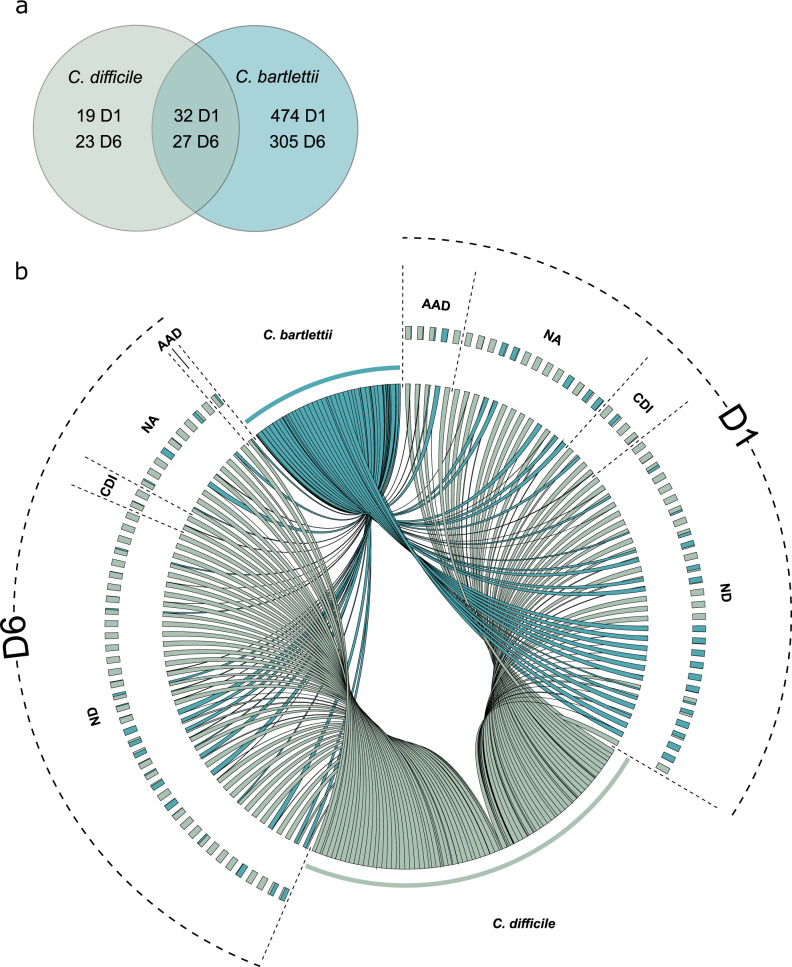
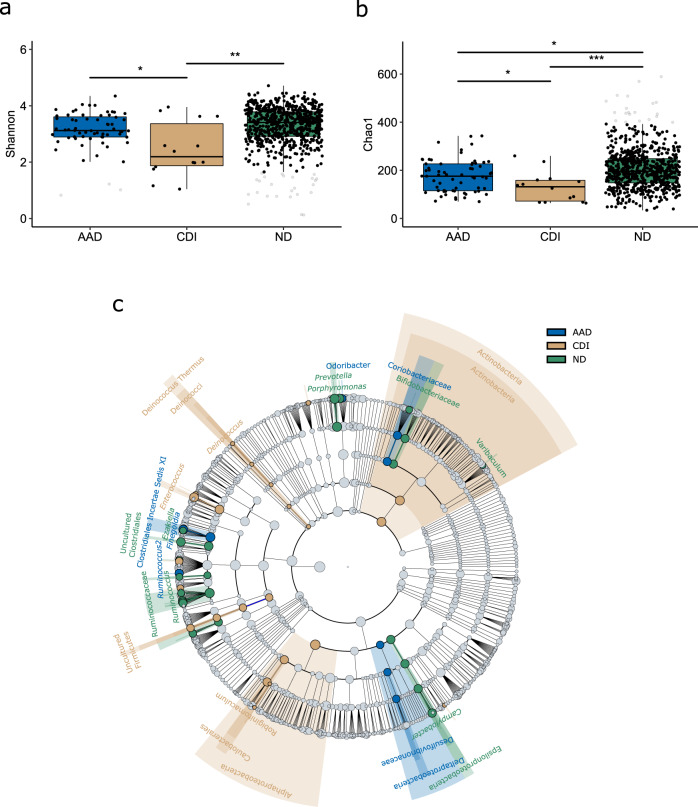
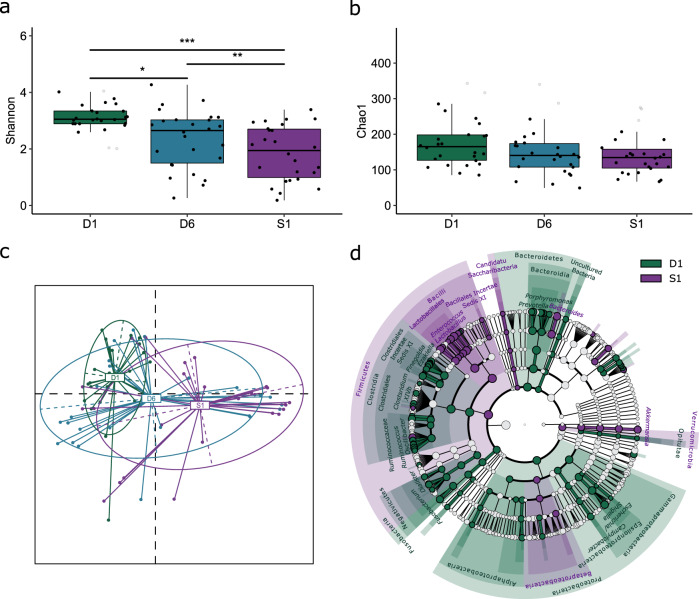
Antibiotic-induced modulation of the intestinal microbiota can lead to Clostridioides difficile infection (CDI), which is associated with considerable morbidity, mortality, and healthcare-costs globally. Therefore, identification of markers predictive of CDI could substantially contribute to guiding therapy and decreasing the infection burden. Here, we analyze the intestinal microbiota of hospitalized patients at increased CDI risk in a prospective, 90-day cohort-study before and after antibiotic treatment and at diarrhea onset. We show that patients developing CDI already exhibit significantly lower diversity before antibiotic treatment and a distinct microbiota enriched in Enterococcus and depleted of Ruminococcus, Blautia, Prevotella and Bifidobacterium compared to non-CDI patients. We find that antibiotic treatment-induced dysbiosis is class-specific with beta-lactams further increasing enterococcal abundance. Our findings, validated in an independent prospective patient cohort developing CDI, can be exploited to enrich for high-risk patients in prospective clinical trials, and to develop predictive microbiota-based diagnostics for management of patients at risk for CDI.


Conflict of interest statement

C.H.v.W. received speaker fees from Pfizer and Merck/MSD, and non-financial research support from bioMérieux. A.D. is an employee and shareholder of Da Volterra. J.d.G. is a consultant and shareholder of Da Volterra. M.J.G.T.V. has received research grants from 3M, Astellas Pharma, Da Volterra, Gilead Sciences, Glycom, MaaT Pharma, Merck/MSD, Organobalance, Seres Therapeutics; speaker fees from Astellas Pharma, Basilea, Gilead Sciences, Merck/MSD, Organobalance, Pfizer and has been a consultant to Alb Fils Kliniken GmbH, Astellas Pharma, Da Volterra, Ferring, MaaT Pharma, Merck/MSD and Summit Therapeutics. M.B., M.M., B.B.X., C.L., P.M., M.J.M.B., H.G., S.M.-K. report no competing interests.

Figures

Fig. 1
Fig. 1. Patient and sample flow in the study.
The flow chart provides an overview of participating patients in each processing step, number of samples collected at each timepoint, and reasons for sample exclusion or non-collection. D1: rectal swab sample collected upon study enrollment. D6: rectal swab collected ~6 days after initiation and at the end of antibiotic treatment. S1: stool sample collected at the first occurrence of diarrhea (variable time-point). AAD: patients with non-C. difficile antibiotic-associated diarrhea. CDI: patients with confirmed C. difficile infection. ND: non-diarrheic patients. PBL: penicillin + beta-lactamase inhibitor. OBL: other beta-lactamase antibiotics. FQN: fluoroquinolones.
Fig. 2
Fig. 2. C. difficile and C. bartlettii carriage in the analyzed population at D1 and D6.
Oligotyping revealed diversity within the OTU classified as Clostridium XI wherein reads were divided into C. difficile (green) and C. bartlettii (blue). a Rectal swab samples collected at the time of study enrollment (D1), and ~6 days later at the end of treatment (D6) harbored reads classified as both C. difficile and C. bartlettii. Patients that were defined as C. difficile carriers due to the presence of C. difficile reads after oligotyping showed no clear link to clinical outcome. b Similar carriage rates of the OTU Clostridium XI were identified in patients both at D1 (5.40%, n = 51) and D6 (6.78%, n = 50) with varying relative abundances of C. difficile and C. bartlettii reads as demonstrated in the Circos plot. Patients at D6 generally show higher relative abundance of C. difficile than of C. bartlettii compared to D1. D1: rectal swab sample collected upon study enrollment. D6: rectal swab collected ~6 days after initiation and at the end of antibiotic treatment. AAD: patients with non-C. difficile antibiotic-associated diarrhea. CDI: patients with confirmed C. difficile infection. ND: non-diarrheic patients. NA: patients without known CDI status and/or early study termination. OTU: operational taxonomic unit.
Fig. 3
Fig. 3. Characterization of microbial diversity in baseline (D1) samples.
a CDI patients (n = 14, brown) display distinctly lower alpha diversity expressed by the Shannon index compared to AAD (n = 64, blue, p = 0.037) and ND patients (n = 669, green, p = 0.005) at D1. AAD patients similarly display lower Shannon diversity compared to ND patients, however not sufficient to be statistically significant (p = 0.087). b Both CDI and AAD patients display lower diversity expressed by the Chao1 index compared to ND patients (p = 0.001 and 0.017, respectively) at D1. Compared to patients who develop AAD, CDI patients display lower Chao1 indices (p = 0.049). c Cladogram generated by LEfSe demonstrating significantly higher abundances of Actinobacteria, Alphaproteobacteria, and Enterococcus spp. in the gut microbiota of CDI patients at baseline (D1) compared to AAD and ND patients. The cladogram shows distinctly abundant taxa of interest. For more details, see Supplementary Fig. 4. Alpha diversity indices were compared using the non-parametric two-sided Wilcoxon rank sum test followed by Bonferroni correction of p-values. Box plots indicate median (middle line), 25th, 75th percentile (box), and 5th and 95th percentile (whiskers) as well as outliers (gray single dots). AAD: patients with non-C. difficile antibiotic-associated diarrhea. CDI: patients with confirmed C. difficile infection. ND: non-diarrheic patients. LEfSe: Linear discriminant analysis effect size. LDA: linear discriminant analysis score. *p < 0.05. **p ≤ 0.01. ***p ≤ 0.001.
Fig. 4
Fig. 4. Longitudinal analysis of the impact of antibiotic therapy on the intestinal microbiota.
Microbial diversity was compared prior to broad-spectrum antibiotic treatment at D1 (green) and after treatment at D6 (purple) following treatment with PBLs (n = 194), OBLs (n = 133), and FQNs (n = 63). a A distinct reduction was observed in Shannon diversity in patients treated with all antibiotic classes (p = 8.98*10−6, p = 2.06*10−5, and p = 0.007, respectively). b Similarly, distinct reductions in Chao1 diversity was observed following treatment with all antibiotic classes (p = 0.011, p = 0.001, and p = 9.26 × 10−5, respectively). c Treatment with each antibiotic class resulted in a shift in microbial composition illustrated by the Jaccard distances between the D1 and D6 samples. d The heatmap illustrates distinctly abundant taxa (LDA > 3.0) identified using LEfSe. For more details, see Supplementary Table 10. Alpha diversity indices were compared using the paired two-sided non-parametric Wilcoxon signed rank test. Box plots in indicate median (middle line), 25th, 75th percentile (box), and 5th and 95th percentile (whiskers) as well as outliers (gray single dots). PBL: penicillin + beta-lactamase inhibitor. OBL: other beta-lactam antibiotics. FQN: fluoroquinolones. LDA: Linear discriminant analysis score. D1: rectal swab sample collected upon study enrollment. D6: rectal swab collected ~6 days after initiation and at the end of antibiotic treatment. LEfSe: linear discriminant analysis effect size. LDA: linear discriminant analysis score. OTU: operational taxonomic unit. *p < 0.05, **p ≤ 0.01, ***p ≤ 0.001.
Fig. 5
Fig. 5. Longitudinal analysis of microbial diversity and dysbiosis in patients developing AAD.
Microbial diversity and composition in patients developing AAD in the study population (n = 26) was assessed at D1 (green), D6 (blue), S1(purple). a Gradual decrease in Shannon diversity was observed between all timepoints (from D1 to D6: p = 0.018, from D1 to S1: p = 2.74*10−5, from D6 to S1: p = 0.007). b Similar trends are observed for the Chao1 index (Friedman rank sum: p = 0.054). c Multi-dimensional scaling (MDS) shows distinct clusters for samples collected at each timepoint. d Comparison of the microbiota composition at D1 and S1 conducted using LEfSe (LDA > 2.0) shows large changes in the Firmicutes and Proteobacteria phyla for AAD patients. Proteobacteria are significantly reduced at the occurrence of AAD, and a shift is observed from the Clostridia to Bacilli class at the instance of diarrhea. The cladogram shows distinct taxa of interest. For more details, see Supplementary Fig. 5. Alpha diversity indices were compared using the paired two-sided non-parametric Wilcoxon signed rank test followed by Bonferroni correction of p-values. Box plots indicate median (middle line), 25th, 75th percentile (box), and 5th and 95th percentile (whiskers) as well as outliers (gray single dots). AAD: patients with non-C. difficile antibiotic-associated diarrhea. D1: rectal swab sample collected upon study enrollment. D6: rectal swab collected ~6 days after initiation and at the end of antibiotic treatment. S1: stool sample collected at the first occurrence of diarrhea (variable time-point). LEfSe: linear discriminant analysis effect size. LDA: Linear discriminant analysis score. *p < 0.05, **p ≤ 0.01, ***p ≤ 0.001.

References

    1. Freeman J, et al. The changing epidemiology of Clostridium difficile infections. Clin. Microbiol. Rev. 2010;23:529–549. doi: 10.1128/CMR.00082-09. - DOI - PMC - PubMed
    1. Smits WK, Lyras D, Lacy DB, Wilcox MH, Kuijper EJ. Clostridium difficile infection. Nat. Rev. Dis. Prim. 2016;2:16020. doi: 10.1038/nrdp.2016.20. - DOI - PMC - PubMed
    1. Magill SS, et al. Multistate point-prevalence survey of health care-associated infections. New Engl. J. Med. 2014;370:1198–1208. doi: 10.1056/NEJMoa1306801. - DOI - PMC - PubMed
    1. Slimings C, Riley TV. Antibiotics and hospital-acquiredClostridium difficile infection: update of systematic review and meta-analysis. J. Antimicrob. Chemother. 2014;69:881–891. doi: 10.1093/jac/dkt477. - DOI - PubMed
    1. Owens RC, Jr., Donskey CJ, Gaynes RP, Loo VG, Muto CA. Antimicrobial‐associated risk factors for Clostridium difficile infection. Clin. Infect. Dis. 2008;46:S19–S31. doi: 10.1086/521859. - DOI - PubMed

Publication types