. 2021 Apr 14;11(1):8117.
doi: 10.1038/s41598-021-87403-8.

Exhausting repetitive piano tasks lead to local forearm manifestation of muscle fatigue and negatively affect musical parameters

Affiliations

Exhausting repetitive piano tasks lead to local forearm manifestation of muscle fatigue and negatively affect musical parameters

Etienne Goubault et al. Sci Rep. .

Abstract

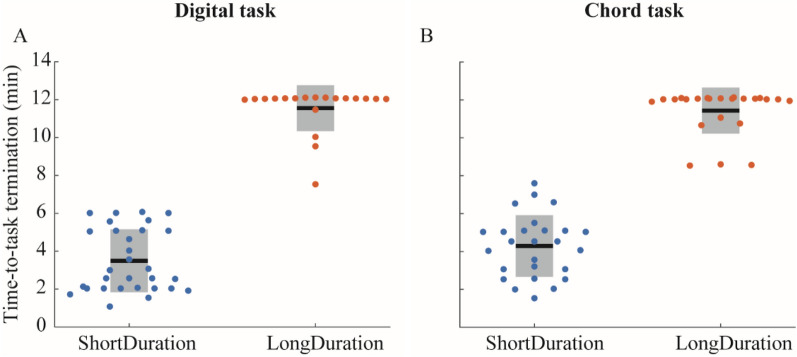
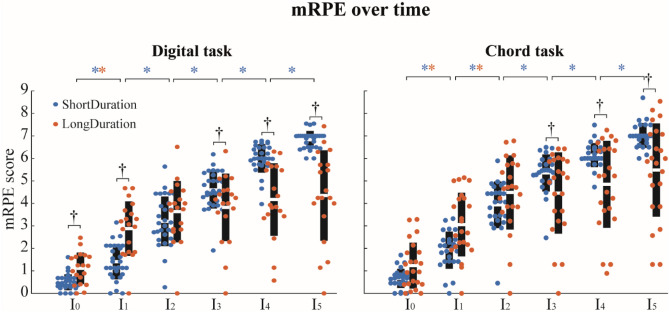
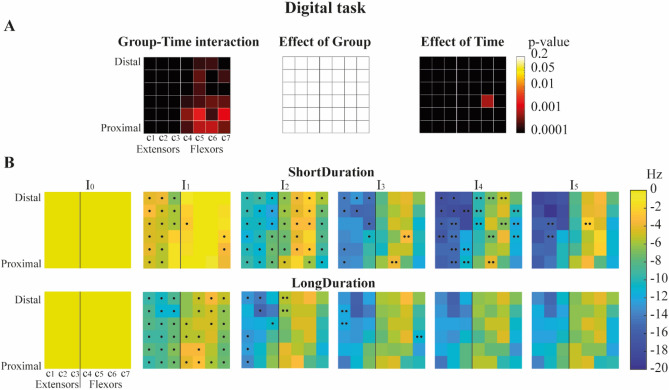
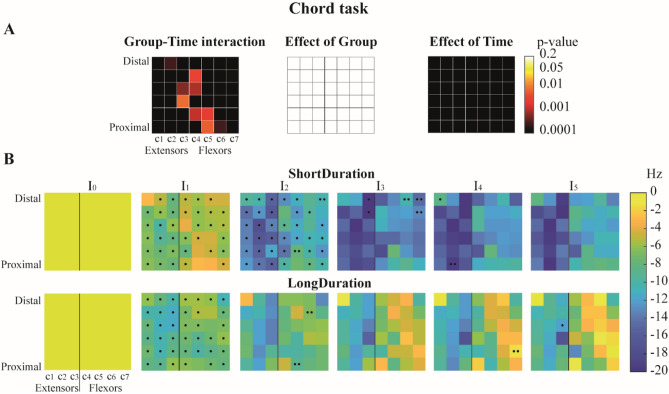
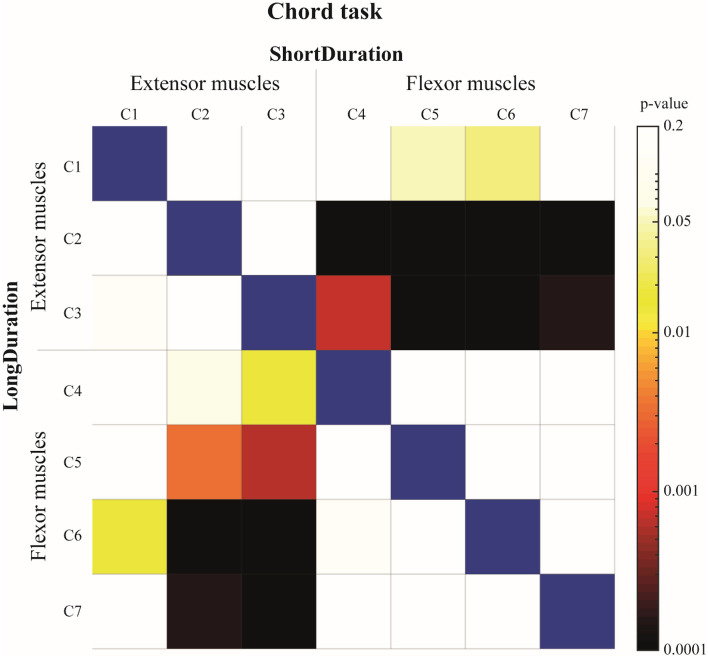
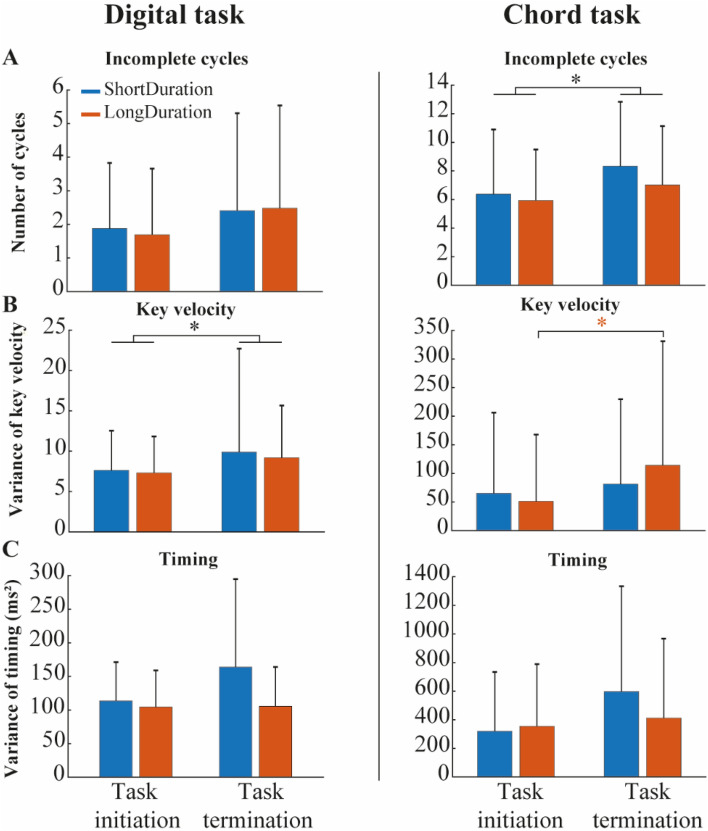
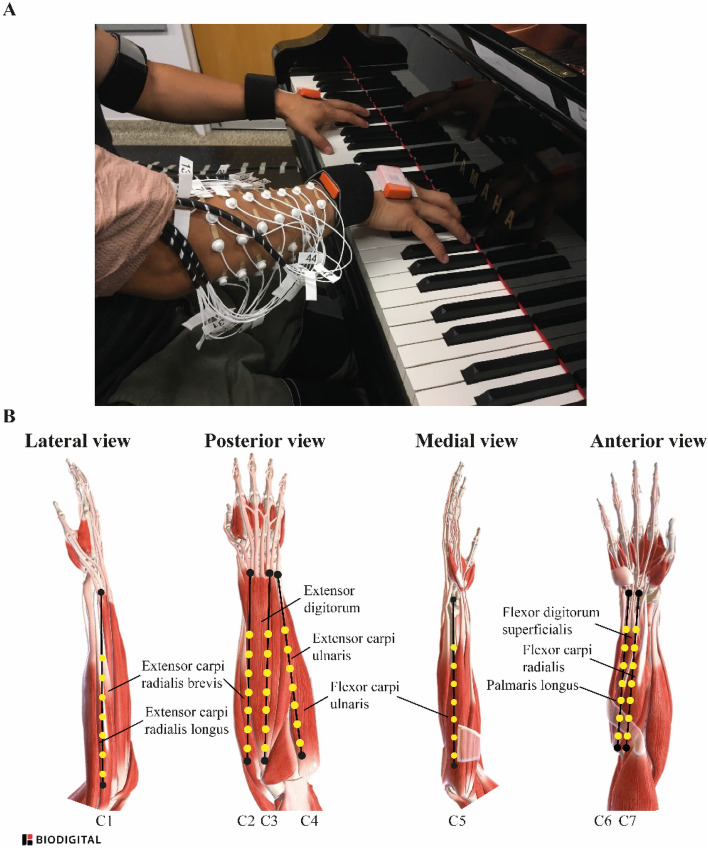
Muscle fatigue is considered as a risk factor for developing playing-related muscular disorders among professional pianists and could affect musical performance. This study investigated in 50 pianists the effect of fatiguing repetitive piano sequences on the development of forearm muscle fatigue and on piano performance parameters. Results showed signs of myoelectric manifestation of fatigue in the 42-electromyographic bipolar electrodes positioned on the forearm to record finger and wrist flexor and extensor muscles, through a significant non-constant decrease of instantaneous median frequency during two repetitive Digital (right-hand 16-tones sequence) and Chord (right-hand chords sequence) excerpts, with extensor muscles showing greater signs of fatigue than flexor muscles. In addition, muscle fatigue negatively affected key velocity, a central feature of piano sound intensity, in both Digital and Chord excerpts, and note-events, a fundamental aspect of musicians' performance parameter, in the Chord excerpt only. This result highlights that muscle fatigue may alter differently pianists' musical performance according to the characteristics of the piece played.


Conflict of interest statement

The authors declare no competing interests.

Figures

Figure 1
Figure 1
Time-to-task termination for (A) the Digital task and (B) the Chord task. Black horizontal lines represent the mean duration for each group, grey boxes represent the standard deviation, and dots represent each participants’ data.
Figure 2
Figure 2
Mean ± standard deviation of mRPE score for each interval for the Digital task (left panel) and the Chord task (right panel). White horizontal lines represent the mean mRPE score for each group, black boxes represent the standard deviation, and dots represent each participants’ data. Blue and red asterisks represents significant differences between successive intervals for the ShortDuration and LongDuration group, respectively. Significant differences between groups (α = 0.05).
Figure 3
Figure 3
(A) colormap representation of ANOVA results’ p values for Group–Time interaction, main effects of Group, and Time for the Digital task. Columns of electrodes are labelled c1 to c7 as illustrated on the Fig. 8B. (B) Average change from baseline (I0) representation of the participants’ EMG median frequency of the forearm muscles throughout the duration of the task (I0:5), for the ShortDuration (superior panel) and LongDuration (inferior panel) groups. Note that ANOVA were performed on EMG median frequency values and that variation from baseline was for representation only. Dots indicate significant differences revealed by post-hoc analyses. One dot indicates a significant difference between time intervals Ii and Ii−1 for a given pair of electrode, while two dots indicates a significant difference between time intervals Ii and Ii−2. For example, at time interval I4 for the ShortDuration group, the dot on the left column (c1) of the top row indicates a significant difference between the EMG median frequency at time intervals I3 and I4, while the two dots on the middle column (c4) of the top row indicates a significant difference between the EMG median frequency at time intervals I2 and I4.
Figure 4
Figure 4
Colormap representation of p values of the Tukey post-hoc analysis for the columns’ comparison of the Digital task. Results of the ShortDuration group are represented above the blue diagonal while results of the LongDuration group are represented below the blue diagonal (α = 0.05). For example, the variation of EMG median frequency (I5–I0) of c1 for the ShortDuration group (first row, first column) is not significantly different from c2 (first row, second column), but is significantly different from c4 (first row, fourth column). Similarly, the variation of EMG median frequency (I5–I0) of c1 for the LongDuration group (first column, first row) is not significantly different from c2 (first column, second row), but is significantly different from c4 (first column, fourth row).
Figure 5
Figure 5
(A) colormap representation of ANOVA results’ p values for Group–Time interaction, main effects of Group, and Time for the Chord task. Columns of electrodes are labelled c1 to c7 as illustrated on the Fig. 8B. (B) Average change from baseline (I0) representation of the participants’ EMG median frequency of the forearm muscles throughout the duration of the task (I0:5), for the ShortDuration (superior panel) and LongDuration (inferior panel) groups. Note that ANOVA were performed on EMG median frequency values and that variation from baseline was for representation only. Dots indicate significant differences revealed by post-hoc analyses. One dot indicates a significant difference between time intervals Ii and Ii-1 for a given pair of electrode, while two dots indicates a significant difference between time intervals Ii and Ii−2. For example, at time interval I4 for the ShortDuration group, the dot on the left column (c1) of the top row indicates a significant difference between the EMG median frequency at time intervals I3 and I4, while the two dots on the second column (c2) of the last row indicates a significant difference between the EMG median frequency at time intervals I2 and I4.
Figure 6
Figure 6
Colormap representation of p values of the Tukey post-hoc analysis for the columns’ comparison of the Chord task. Results of the ShortDuration group are represented above the blue diagonal while results of the LongDuration group are represented below the blue diagonal (α = 0.05). For example, the variation of EMG median frequency (I5–I0) of c1 for the ShortDuration group (first row, first column) is not significantly different from c2 (first row, second column), but is significantly different from c5 (first row, fifth column). Similarly, the variation of EMG median frequency (I5–I0) of c1 for the LongDuration group (first column, first row) is not significantly different from c2 (first column, second row), but is significantly different from c6 (first column, sixth row).
Figure 7
Figure 7
Mean ± standard deviation of (A) incomplete cycles, (B) key velocity variance, and (C) timing variance, for the Digital task (left panel) and the Chord task (right panel). The black * indicate a significant main effect of Time between the initiation and the termination of each repetitive piano task (α = 0.05). The red * indicates a significant difference only for the LongDuration group after post-hoc analysis (α = 0.05).
Figure 8
Figure 8
(A) close-up of the electrodes positioned on the forearm, and (B) schematic view of the 7 × 7 array of electrodes positioned on the forearm and the underlying muscles. Forearm views were generated through BioDigital and electrode positioning was drawn by the authors.

Similar articles

Cited by

References

    1. Bruno S, Lorusso A, Caputo F, Pranzo S, L’Abbate N. Musculoskeletal disorders in piano students of a conservatory. G Ital. Med. Lav. Ergon. 2006;28:25–29. - PubMed
    1. Ling C-Y, Loo F-C, Hamedon TR. Playing-related musculoskeletal disorders among classical piano students at tertiary institutions in malaysia: Proportion and associated risk factors. Med. Probl. Perform. Art. 2018;33:82–89. doi: 10.21091/mppa.2018.2013. - DOI - PubMed
    1. Leaver R, Harris EC, Palmer KT. Musculoskeletal pain in elite professional musicians from British symphony orchestras. Occup. Med. (Lond.) 2011;61:549–555. doi: 10.1093/occmed/kqr129. - DOI - PMC - PubMed
    1. de Oliveira CFC, Vezzá FMG. Musicians’ health: Pain resulting from playing musical instruments among members of orchestras of the ABCD region, São Paulo, Brazil. Rev. Bras. Saúde Ocup. 2010;35:33–40. doi: 10.1590/S0303-76572010000100005. - DOI
    1. Sousa, C. M. G. de. Occupational diseases among professional orchestra musicians from the North of Portugal—treatment with tuina techniques. (2017).

Publication types

LinkOut - more resources