. 2021 Apr 14;11(1):8177.
doi: 10.1038/s41598-021-87759-x.

SIRT1 promotes lipid metabolism and mitochondrial biogenesis in adipocytes and coordinates adipogenesis by targeting key enzymatic pathways

Affiliations

SIRT1 promotes lipid metabolism and mitochondrial biogenesis in adipocytes and coordinates adipogenesis by targeting key enzymatic pathways

Yasser Majeed et al. Sci Rep. .

Abstract

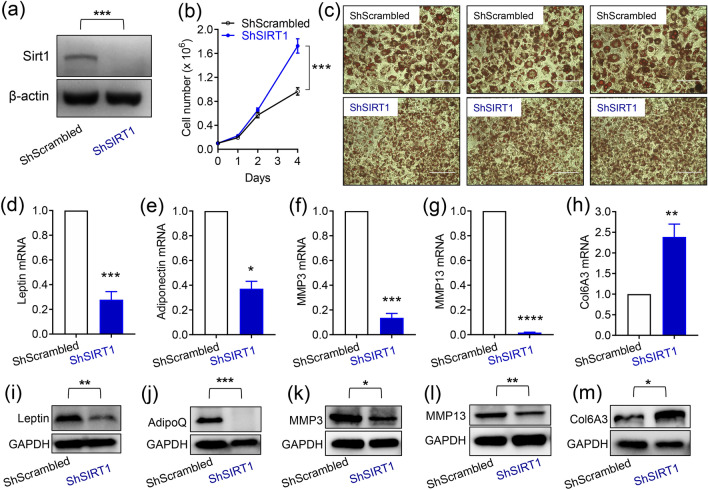
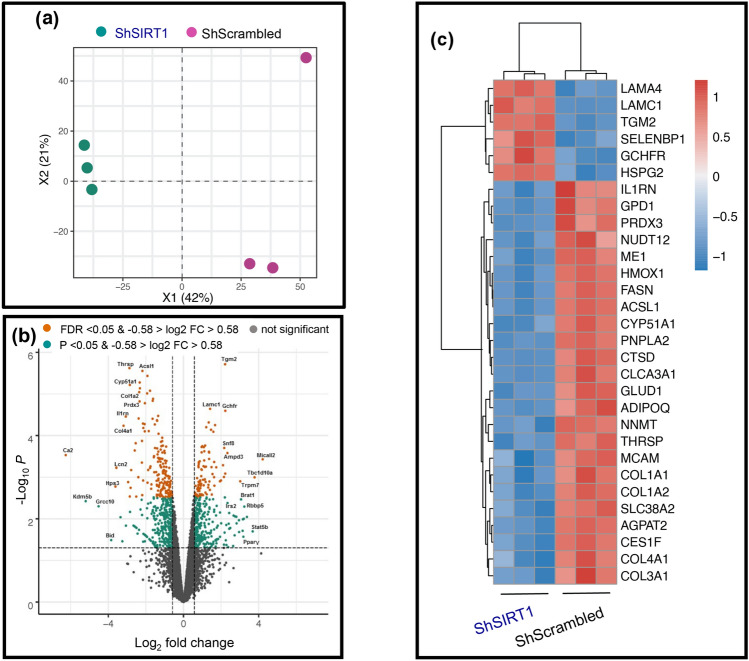
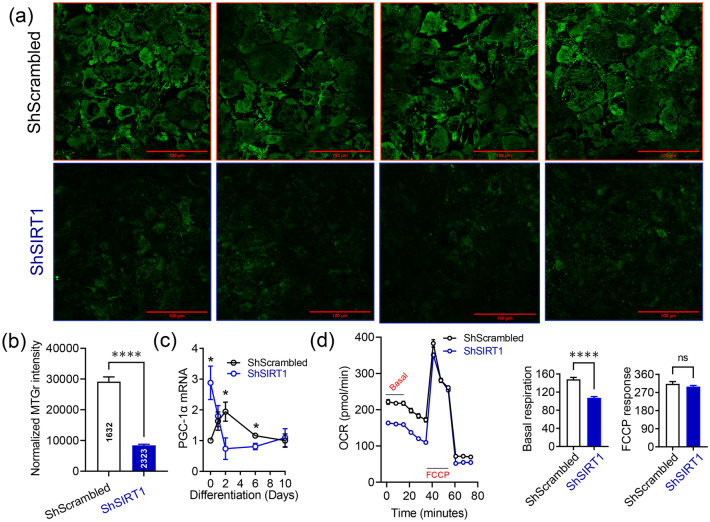
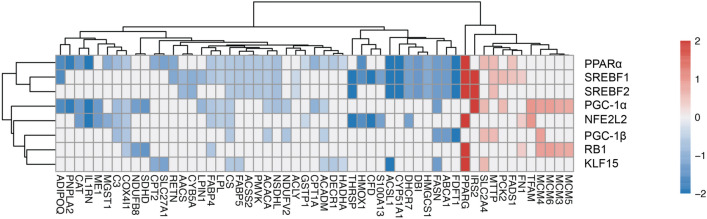
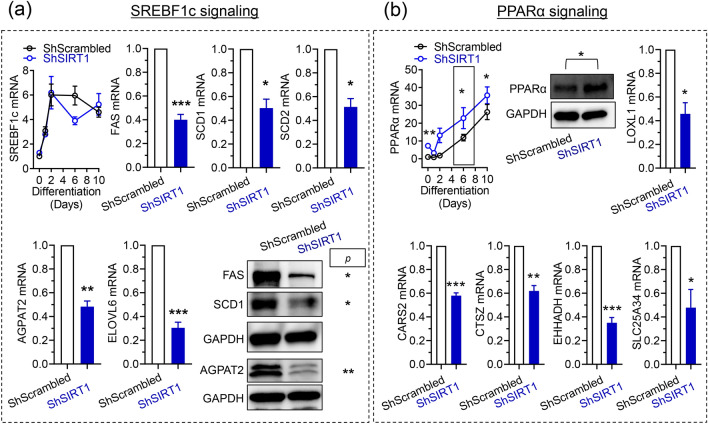
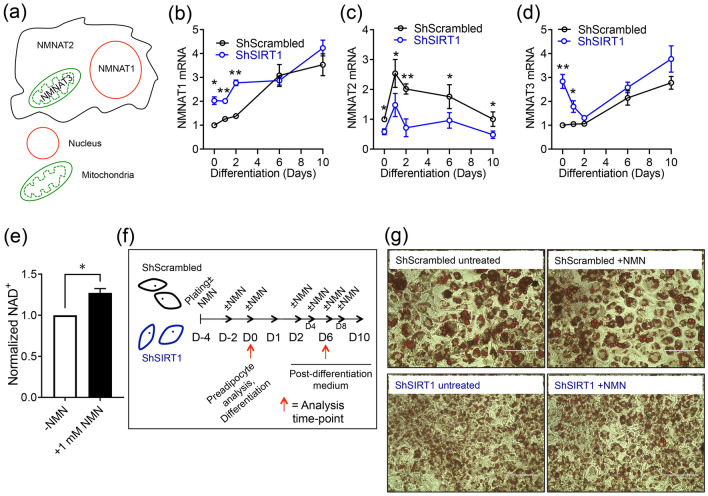
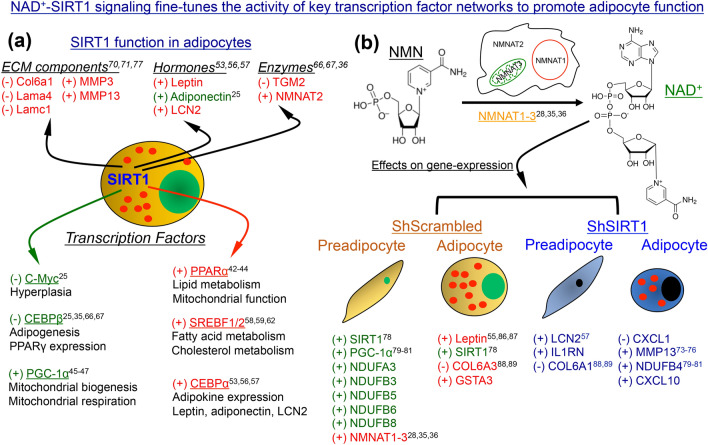
The NAD+-dependent deacetylase SIRT1 controls key metabolic functions by deacetylating target proteins and strategies that promote SIRT1 function such as SIRT1 overexpression or NAD+ boosters alleviate metabolic complications. We previously reported that SIRT1-depletion in 3T3-L1 preadipocytes led to C-Myc activation, adipocyte hyperplasia, and dysregulated adipocyte metabolism. Here, we characterized SIRT1-depleted adipocytes by quantitative mass spectrometry-based proteomics, gene-expression and biochemical analyses, and mitochondrial studies. We found that SIRT1 promoted mitochondrial biogenesis and respiration in adipocytes and expression of molecules like leptin, adiponectin, matrix metalloproteinases, lipocalin 2, and thyroid responsive protein was SIRT1-dependent. Independent validation of the proteomics dataset uncovered SIRT1-dependence of SREBF1c and PPARα signaling in adipocytes. SIRT1 promoted nicotinamide mononucleotide acetyltransferase 2 (NMNAT2) expression during 3T3-L1 differentiation and constitutively repressed NMNAT1 and 3 levels. Supplementing preadipocytes with the NAD+ booster nicotinamide mononucleotide (NMN) during differentiation increased expression levels of leptin, SIRT1, and PGC-1α and its transcriptional targets, and reduced levels of pro-fibrotic collagens (Col6A1 and Col6A3) in a SIRT1-dependent manner. Investigating the metabolic impact of the functional interaction of SIRT1 with SREBF1c and PPARα and insights into how NAD+ metabolism modulates adipocyte function could potentially lead to new avenues in developing therapeutics for obesity complications.


Conflict of interest statement

The authors declare no competing interests.

Figures

Figure 1
Figure 1
SIRT1-depletion suppressed the expression of key adipokines and metalloproteinases and promoted the expression of pro-fibrotic collagens in 3T3-L1 adipocytes. (a) Representative western blot data showing SIRT1 expression in 3T3-L1 preadipocytes infected with either Scrambled shRNA (ShScrambled) or SIRT1-specific shRNA (ShSIRT1). Expression of β-actin was monitored to control for equal loading. (b) Cell proliferation analysis of ShScrambled or ShSIRT1 preadipocytes (n = 6). (c) Representative images of Oil Red O (ORO)-stained Control (ShScrambled) or SIRT1-depleted (ShSIRT1) adipocytes at Day 6 post-differentiation. Scale bar 100 μm (Images representative of 3 independent experiments). (d–h) Quantitative gene-expression analysis of leptin (d), adiponectin (e), MMP3 (f), MMP13 (g), and collagen 6A3 (Col6A3) (h) in ShScrambled or SIRT1-depleted (ShSIRT1) adipocytes (n = 4). (i–m) Western blot data comparing the expression levels of the indicated proteins in ShScrambled or SIRT1-depleted (ShSIRT1) adipocytes (n = 3). Statistical analysis was performed using a Student’s t test (*P < 0.05; **P < 0.01; ***P < 0.001; ****P < 0.0001).
Figure 2
Figure 2
Quantitative proteomics identified altered expression levels of key molecules linked to adipocyte function in SIRT1-depleted adipocytes. (a) Principal component analysis (PCA) plot shows the relationship in overall proteomics profiles upon SIRT1-depletion in three replicates (ShSIRT1; green circles) compared to ShScrambled (purple circles). (b) Volcano plot analysis highlights the most significant protein alterations in SIRT1-depleted adipocytes vs ShScrambled adipocytes based on false discovery rate threshold (orange) [FDR q value < 0.05 and − 0.58 > log2 fold change (FC) > 0.58] and P value threshold (green) [P value < 0.05 and − 0.58 > log2 fold change (FC) > 0.58]. Highlighted in grey are the filtered non-significant changes, as indicated. (c) Heatmap clustering of the thirty most-significant protein alterations in SIRT1-depleted adipocytes vs ShScrambled adipocytes based on fold-change cut-off of > 1.5 and FDR values < 0.01. The color scale of the heatmap represents the log2 ratio of each protein in each replicate.
Figure 3
Figure 3
Identification of significantly-altered molecular pathways in SIRT1-depleted adipocytes. Prediction of significantly-affected molecular pathways by “WikiPathways” analysis (a) or MSigDB Hallmark gene-sets (b) in SIRT1-depleted adipocytes. Annotations from WikiPathways analysis or MSigDB Hallmark gene-sets were used for functional enrichment analysis among differentially expressed proteins (P < 0.05). Significantly enriched pathways (P < 0.05) were used for plotting. Axes show p-value of overlap and highlighted in red and blue are the up-regulated and down-regulated protein sets, respectively.
Figure 4
Figure 4
SIRT1 promoted mitochondrial biogenesis and respiration in 3T3-L1 adipocytes. (a) Representative confocal microscopy images of ShScrambled or SIRT1-depleted (ShSIRT1) adipocytes labelled with 250 nM MitoTracker Green at Day 6 post-differentiation. Scale bar 100 µm. (b) Quantification of MitoTracker Green staining intensity in ShScrambled or SIRT1-depleted (ShSIRT1) adipocytes (normalized to cell number) (n = 3). (c) Quantification of changes in the expression of PGC-1α in ShScrambled or SIRT1-depleted (ShSIRT1) (pre)adipocytes at specific time-points during adipogenesis (n = 4). (d) Evaluation of mitochondrial respiration parameters in ShScrambled or SIRT1-depleted (ShSIRT1) adipocytes using Seahorse technology at Day 6 post-differentiation (n = 12 biological replicates). Statistical analysis of the dataset was performed using a Student’s t test. For statistical analysis of data shown in (c), pair-wise comparisons were made between ShScrambled and ShSIRT1 groups for each individual time-point using the Student’s t test (*P < 0.05; ****P < 0.0001; n.s., not significant).
Figure 5
Figure 5
Identification of significantly-affected transcription factors and target mapping in SIRT1-depleted adipocytes. Heatmap clustering of the most significantly-affected molecules mapped to their upstream regulators in SIRT1-depleted adipocytes. Red and blue indicate up- and down-regulated molecules, respectively. Shown are upstream regulators with a downstream target overlap of P < 10–5 and an IPA activation z score > 2.7 or < − 2.7. The activation z score was calculated by IPA and it predicted if a pathway was activated or inhibited based on the directional change in proteins included in the quantified pathways.
Figure 6
Figure 6
SIRT1-dependence of SREBF1c and PPARα signaling in 3T3-L1 adipocytes. (a) Quantitative analysis of the expression levels of SREBF1c and its downstream transcriptional targets in ShScrambled or SIRT1-depleted (ShSIRT1) adipocytes at Day 6 post-differentiation. (b) Quantitative analysis of the expression levels of PPARα and its downstream transcriptional targets in ShScrambled or SIRT1-depleted (ShSIRT1) adipocytes at Day 6 post-differentiation. Boxed region indicates the time-point at which PPARα protein levels were quantified. In (a,b), qPCR and western blot data were from 4 and 3 independent experiments, respectively. Statistical analysis of the dataset was performed using a Student’s t test (*P < 0.05; ****P < 0.0001; n.s. not significant).
Figure 7
Figure 7
SIRT1 promoted NMNAT2 expression during 3T3-L1 differentiation and constitutively inhibited NMNAT1/3 expression. (a) Illustration of the subcellular localization of NMNAT enzymes. (b–d) qPCR data comparing the expression of NMNAT1 (b), NMNAT2 (c) and NMNAT3 (d) at specific time-points during adipogenesis in ShScrambled or SIRT1-depleted (ShSIRT1) (pre)adipocytes (n = 4). (e) Effect of supplementation with 1 mM NMN on total cellular NAD+ levels in 3T3-L1 preadipocytes (n = 4). (f) Experimental design to test the effect of NMN supplementation on gene-expression during 3T3-L1 adipogenesis. (g) Representative images of Oil Red O (ORO)-stained ShScrambled or SIRT1-depleted (ShSIRT1) adipocytes with (+NMN) or without (−NMN) supplementation with 1 mM NMN. Scale bar, 100 μm. Images were collected at Day 6 post-differentiation and are representative of 3 independent experiments. For statistical analysis of data shown in (b–d), pair-wise comparisons were made between ShScrambled and ShSIRT1 groups for each individual time-point using the Student’s t test (n = 4). A Student’s t test was used to perform statistical analysis on the dataset shown in (e) (n = 4) (*P < 0.05; **P < 0.01).
Figure 8
Figure 8
Supplementation with NMN elicited SIRT1-dependent and -independent changes in gene-expression during 3T3-L1 adipogenesis. (a) NMN-induced changes in expression of the indicated genes were analyzed in four experimental conditions: ShScrambled preadipocytes (ShScrambled D0), ShScrambled adipocytes (ShScrambled D6), ShSIRT1 preadipocytes (ShSirt D0) and ShSIRT1 adipocytes (ShSirt1 D6). (b) Shown are box plots indicating the effects of NMN on gene-expression in each of the 4 conditions, as indicated. Individual blue dots represent the ratio of +NMN/−NMN for each gene. The notched box shows the interquartile range (25th–75th percentile) and the central line within the box represents the median. The whiskers extend to points not considered outliers and data points outside the whiskers were considered quartiles. The dashed red line is set at 1 and the inset table shows the results of Kruskal–Wallis testing on each of these groups. Some of the molecules whose expression was significantly affected by NMN supplementation are also indicated.
Figure 9
Figure 9
NAD+-SIRT1 signaling fine-tunes the activity of key transcription factor networks to promote adipocyte function. (a) Schematic summary of the data obtained by combining quantitative proteomics and gene-expression analysis in adipocytes. Positive or negative effect of SIRT1 on the expression levels of individual molecules (top) or transcription factor pathways (bottom) is indicated by ‘+’ or ‘−’ sign, respectively. Molecules highlighted in red represent those whose interaction with SIRT1 to our knowledge has not been previously reported in the context of adipogenesis, adipose tissue function, or obesity. Evidence of an interaction between SIRT1 and molecules highlighted in green can be found in the literature. (b) Schematic summary of the effects of supplementation with NMN on gene-expression in ShScrambled and ShSIRT1 (pre)adipocytes. Positive or negative effect of NMN supplementation on the expression of indicated genes is indicated by ‘+’ or ‘−’ sign, respectively. Genes highlighted in red represent those whose SIRT1-dependence in response to NMN has not been previously reported, while those in green represent molecules whose association with NAD+-SIRT1 signaling is known. Molecules highlighted in blue represent those whose expression was altered by NMN in SIRT1-depleted (pre)adipocytes, which may reflect residual SIRT1 function or involvement of other NAD+-dependent proteins. Chemical structures of NMN and NAD+ are shown, and conversion of NMN to NAD+ occurs intracellularly by the action of NMNAT enzymes. The numbers indicate citations that link each molecule or pathway to the relevant section in “Discussion”.

References

    1. Garcia-Jimenez C, et al. From obesity to diabetes and cancer: Epidemiological links and role of therapies. Br. J. Cancer. 2016;114:716–722. doi: 10.1038/bjc.2016.37. - DOI - PMC - PubMed
    1. Roden M, Shulman GI. The integrative biology of type 2 diabetes. Nature. 2019;576:51–60. doi: 10.1038/s41586-019-1797-8. - DOI - PubMed
    1. Reilly SM, Saltiel AR. Adapting to obesity with adipose tissue inflammation. Nat. Rev. Endocrinol. 2017;13:633–643. doi: 10.1038/nrendo.2017.90. - DOI - PubMed
    1. Ghaben AL, Scherer PE. Adipogenesis and metabolic health. Nat. Rev. Mol. Cell Biol. 2019;20:242–258. doi: 10.1038/s41580-018-0093-z. - DOI - PubMed
    1. Smith U, Kahn BB. Adipose tissue regulates insulin sensitivity: Role of adipogenesis, de novo lipogenesis and novel lipids. J. Intern. Med. 2016;280:465–475. doi: 10.1111/joim.12540. - DOI - PMC - PubMed

Publication types

MeSH terms

Substances

LinkOut - more resources