. 2021 May;593(7858):294-298.
doi: 10.1038/s41586-021-03458-7. Epub 2021 Apr 14.

Structural basis of long-range to short-range synaptic transition in NHEJ

Affiliations

Structural basis of long-range to short-range synaptic transition in NHEJ

Siyu Chen et al. Nature. 2021 May.

Abstract

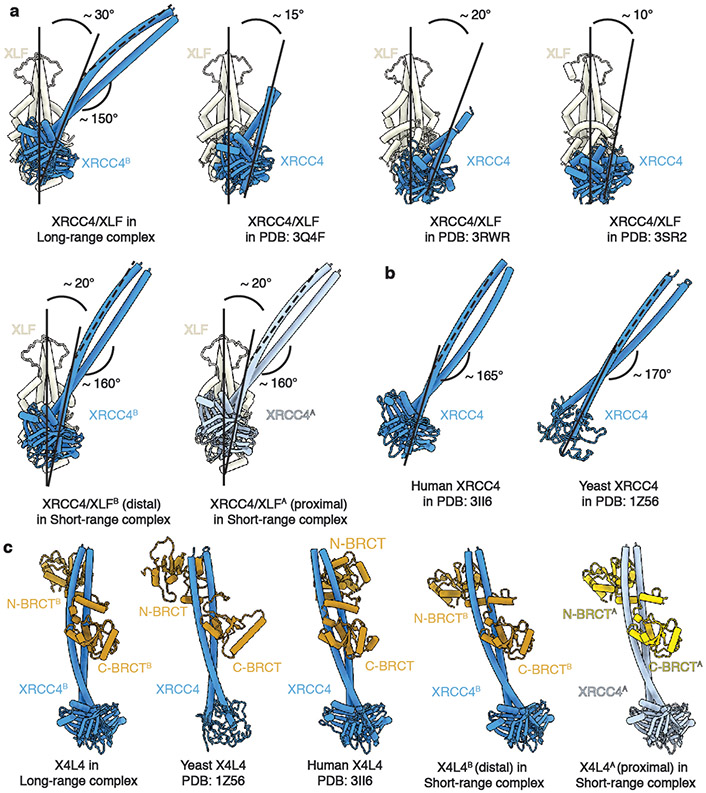
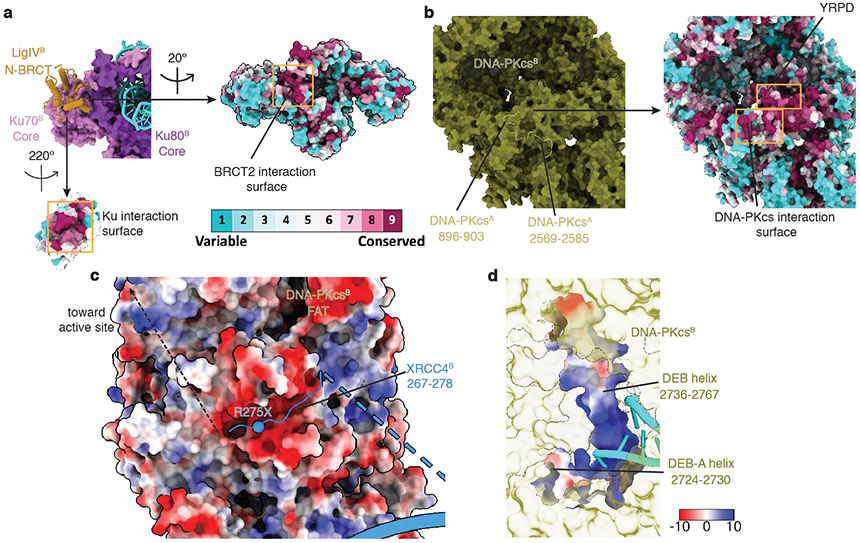
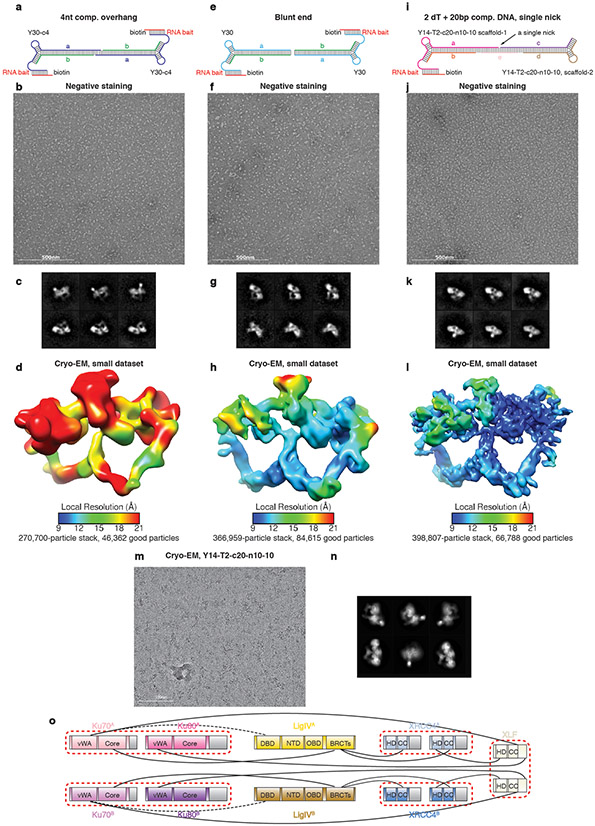
DNA double-strand breaks (DSBs) are a highly cytotoxic form of DNA damage and the incorrect repair of DSBs is linked to carcinogenesis1,2. The conserved error-prone non-homologous end joining (NHEJ) pathway has a key role in determining the effects of DSB-inducing agents that are used to treat cancer as well as the generation of the diversity in antibodies and T cell receptors2,3. Here we applied single-particle cryo-electron microscopy to visualize two key DNA-protein complexes that are formed by human NHEJ factors. The Ku70/80 heterodimer (Ku), the catalytic subunit of the DNA-dependent protein kinase (DNA-PKcs), DNA ligase IV (LigIV), XRCC4 and XLF form a long-range synaptic complex, in which the DNA ends are held approximately 115 Å apart. Two DNA end-bound subcomplexes comprising Ku and DNA-PKcs are linked by interactions between the DNA-PKcs subunits and a scaffold comprising LigIV, XRCC4, XLF, XRCC4 and LigIV. The relative orientation of the DNA-PKcs molecules suggests a mechanism for autophosphorylation in trans, which leads to the dissociation of DNA-PKcs and the transition into the short-range synaptic complex. Within this complex, the Ku-bound DNA ends are aligned for processing and ligation by the XLF-anchored scaffold, and a single catalytic domain of LigIV is stably associated with a nick between the two Ku molecules, which suggests that the joining of both strands of a DSB involves both LigIV molecules.


Figures

Extended Data Fig. 1.
Extended Data Fig. 1.. Optimization of the LR synaptic complex assembly with various DNA substrates.
a, Schematic showing the Y-35 blunt-end DNA substrate. Complex assembly was attempted (supplying DNA-PKcs, Ku, XLF, and LigIV-XRCC4) prior to purification via RNAse-H elution. b, A representative negative staining raw micrograph of the complex assembled as described in a. The raw micrograph is representative of 24 micrographs. c, Representative 2D class-averages of the complex assembled as described in a, showing the appearance of only DNA-PK complex despite the addition of XLF and LigIV-XRCC4. d-f, Same procedure as a-c, showing the complex assembly with the same Y-35 substrate, but adding XLF and LigIV-XRCC4 to purified DNA-PK complex following RNAse-H elution. The raw micrograph is representative of 27 micrographs. In f, 2D class-averages representing the characteristic view of scarce but existing LR complex are obtained. g-i, Same procedure as a-c, showing the complex assembly using Y30-T40-c8 DNA substrate with 40 nt flexible poly-T and 8 bp of complementary ends as 3’ overhang. While the single-stranded poly-T overhang and the 8-bp complementary region contribute to complex stability, they are not observed in any part of the reconstructed density map, presumably because these ssDNA tethers are too flexible to be aligned with the rest of the complex. The raw micrograph is representative of 24 micrographs. The complex was assembled prior to RNAse-H elution as described in a. In i, the majority of the 2D classes correspond to the LR complex. j, A representative cryo-EM raw micrograph (out of 17,114 in total) of the LR complex assembled with the Y30-T40-c8 DNA substrate shown in g. k, Representative 2D class averages of particles (329,784 in total) contributing to the final reconstruction of the LR complex. l, Silver-stained SDS-PAGE (4–12% gradient, biologically replicated three times) showing the input purified subunits (Ku, DNA-PKcs, LigIV-XRCC4, and XLF) and the RNAse-H purified LR and SR complex for cryo-EM data collection. All representative micrographs in b, e, h, j are from at least three biologically replicated experiments. For gel source data, see Supplementary Figure 1. m, Protein-protein interaction network between the components of the LR complex. Major unmodeled regions are shown in gray. Well-documented hetero- or homo-dimers are grouped by red dashed lines. Alternative protein-protein interactions are depicted by black dashed lines. The globular domain within the Ku80 C-terminal region (CTR) is completely flexible in the LR complex, and we do not see evidence of the Ku80 CTR domain swap observed by Chaplin et al.. The putative distance between one Ku80 CTR globular domain and the other copy of the Ku80 C-terminal helix is too far to be reached by the 18-amino acid linker within Ku80. Abbreviations: N-HEAT: N-terminal HEAT domain; M-HEAT: middle HEAT domain; KD: kinase domain; vWA: von Willebrand A domain; CTD: C-terminal domain; DBD: DNA-binding domain; NTD: N-terminal domain; OBD: OB-fold domain; BRCTs: tandem BRCT domains; HD: head domain; CC: Coiled-coil domain.
Extended Data Fig. 2.
Extended Data Fig. 2.. Data-processing scheme of the LR synaptic complex sample.
a, Flow chart of the cryo-EM data processing procedure. The gold-standard Fourier Shell Correlation (FSC) curves (0.143 cutoff) show the final resolution of the holo-complex and each body. b, sample maps and fitted models of DNA-PKcs (olive) and dsDNA substrate (cyan) from the LR complex are shown at 4.1Å resolution. Maps are shown as transparent surfaces, and models are shown as sticks, respectively.
Extended Data Fig. 3.
Extended Data Fig. 3.. Comparing the structure of Ku among the LR synaptic complex, the SR synaptic complex, and previously published models.
a, Ku structure in the LR complex showing outward rotations of both Ku70 and Ku80 vWA domains. b, Crystal structure of XLF KBM bound Ku showing the outward rotation of only Ku80 vWA domain. c, Crystal structure of apo Ku showing no rotation of either Ku70 or Ku80 vWA domains. d, Conformation of Ku shown in the cryo-EM structure of apo DNA-PK complex. Ku70 vWA domain is rotated outward, triggered by binding of DNA-PKcs. e-f, Two copies of XLF KBM bound Ku in the SR complex. The conformation of both copies is the same as the one in the LR complex (a), despite the fact that DNA-PKcs is not present. Color codes for Ku70 and Ku80 are the same as in Fig. 1.
Extended Data Fig. 4.
Extended Data Fig. 4.. Comparing the structure of LigIV-XRCC4-XLF scaffold among the LR synaptic complex, the SR synaptic complex, and previously published models.
a, Structure of XRCC4-XLF from the LR complex is shown in comparison with XRCC4-XLF filamentous repeat crystal structures and the ones from the SR complex (both copies). The XLF dimer is used to align all of the models shown here. Solid lines are aligned with the coiled-coils (CC) of XLF (vertical) and XRCC4 (tilted), and the angles in between are shown, respectively. Dashed lines are aligned with the C-terminal half of CC of XRCC4 when full helices are present, and the bending angles are shown as well. b, XRCC4 in the crystal structure of human and yeast LigIV-XRCC4 complex, are shown after aligning with XRCC4 in the LR complex shown in a. The bending of XRCC4 CC is more similar to the one in the SR than in the LR complex. c, Structure of LigIV-XRCC4 complex from the LR complex is shown in comparison with human and yeast LigIV-XRCC4 crystal structures and ones from the SR complex (both copies). Color codes for XLF, XRCC4, and LigIV BRCT domains are the same as in Fig. 1.
Extended Data Fig. 5.
Extended Data Fig. 5.. Surface electrostatic potential and conservation of different areas in the LR synaptic complex.
a, Close-up view of the interaction surface between LigIV N-BRCT domain and Ku70 vWA domains colored by sequence conservation. b, Close-up view of the DNA-PKcs-DNA-PKcs interaction surface colored by sequence conservation. c, Surface electrostatic potential view of DNA-PKcs near its FAT domain, showing its negatively charged interface between XRCC4 C-terminal region (ribbon). The approximate path of the XRCC4 C-terminal peptide containing multiple phosphorylation sites is depicted. The sphere depicts the location of a cancer-associated truncation mutation that occurs at the interface. d, Surface electrostatic potential view of DNA-PKcs DEB and DEB-A helix. The DNA-interaction surface is positively charged. When models are not colored by either surface electrostatic potential or sequence conservation, the color codes are the same as in Fig. 1. We cannot rule out the unlikely possibility that the stabilization of the DEB helix is due to the presence of a 3’ overhang that existed in our DNA substrate design (Extended Data Fig. 1g).
Extended Data Fig. 6.
Extended Data Fig. 6.. Comparing the dimerization of DNA-PKcs in the LR synaptic complex with other PIKK family dimers.
a, Structure of the two DNA-PKcs in the LR complex. The Kinase domain (KD) is aligned with the homologous domains in b and c as an anchor point. b-c, Dimer of ATR-ATRIP (b) and ATM (c) showing aligned KD and corresponding N-terminus HEAT regions in the aligned copy. The symmetric-look front views are shown at the bottom left corner. Each protomer of ATR-ATRIP and ATM and colored the same as the corresponding DNA-PKcs protomer, in olive (the aligned copy) and dark khaki (the other copy). d, Domain organization of DNA-PKcs compared with ATR and ATM. Abbreviations are the same as in Fig. 1. In our model, both the ABCDE (T2609, S2612, T2620, S2624, T2638, and T2647) and the PQR (S2023, S2029, S2041, S2053, and S2056) phosphorylation sites are located within disordered loops of DNA-PKcs 2606-2720 and 1993-2084, respectively (Fig. 2b,d). The kinase active center from the opposite side cannot reach most of the ABCDE sites unless the YRPD-Interaction (YRPD-I) loop (residue 2586-2604) is peeled off from the YRPD motif (Fig. 2d). In turn, this conformational change potentially disrupts the DNA-PKcs-DNA-PKcs dimerization interface through loop 2569-2585 (Fig. 1d). Similarly, some PQR sites are located too far from the trans kinase active center. PQR autophosphorylation induced changes could have a direct impact on the Ku80 CTR-DNA-PKcs interface at the bottom of the cradle (Fig. 2d), potentially inducing the domain-swap of Ku80 observed by Chaplin et al..
Extended Data Fig. 7.
Extended Data Fig. 7.. Optimization of the SR synaptic complex assembly with various DNA substrates.
a, Schematic showing the Y30-c4 DNA substrate with 4nt 3’ complementary overhang. The complex was assembled prior to RNAse-H elution. b, A representative negative staining raw micrograph of the complex assembled as described in a. The raw micrograph is representative of 23 micrographs. c, Representative 2D class-averages of the complex assembled as described in a. d, Cyro-EM map reconstructed from a small dataset using Y30-c4 DNA substrate shown in a. The map is colored by local resolution estimation. e-h, Same procedure as a-d, showing the complex assembly with the Y30 blunt end substrate. Stably assembled SR complexes on DNA substrates with either complementary or blunt ends indicates that these complexes are stable in the absence of any bridging effect from DNA. The raw micrograph is representative of 24 micrographs. i-l, Same procedure as a-d, showing the complex assembly with the Y14-T2-c20-n10-10 substrate, with one central single non-ligatable nick. The raw micrograph is representative of 24 micrographs. Strand e is added at last after mixing the two halves together with NHEJ factors. m, A representative cryo-EM raw micrograph (out of 32,723 total images) of the SR complex assembled with the Y14-T2-c20-n10-10 DNA substrate shown in i. n, Representative 2D class averages of particles (175,866 in total) contributing to the final reconstruction of the SR complex. All representative micrographs in b, f, j, m are from at least three biologically replicated experiments. o, Protein-protein interaction network between the components of the SR complex. Major unmodeled regions are shown in gray. Well-documented hetero- or homo-dimers are grouped by red dashed circles. Alternative protein-protein interactions are depicted by black dashed lines.
Extended Data Fig. 8.
Extended Data Fig. 8.. Data-processing scheme of the SR synaptic complex sample.
Flow chart of the cryo-EM data processing procedure. The gold-standard FSC curves (0.143 cutoff) show the final resolution of the holo-complex and each body.
Extended Data Fig. 9.
Extended Data Fig. 9.. Surface conservation of different areas in the SR synaptic complex.
a, Close-up view of the interaction surface between LigIV DBD and Ku70 vWA domain colored by sequence conservation. DNA-PKcs clashes with LigIV DBD when Ku is aligned between the LR and SR complex b, Close-up view of XLF CC at its C-terminal tip colored by sequence conservation. When models are not colored by sequence conservation, the color codes are the same as in Fig. 3. c, Superimposition of two asymmetric SR complexes after a 180° flip shown in front (top) and top (bottom) views. XLF homodimer is used for aligning the two conformers. LigIV catalytic domains are hidden for clarity purposes. The transition from the apo state to the flipped state indicates potential conformational changes during the tandem ligation. Paths of DNA are also highlighted by dashed lines. d, Close-up view showing the relative positions of the two off-centered nicks between the two conformers. The two preferential nick positions are separated by approximately 4 bp. Consistently, dsDNA with 4nt 3’ overhang, a major end-processing product of the NHEJ nuclease–Artemis, is reported to be a favored substrate for NHEJ. Intriguingly, our model suggests that dsDNA with a 4 nt 3’ overhang will experience minimum DNA translocation to accommodate the two ligation steps (Supplementary Video 3).
Extended Data Fig. 10.
Extended Data Fig. 10.. Both LR and SR synaptic complexes are able to perform double ligation during NHEJ in vitro.
a, Substrate design for the ligation assay. An Internal Cy5 label is added to only the right half of the substrate to visualize the ligation products. A 4 nt 3’ complementary overhang has been introduced on both sides of the substrate. b, Denaturing gel analysis of end-joining by the LR complex. 100nM of DNA, 200 nM of DNA-PKcs, and Ku70/80, 500nM of XLF, and 70nM of X4L4 were added, respectively. Asterisk indicates alternative secondary structure or impurity of the cy5-labeled oligo. Size of the DNA substrates and ligation products are labeled on the left (unit: bp) c, Denaturing gel analysis of end-joining by the SR complex. The final factor concentrations are the same as in b. For gel source data, see Supplementary Figure 1. Similar conditions for either of the gel have been replicated as biological replicates for two times.
Figure 1.
Figure 1.. Cryo-EM structure of the LR synaptic complex.
a, Front (left) and top (right) views of the cryo-EM composite map (see Methods) of the LR complex assembled in the presence of ADP. b, Corresponding views of the structural model of the LR complex. Subunits are colored here and in all subsequent figures, as in a. c, An overview of the two DSBs within the LR complex. DNA elements are shown as solid ribbons and others in transparent representation. The distance between the two DSB ends is highlighted. d, Close-up view showing the interface between the LigIV N-BRCT (ribbon) and Ku70/80 core (surface) domains. Regions of the N-BRCT domain involving in the interaction are depicted. e, Close-up view showing the interface between the two copies of DNA-PKcs.
Figure 2.
Figure 2.. Activation mechanism of DNA-PKcs in the LR synaptic complex.
a, Superimposition of the DNA-PK complex in the apo states (left, PDB: 6ZHA; right, PDB: 7K0Y) with active DNA-PK derived from the LR complex. Transitions from the stand-alone states (gray) to the activated state are shown as curved arrows, indicating conformational changes induced by its assembly into the LR complex. b, Stabilization of a DNA-end blocking (DEB) helix within DNA-PKcs. Superimpositions of loops mediating DNA-PKcs–DNA-PKcs interaction, as well as the DNA end, are highlighted. c, Comparison of the kinase active site between the LR complex (olive), apo DNA-PK (purple and red), mTOR (cyan), and CDK2 (green). A flexible PIKK regulatory domain (PRD) represents the hallmark of activated kinase, as shown in all but DNA-PK in the LR complex. d, Structural organization of DNA-PKcs kinase active sites relative to different phosphorylation sites at the ABCDE and PQR cluster, as well as near the DNA-PK-DNA-PK and DNA-PKcs-Ku80 C-term helix interface.
Figure 3.
Figure 3.. Cryo-EM structure of the SR synaptic complex.
a, Front (left) and top (right) views of the cryo-EM composite map (see Methods) of the SR complex. b, Corresponding views of the structural model of the SR complex. c, Close-up view showing the interface between the LigIV DBD (ribbon) and Ku70 vWA (surface) domains. Regions of the LigIV DBD domain involved in the interaction are depicted. d, Close-up view showing the interface between the XLF CC (ribbon) and the two Ku70 vWA (surface) domains. Spheres depict the locations of missense or truncation mutation residues from cancer patients that occur at the interface, although D176X and D178X truncations are also expected to impact XLF-Ku80 interaction due to the lack of XLF C-terminal KBM,.
Figure 4,
Figure 4,. Structural transition from the LR to the SR synaptic complex.
a, Superimposition of the LR and SR complexes shown in front (left) and top (right) views. XLF homodimer is used for aligning the two conformers. DNA-PKcs and LigIV catalytic domains are hidden for clarity. The transition from the LR to the SR synaptic state indicates potential conformational changes induced by dissociation of DNA-PKcs and association of the LigIV catalytic domain. b, Model of structural transitions during NHEJ. After DSB detection by Ku70/80, DNA-PKcs is recruited to form a DNA-PK complex by inward translocation on DNA (1). A LigIV-XRCC4-XLF-XRCC4-LigIV scaffold assembles the two DNA-PK complexes into the LR complex, positioning the major auto-phosphorylation clusters near the kinase active centers in a trans manner (2). Upon auto-phosphorylation and dissociation of DNA-PKcs, the complex transitions into the SR complex, allowing the recognition and sealing of one nick by one LigIV catalytic domain (3). The complex next undergoes a conformational change and possibly DNA translocation to allow the recognition and sealing of the other nick by the second LigIV catalytic domain from the opposite side (4). The ligase factors then dissociate, and the DSB is repaired (5).

References

    1. Aplan PD Causes of oncogenic chromosomal translocation. Trends Genet. 22, 46–55 (2006). - PMC - PubMed
    1. Zhao B, Rothenberg E, Ramsden DA & Lieber MR The molecular basis and disease relevance of non-homologous DNA end joining. Nat. Rev. Mol. Cell Biol 32, 66–17 (2020). - PMC - PubMed
    1. Malu S, Malshetty V, Francis D & Cortes P Role of non-homologous end joining in V(D)J recombination. Immunol. Res 54, 233–246 (2012). - PubMed
    1. Gottlieb TM & Jackson SP The DNA-dependent protein kinase: requirement for DNA ends and association with Ku antigen. Cell 72, 131–142 (1993). - PubMed
    1. Yin X, Liu M, Tian Y, Wang J & Xu Y Cryo-EM structure of human DNA-PK holoenzyme. Cell Res. 87, 237 (2017). - PMC - PubMed

Publication types

MeSH terms

LinkOut - more resources