. 2021 Apr;592(7856):789-793.
doi: 10.1038/s41586-021-03445-y. Epub 2021 Apr 14.

CRL4AMBRA1 is a master regulator of D-type cyclins

Affiliations

CRL4AMBRA1 is a master regulator of D-type cyclins

Daniele Simoneschi et al. Nature. 2021 Apr.

Abstract

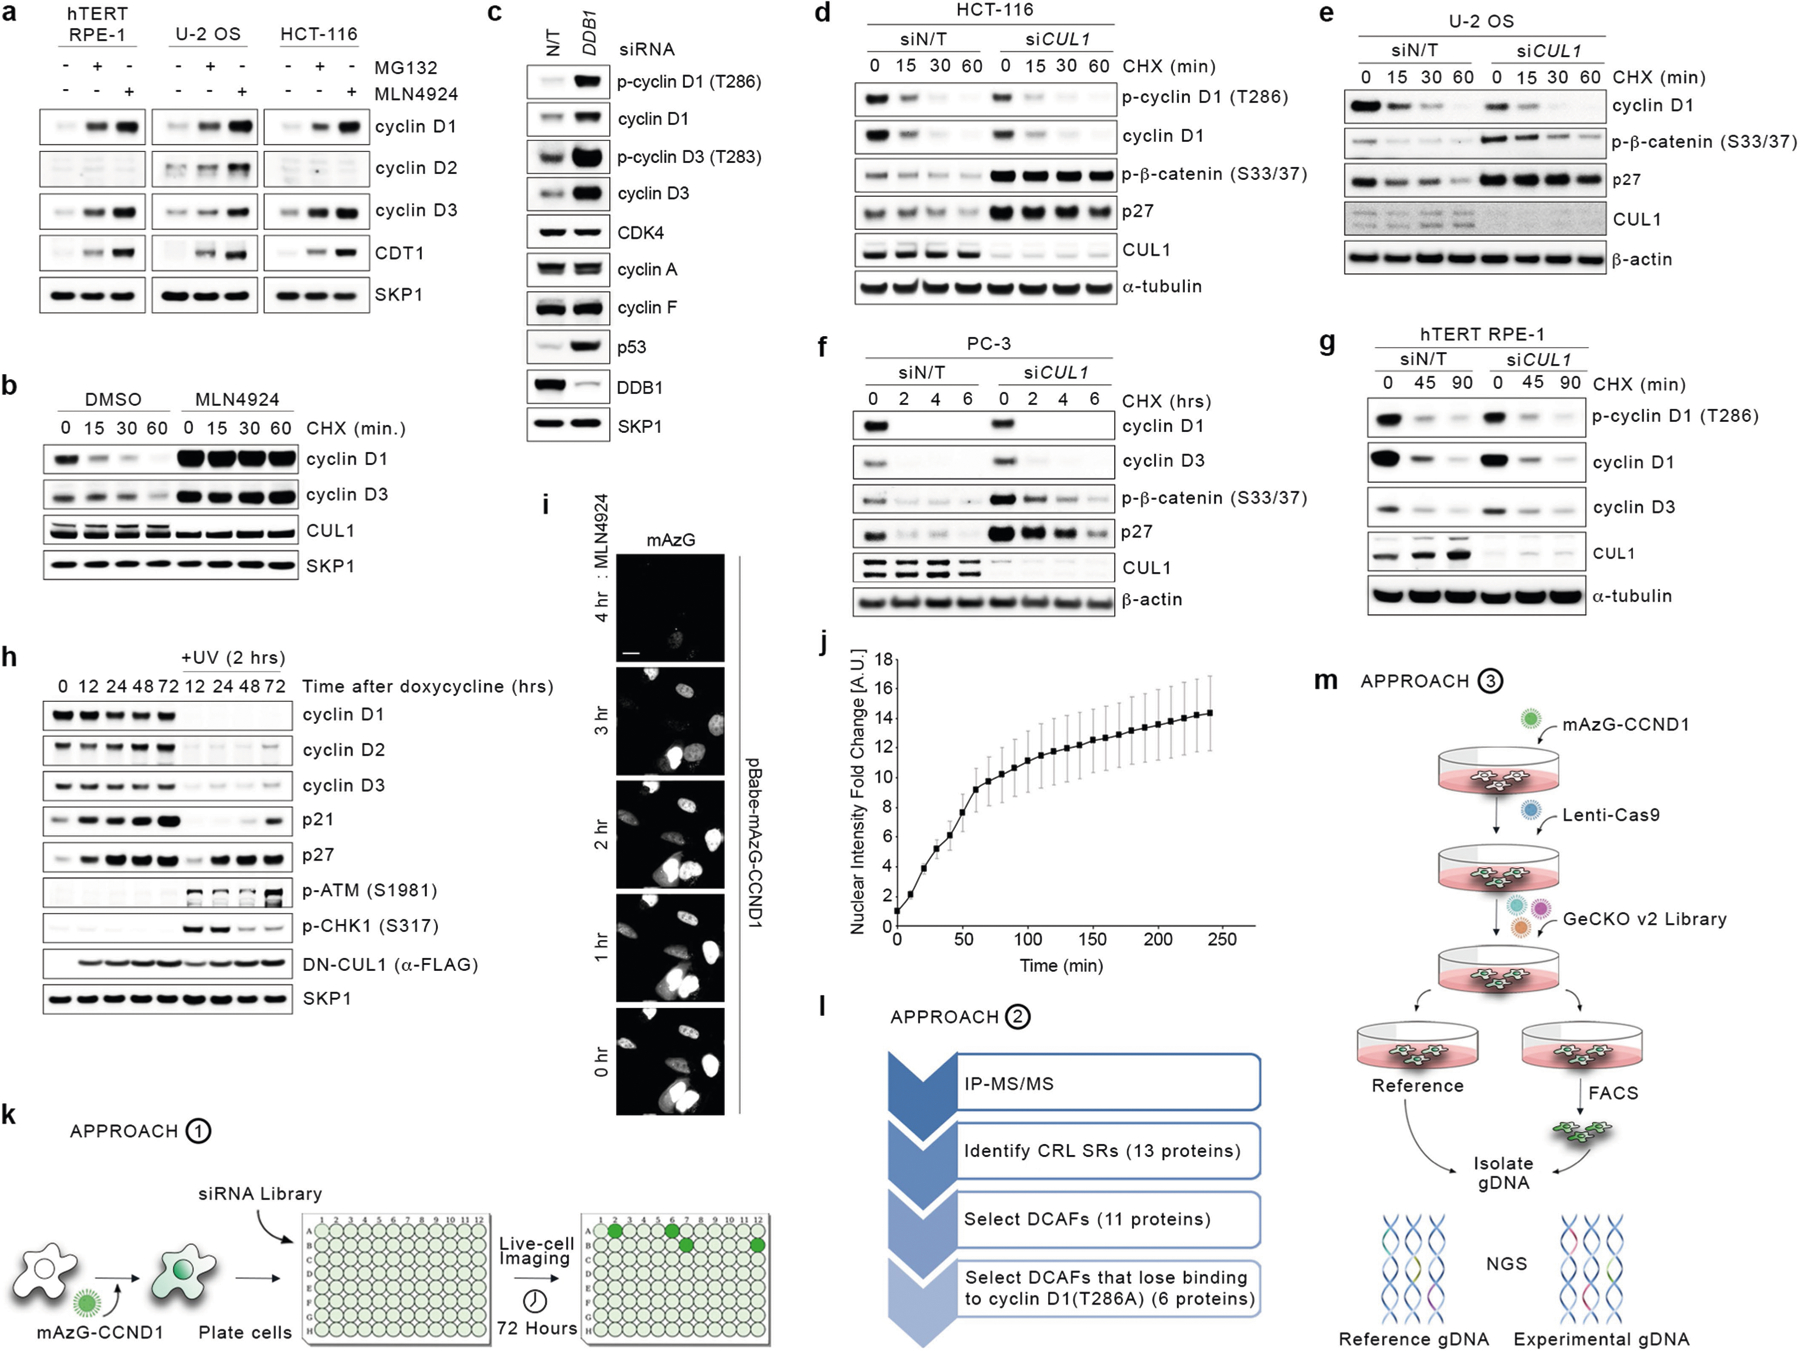
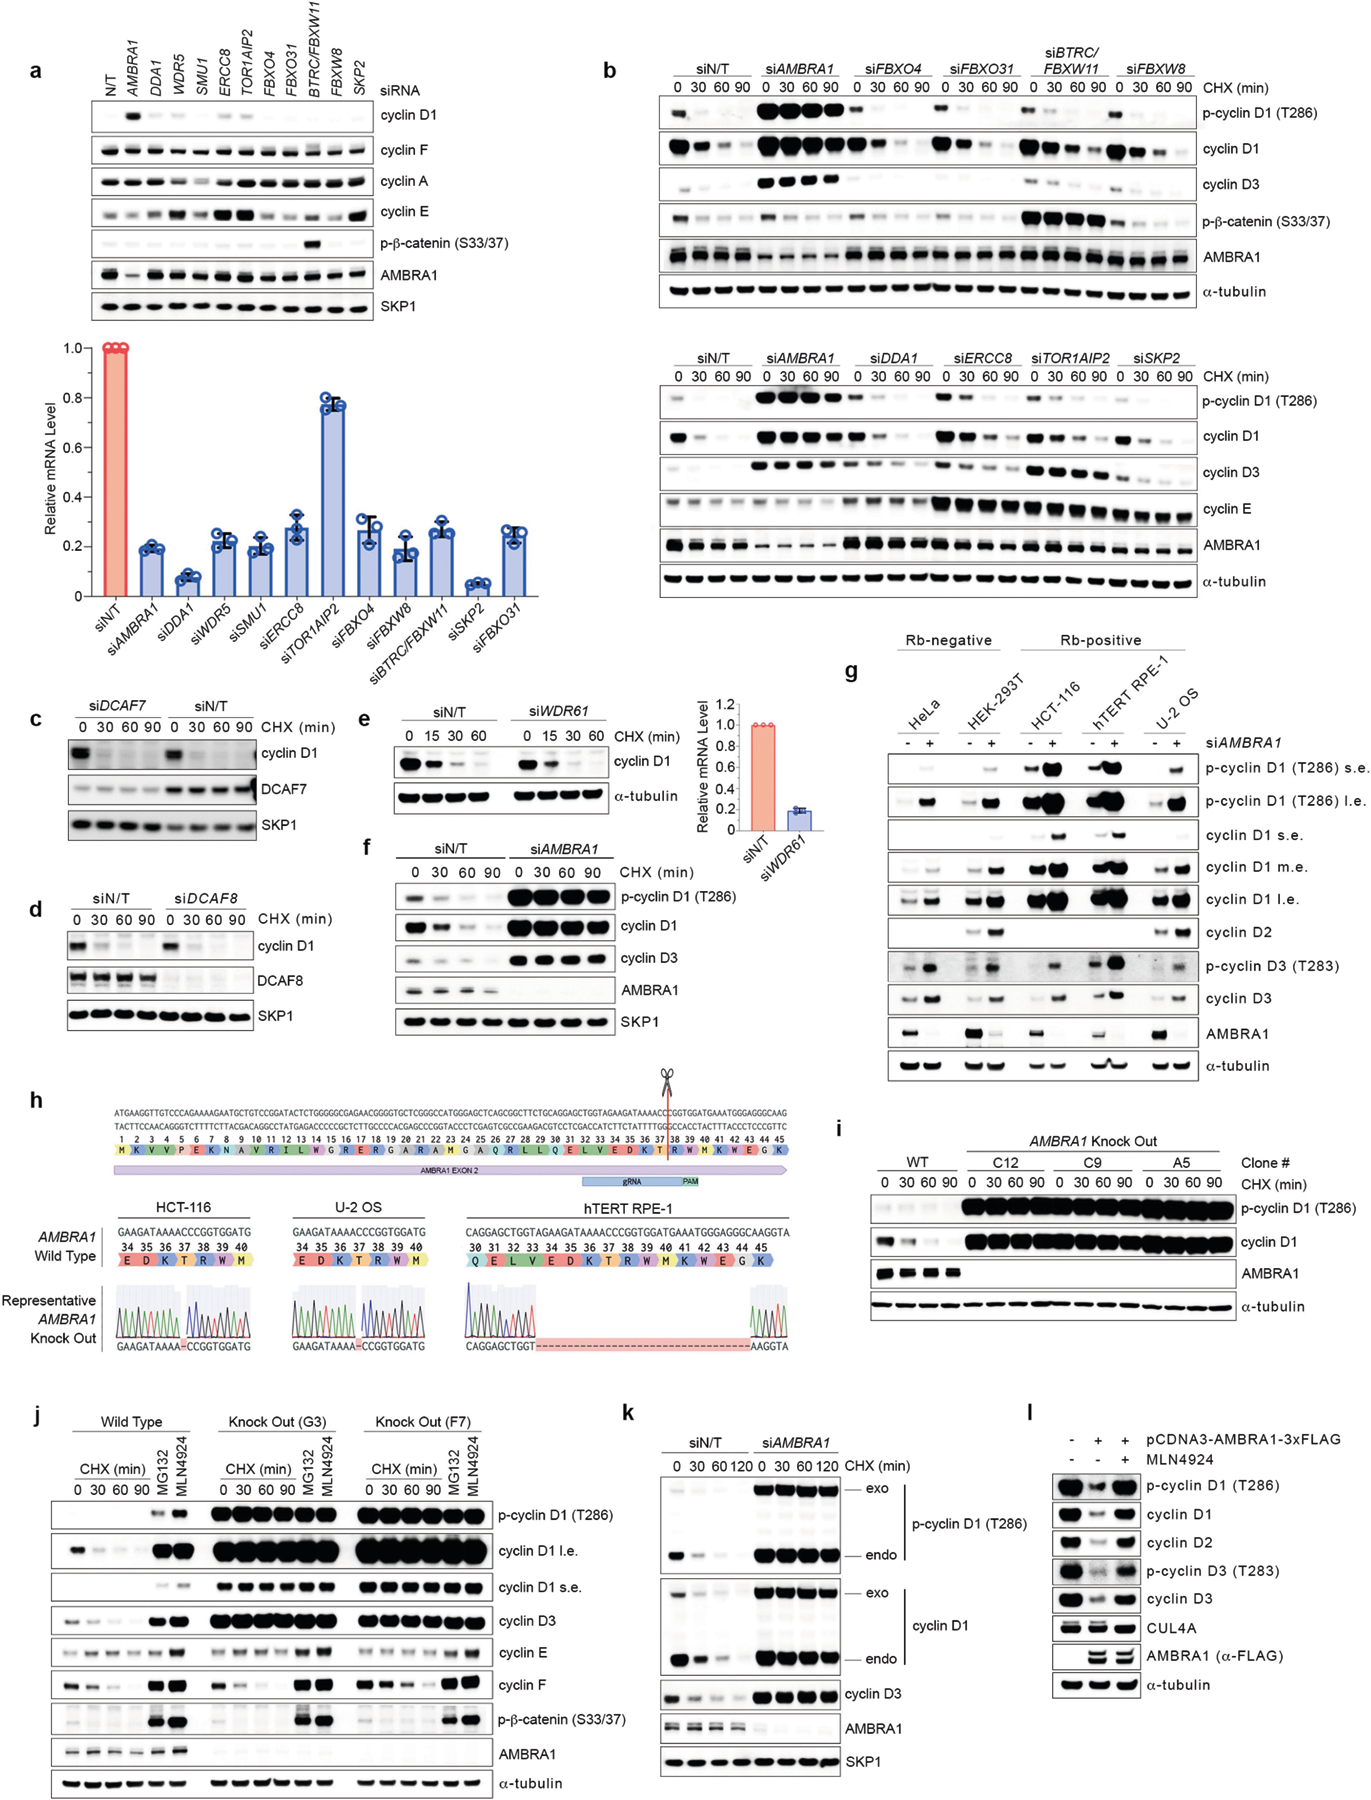
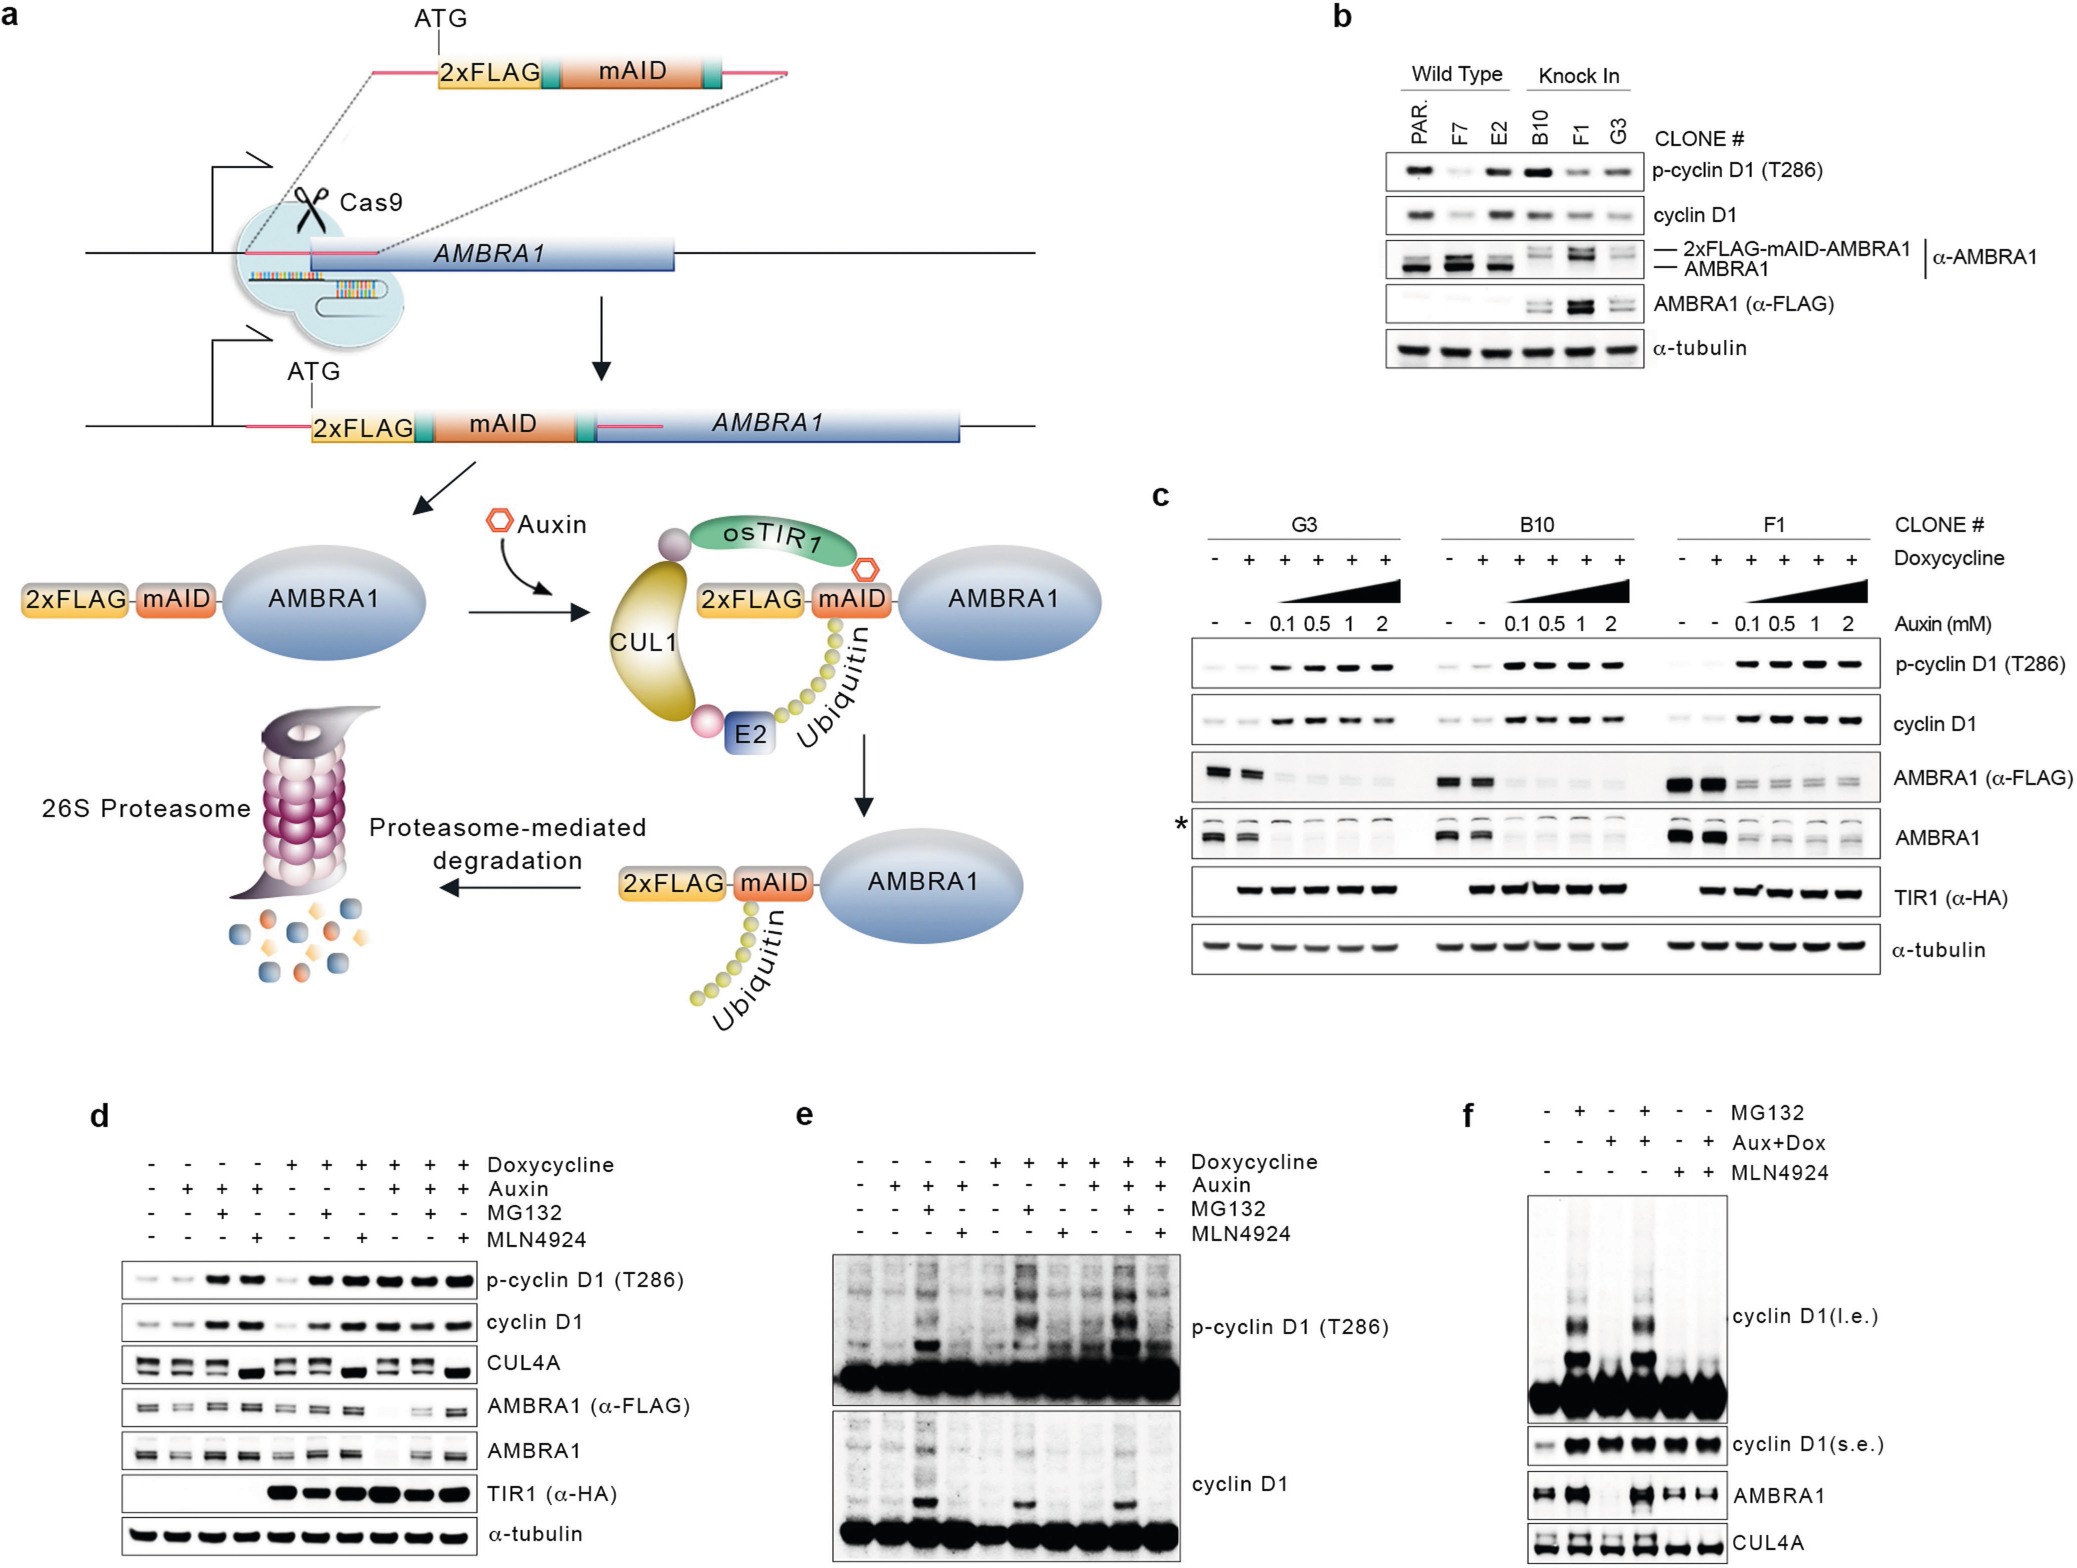
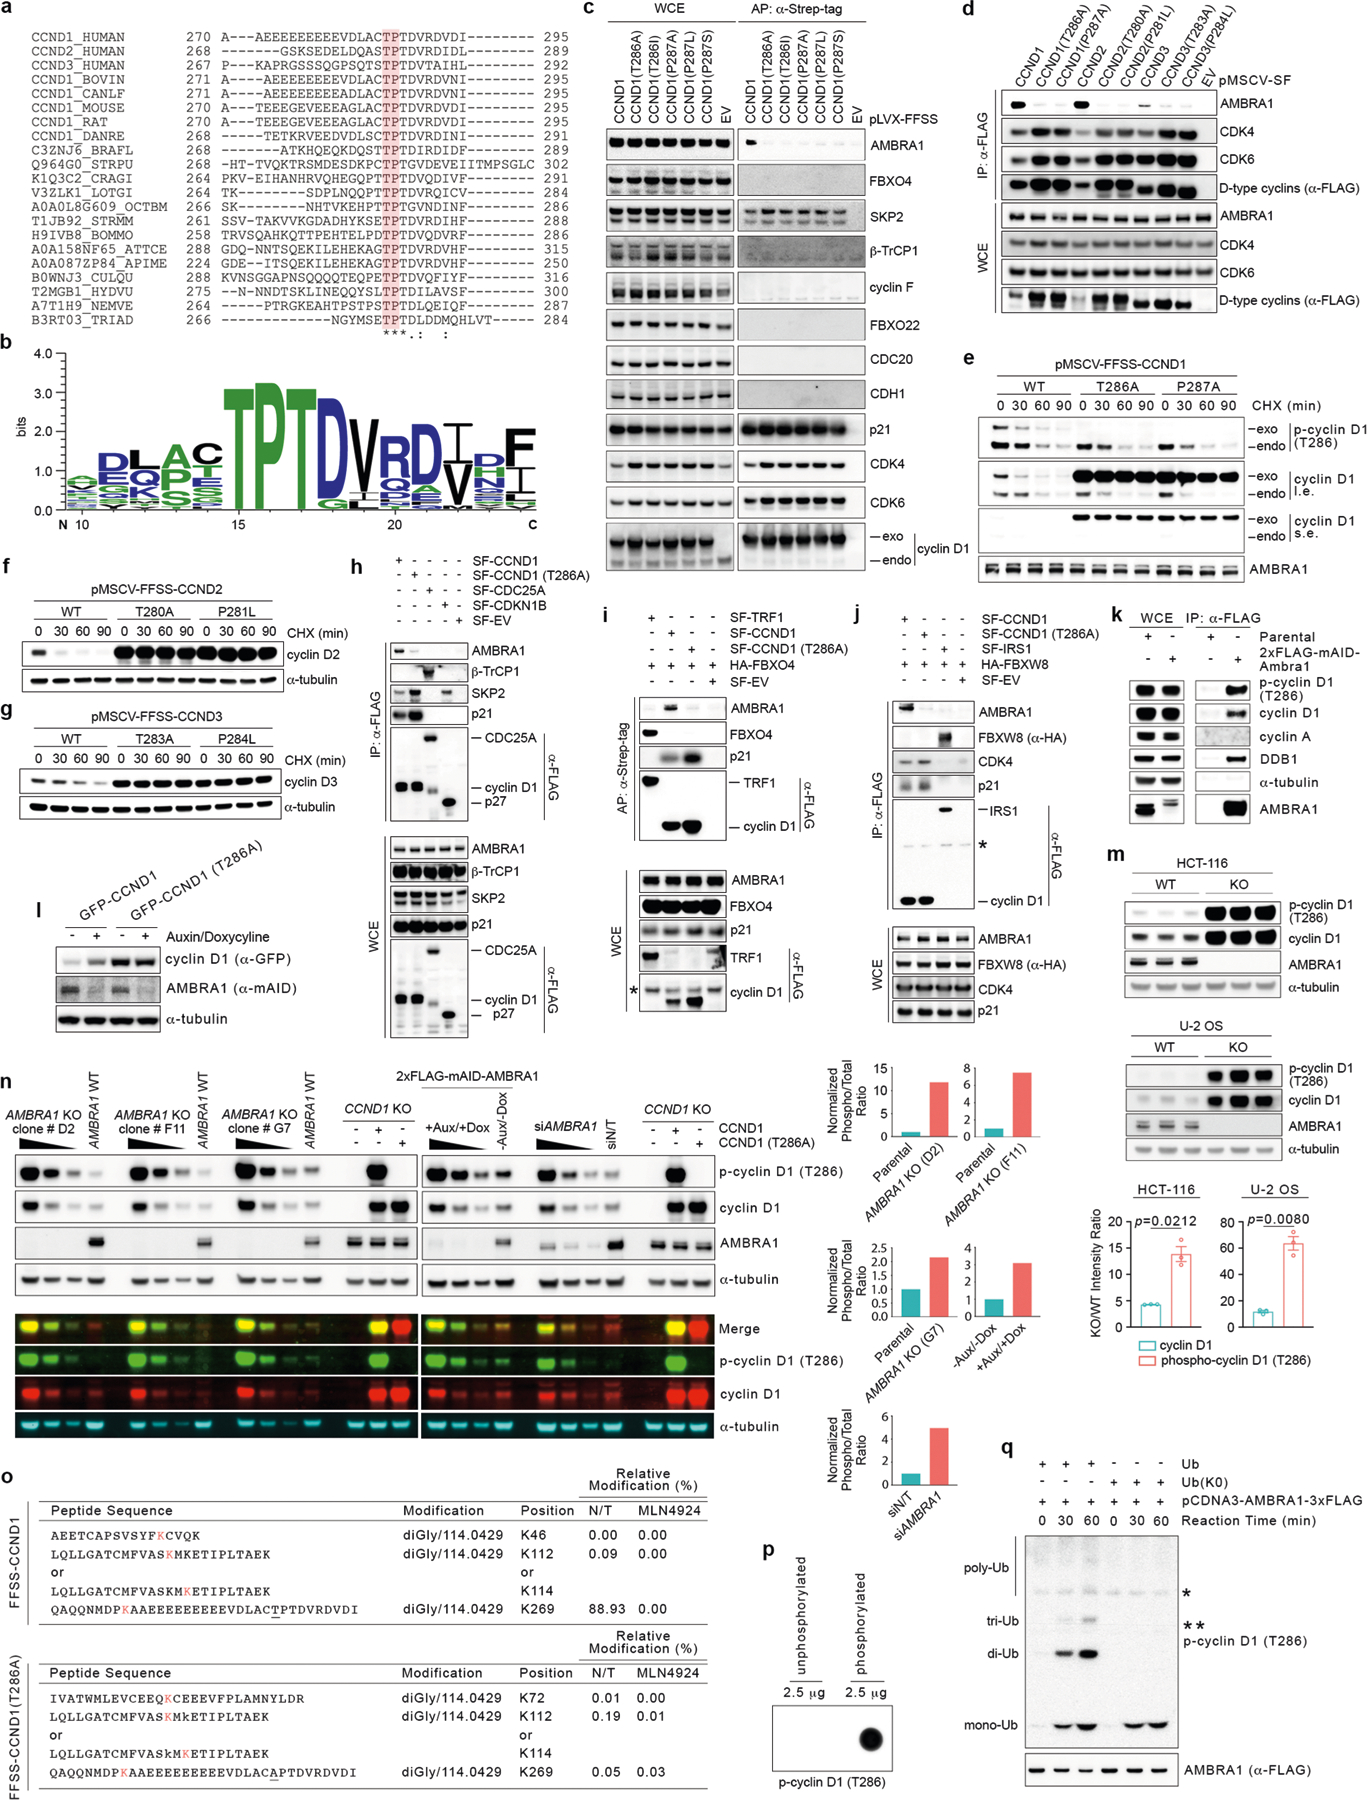
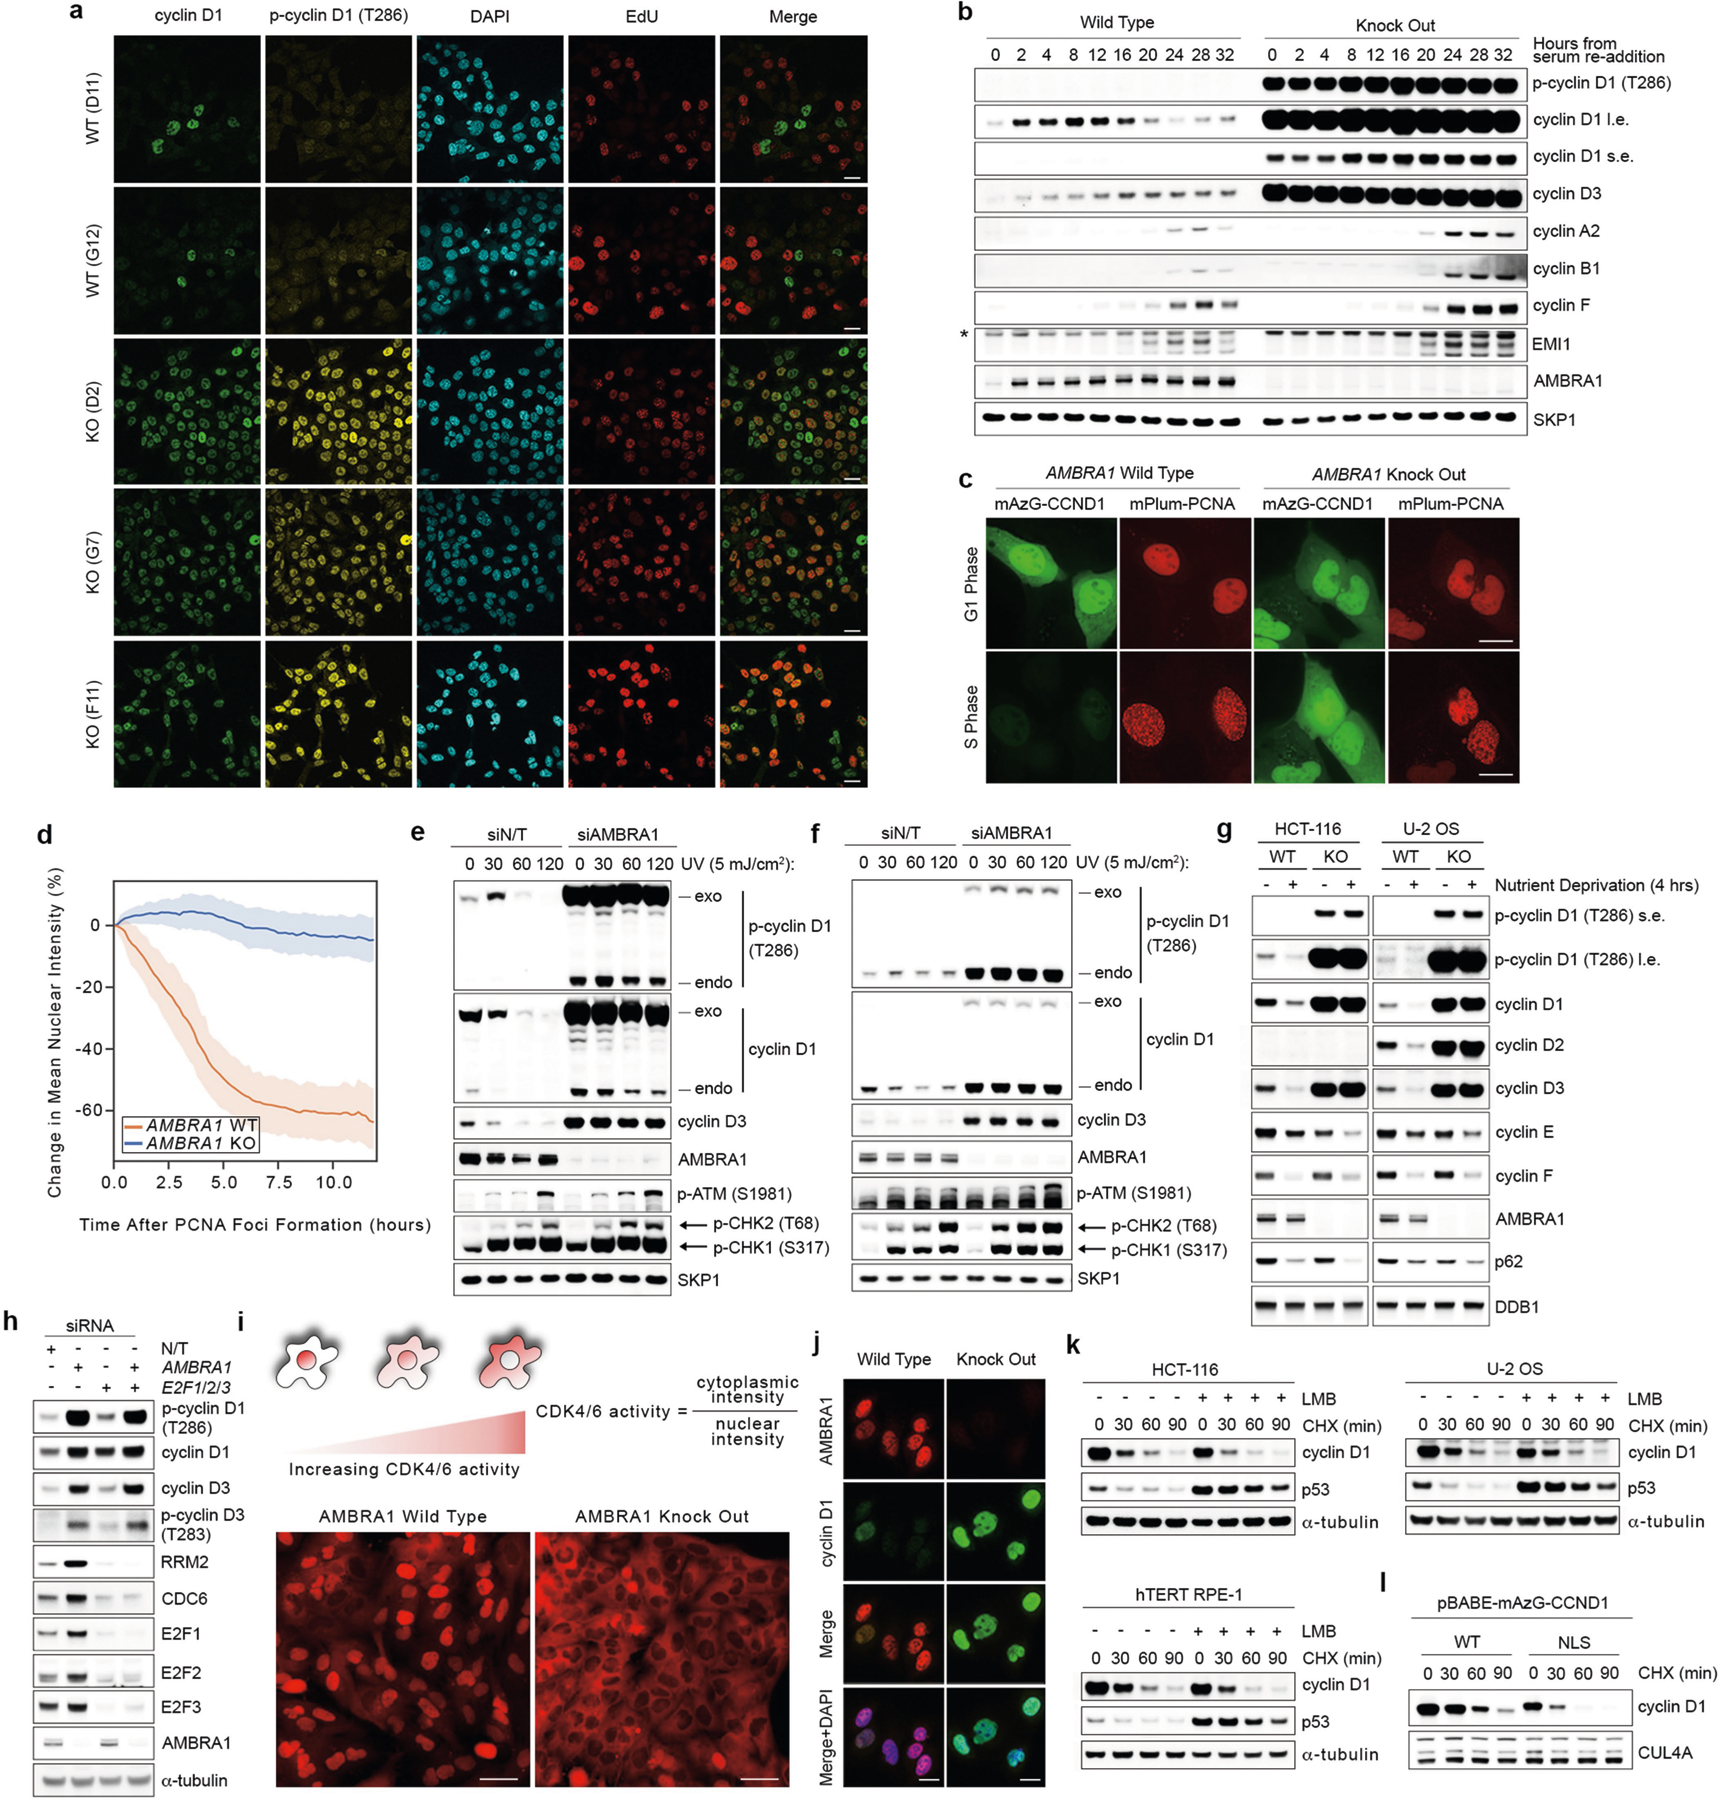
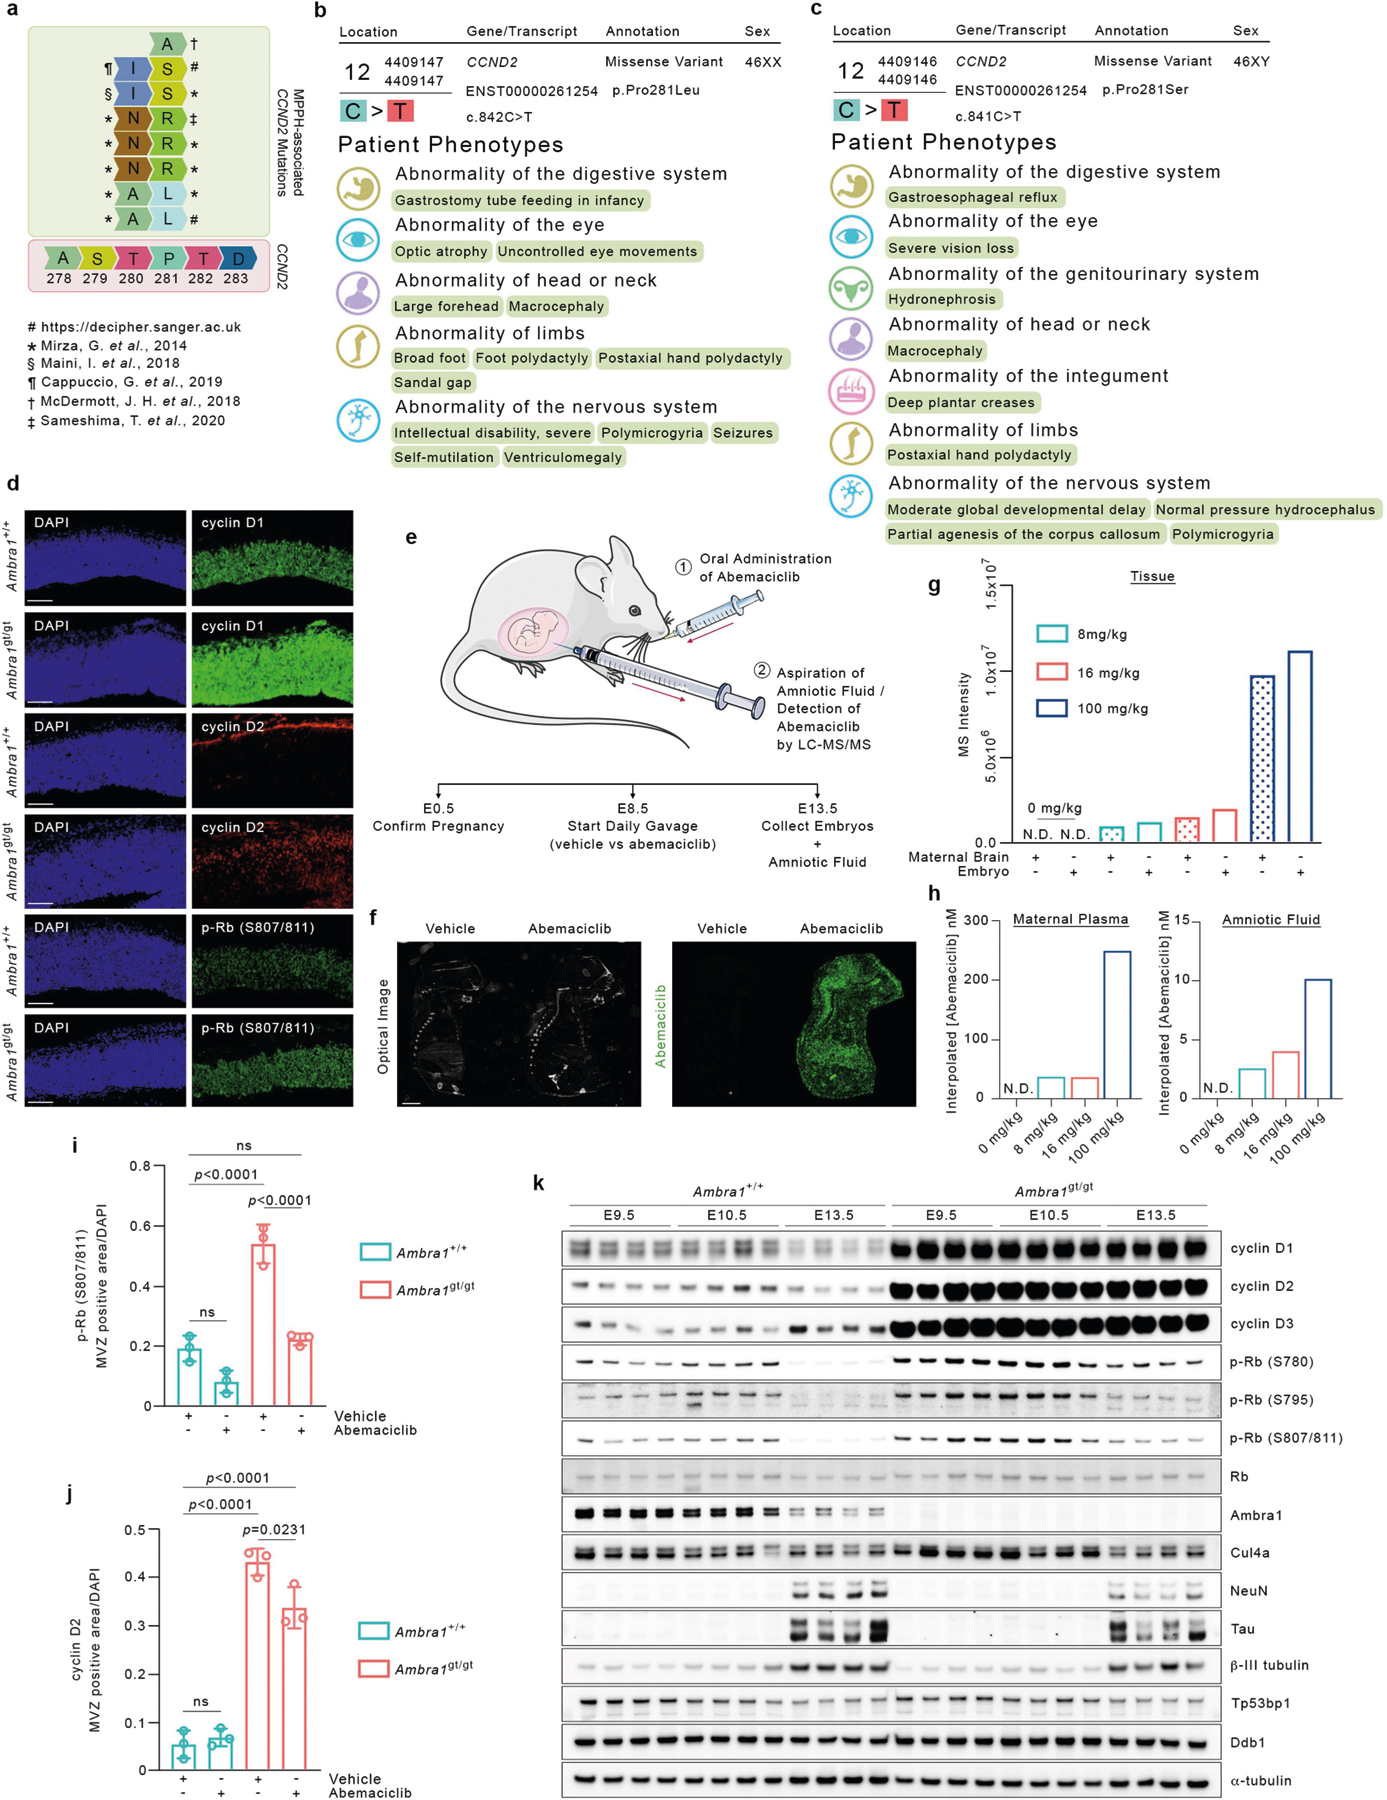
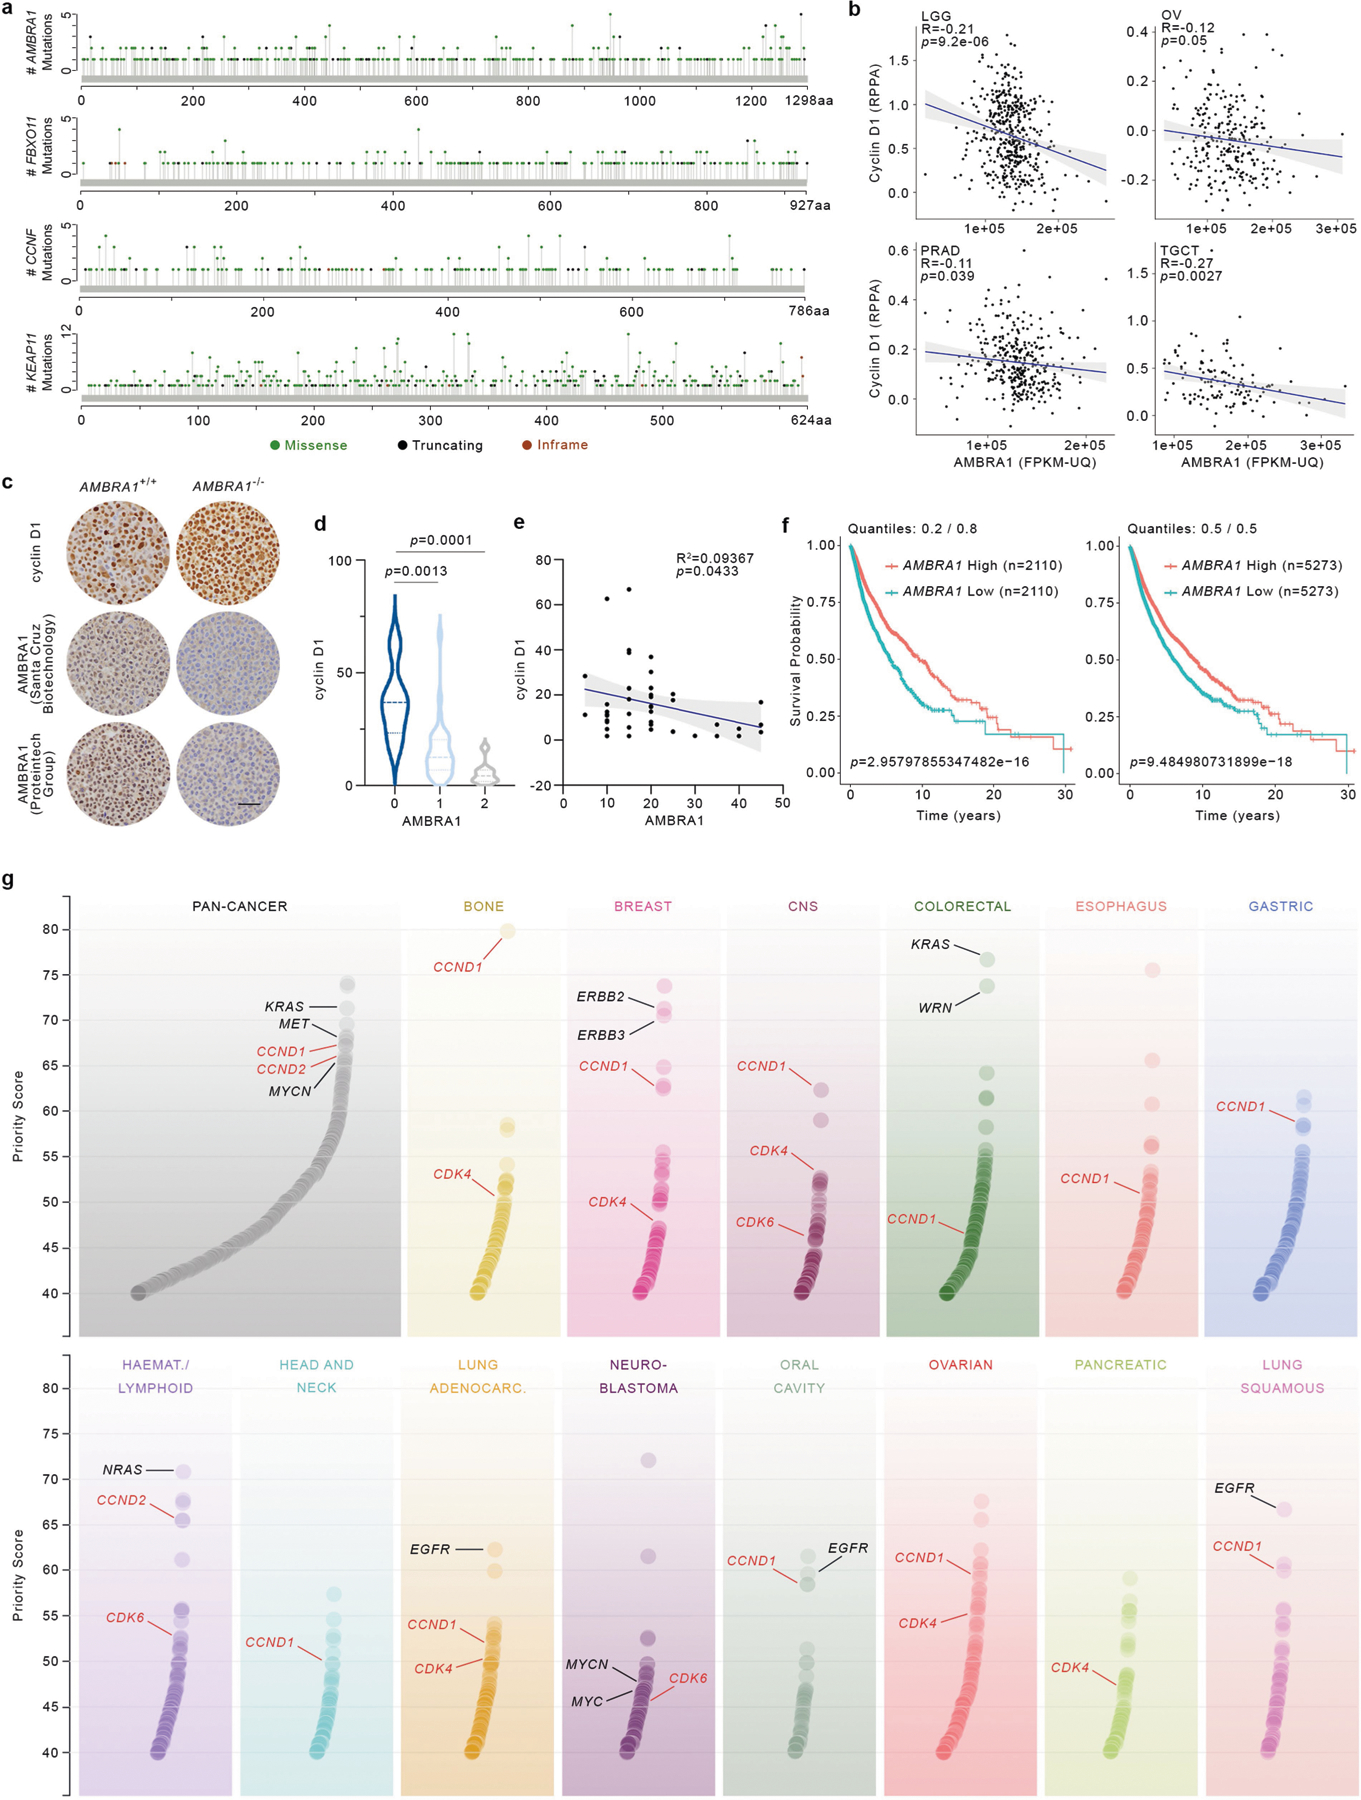
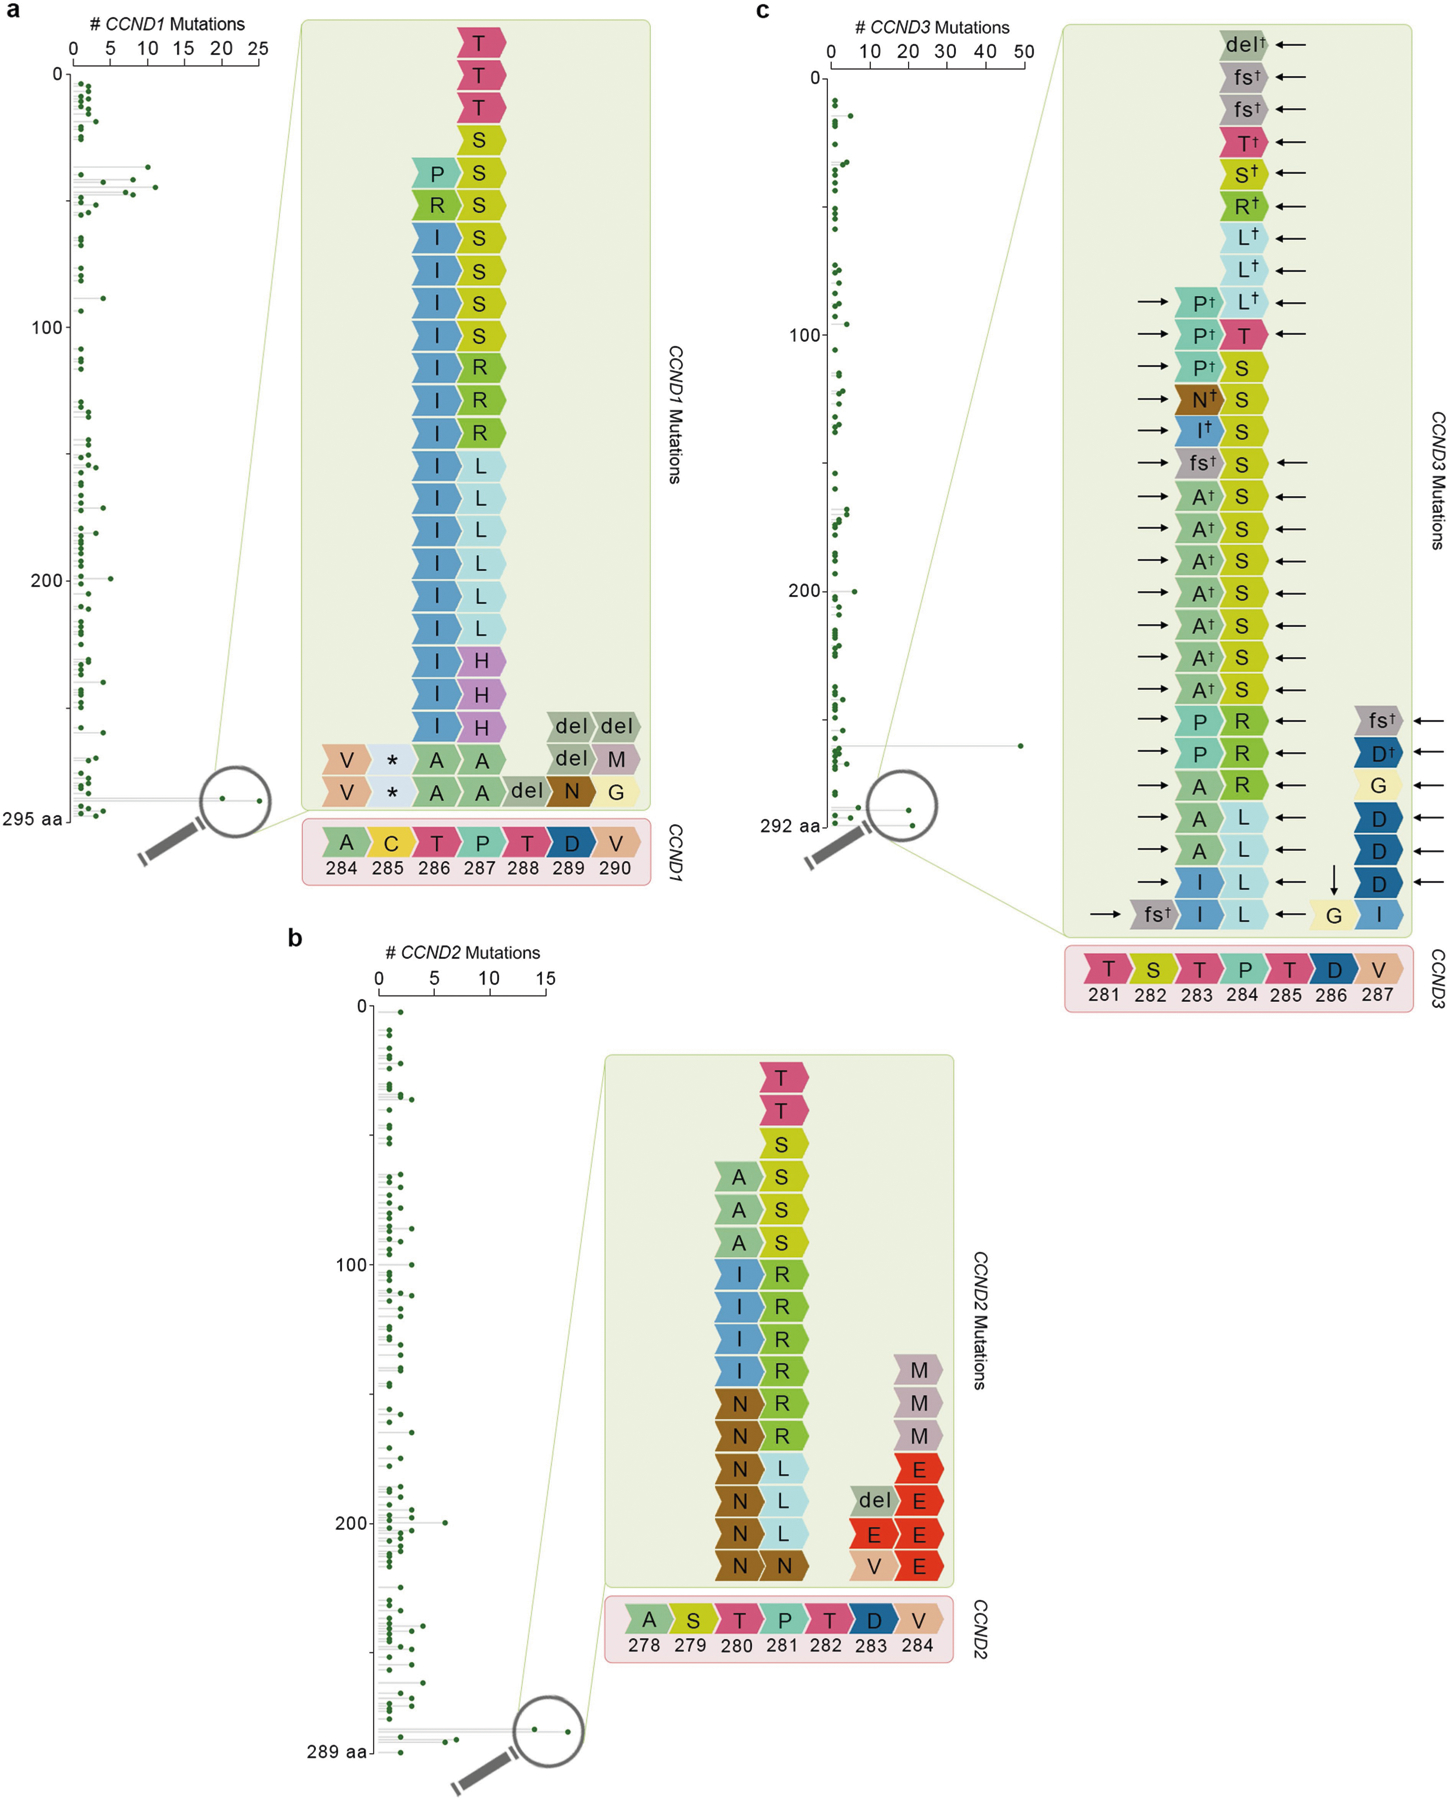
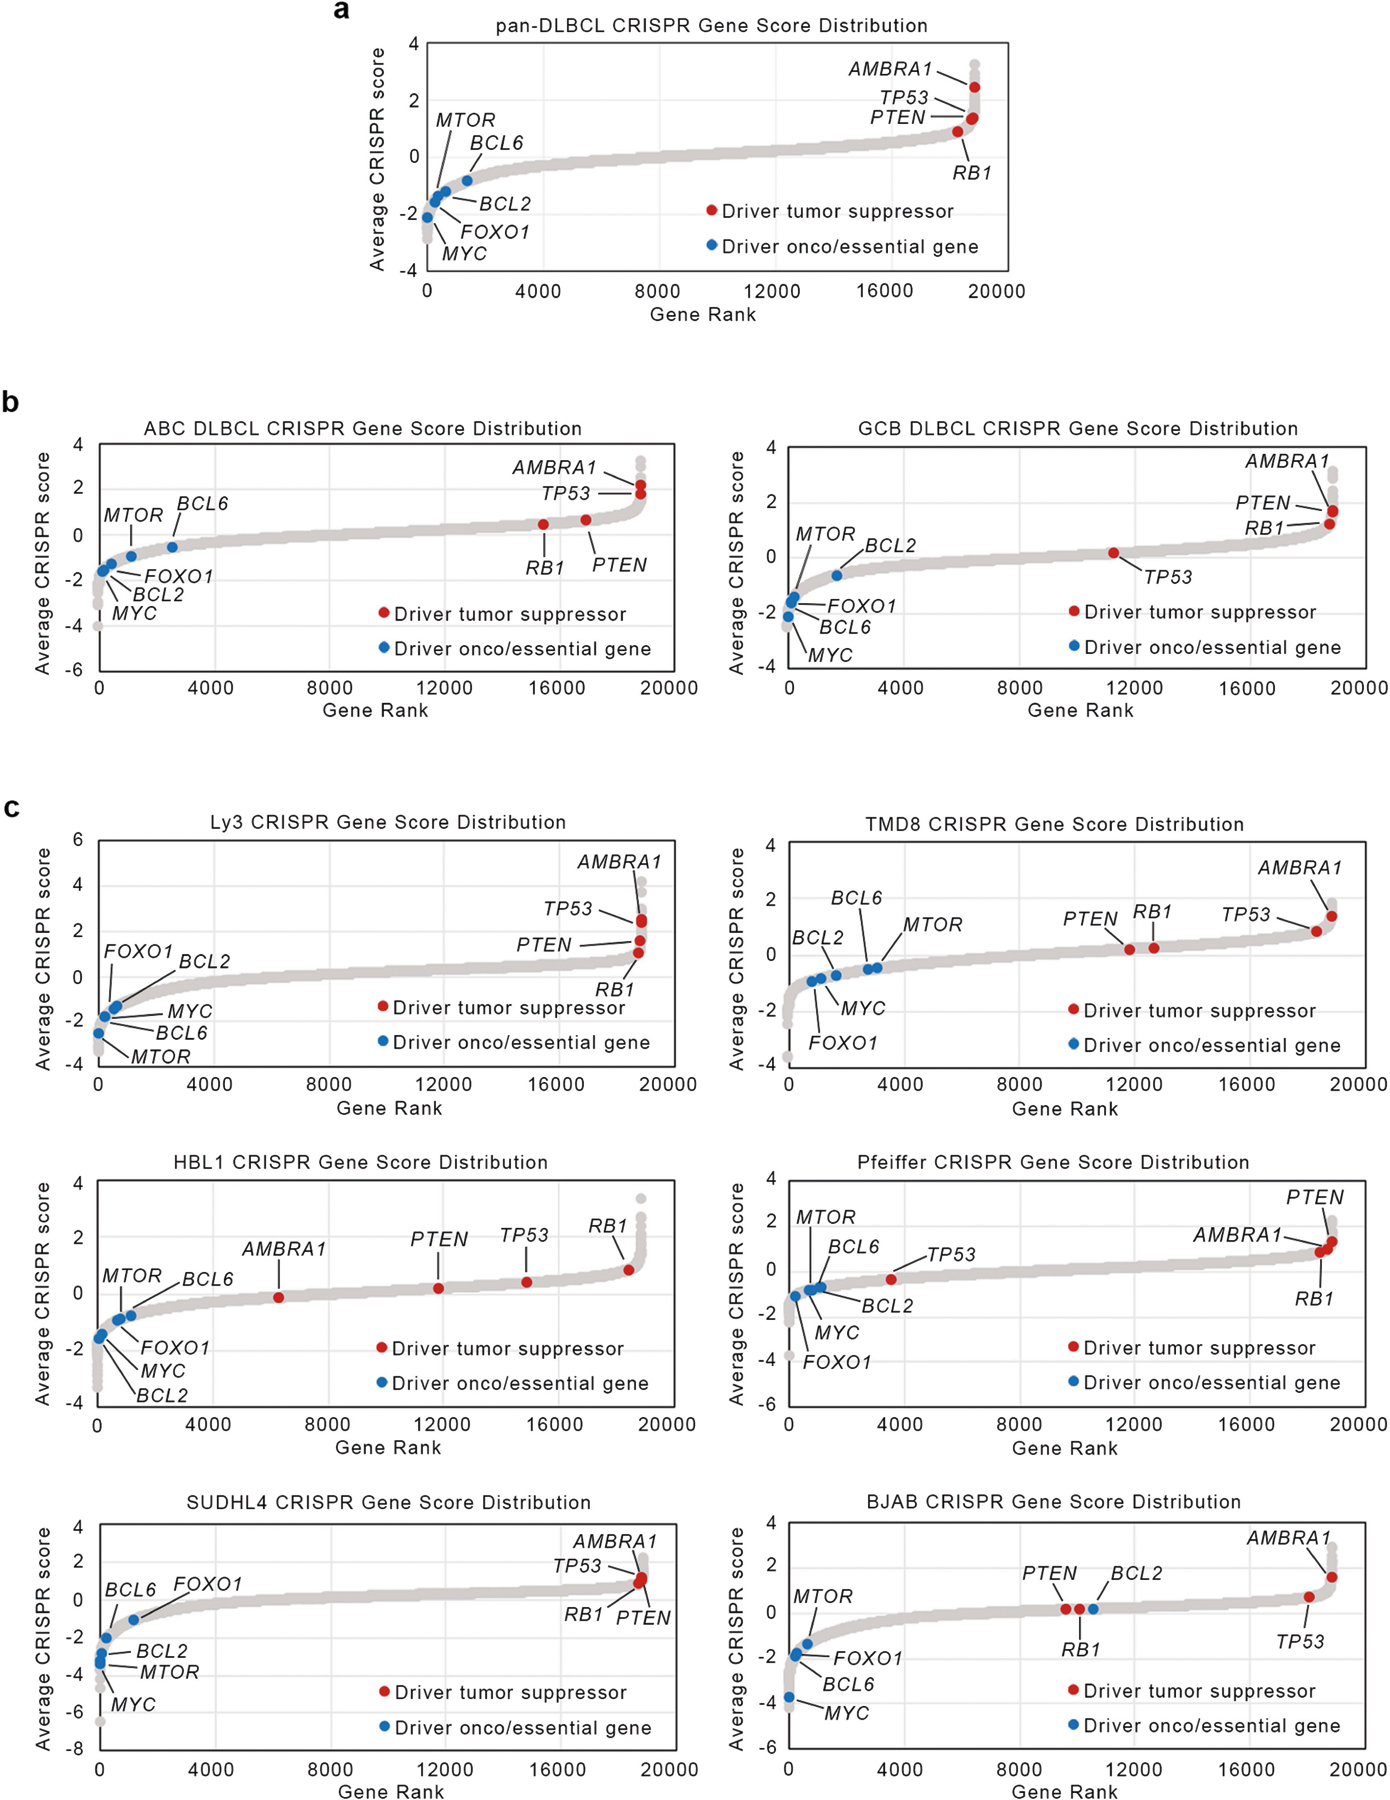
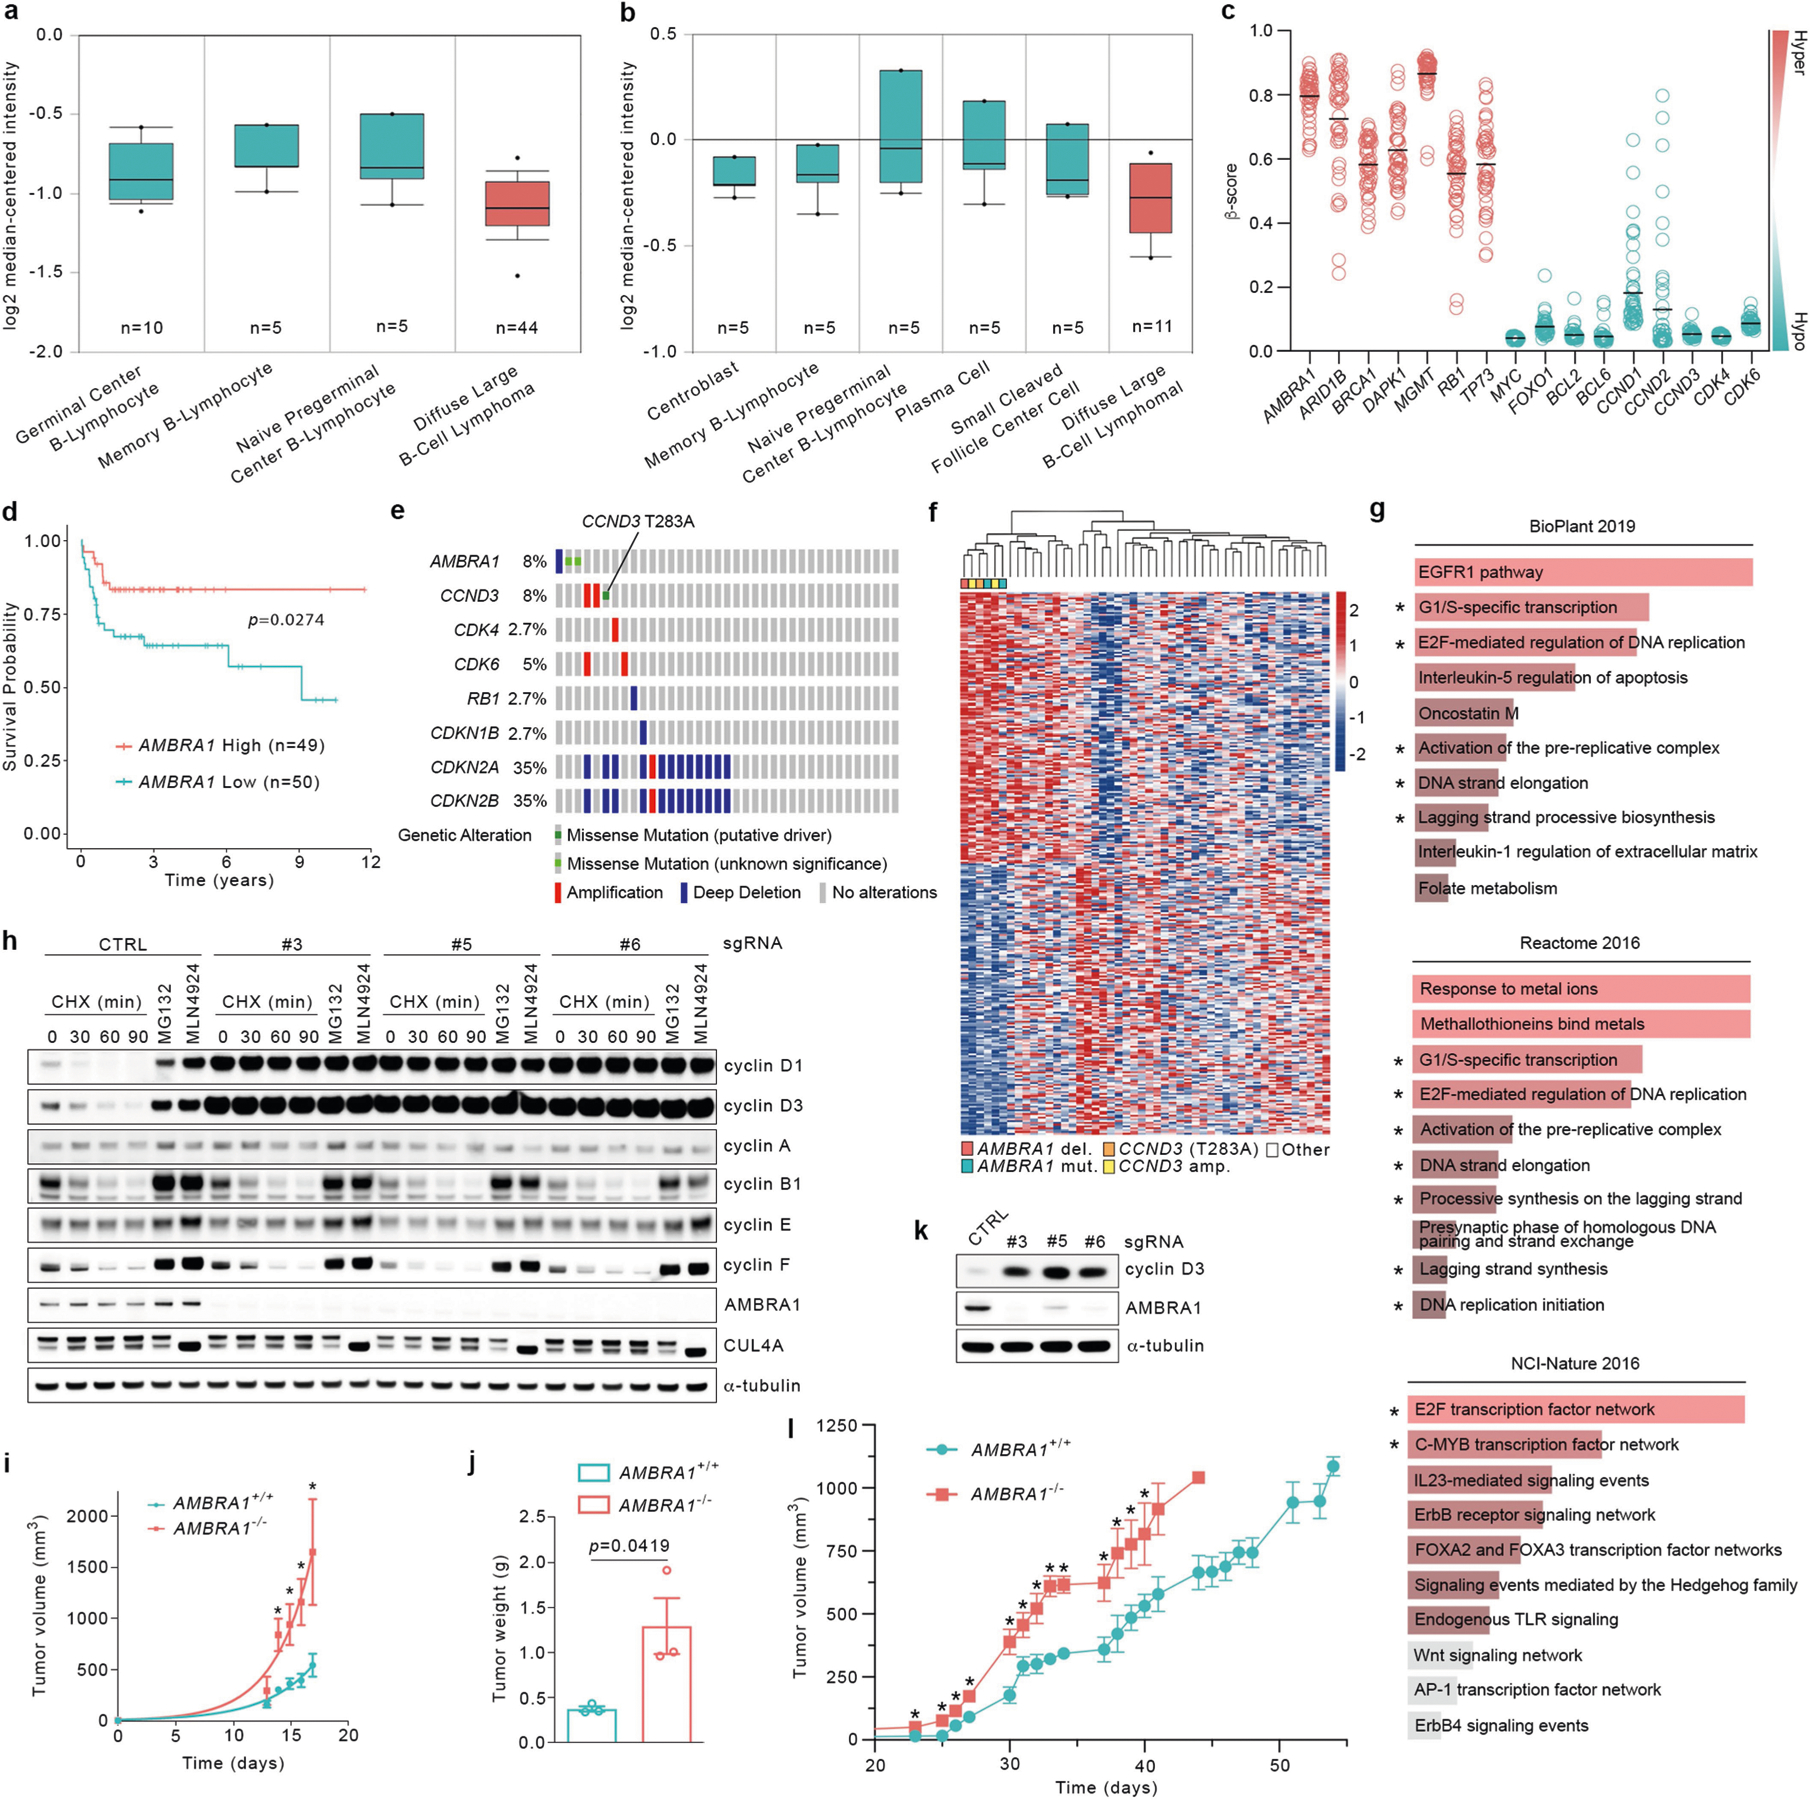
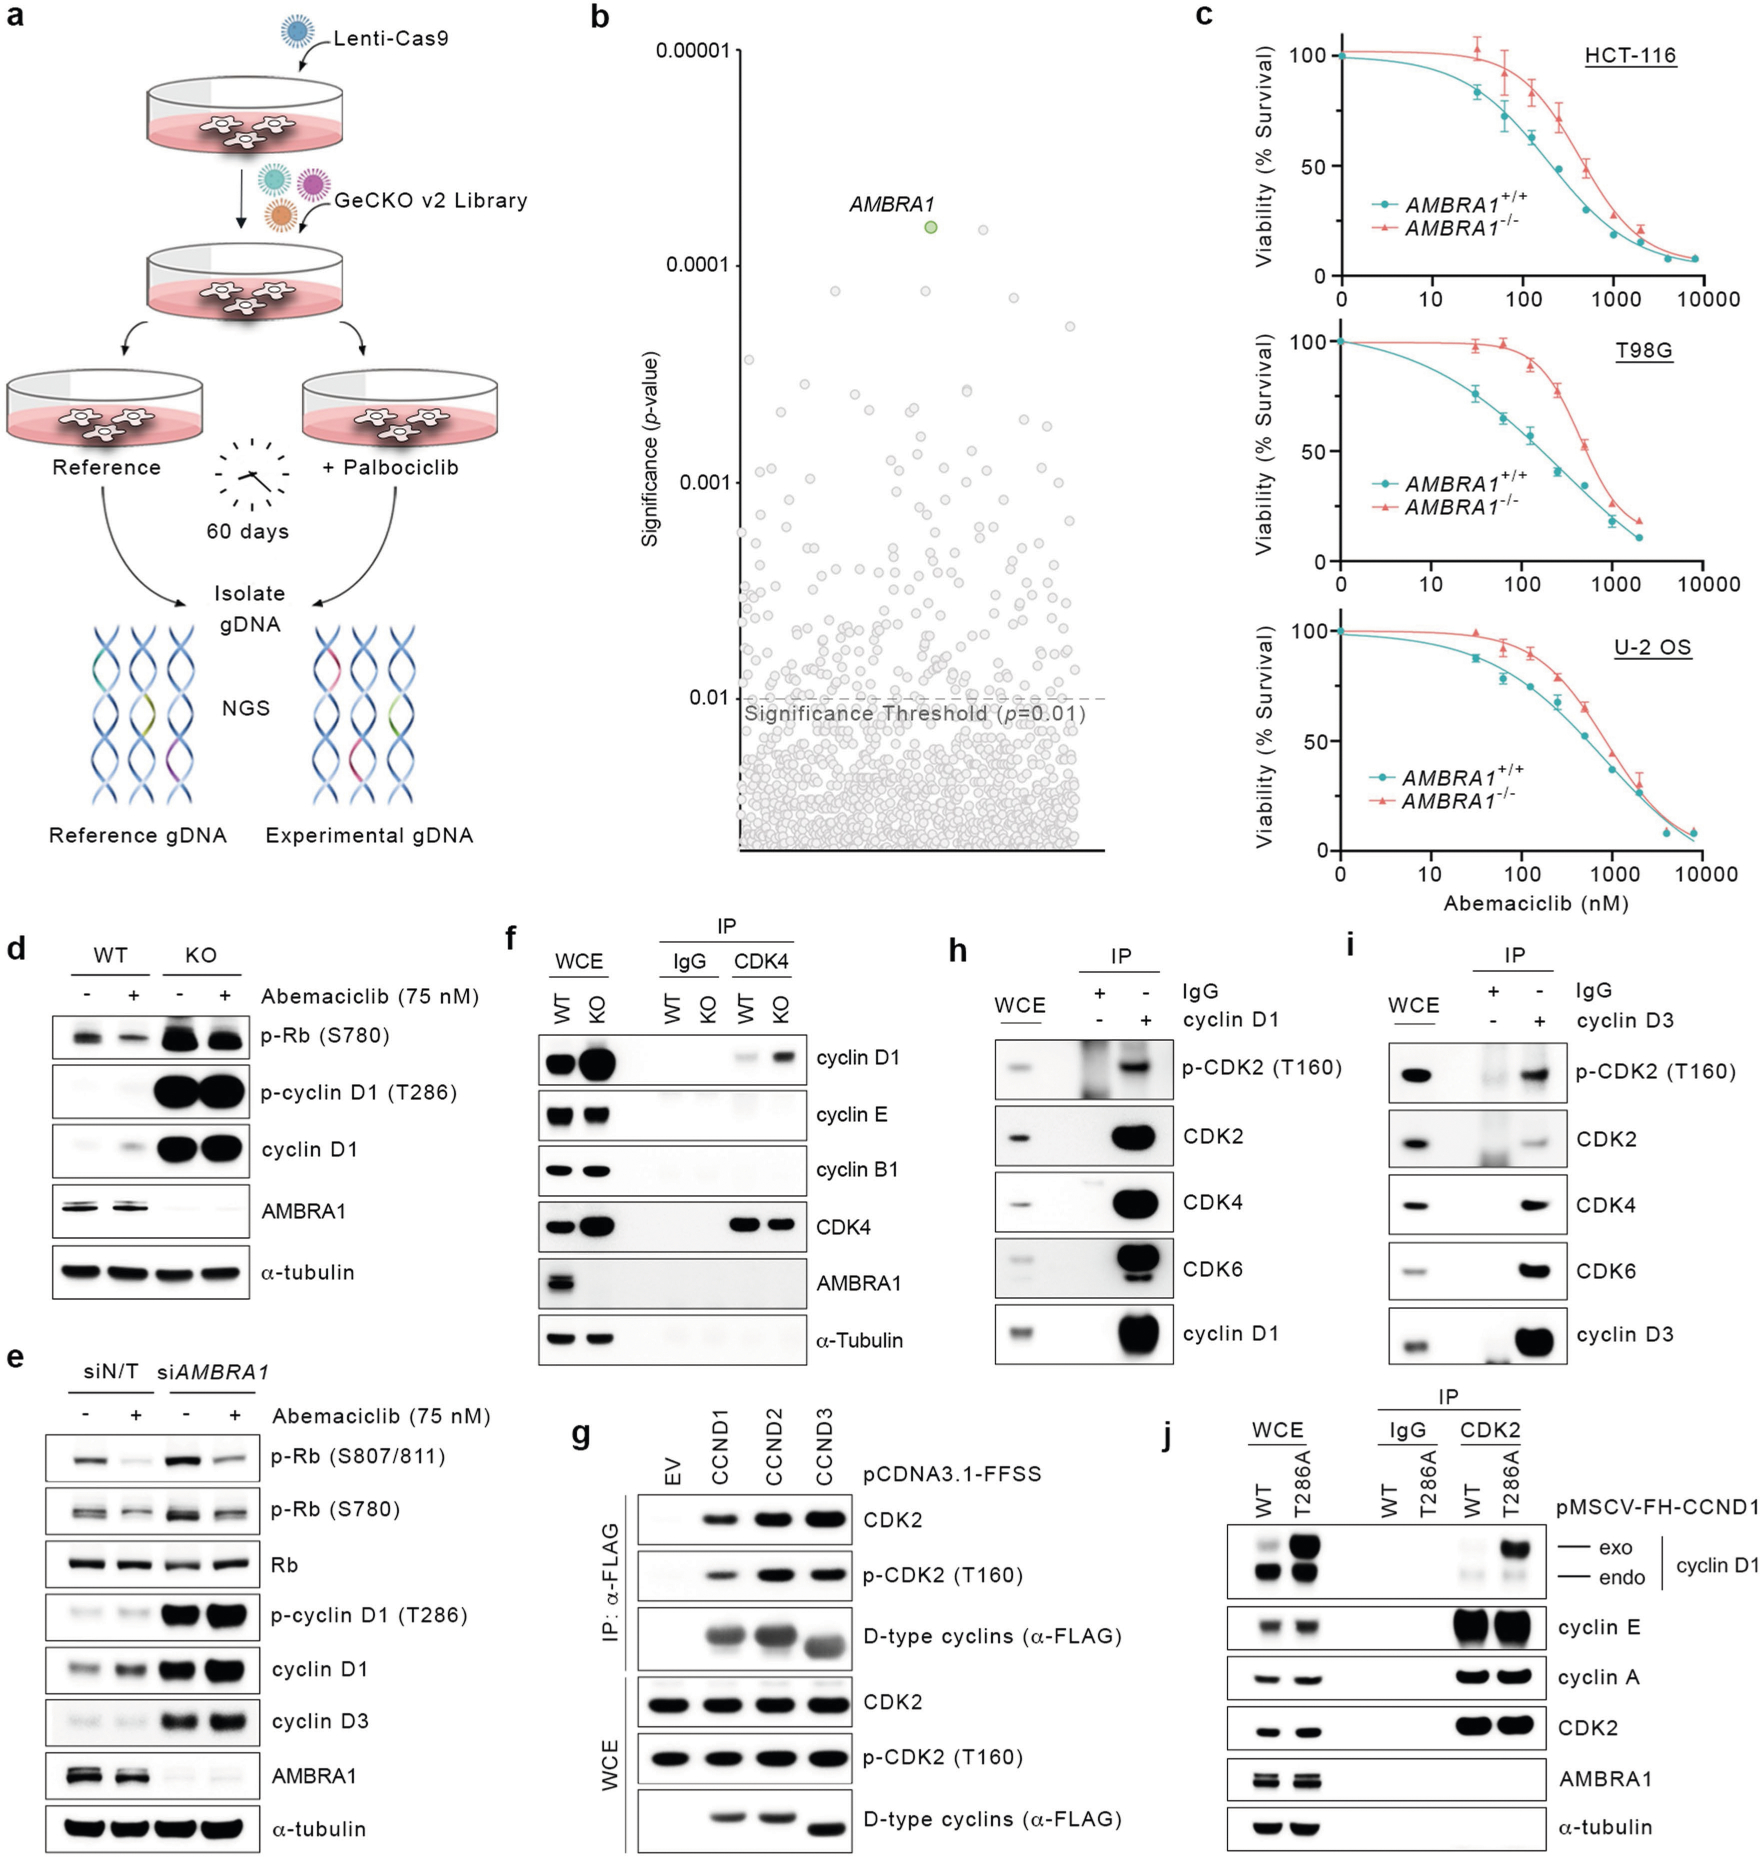
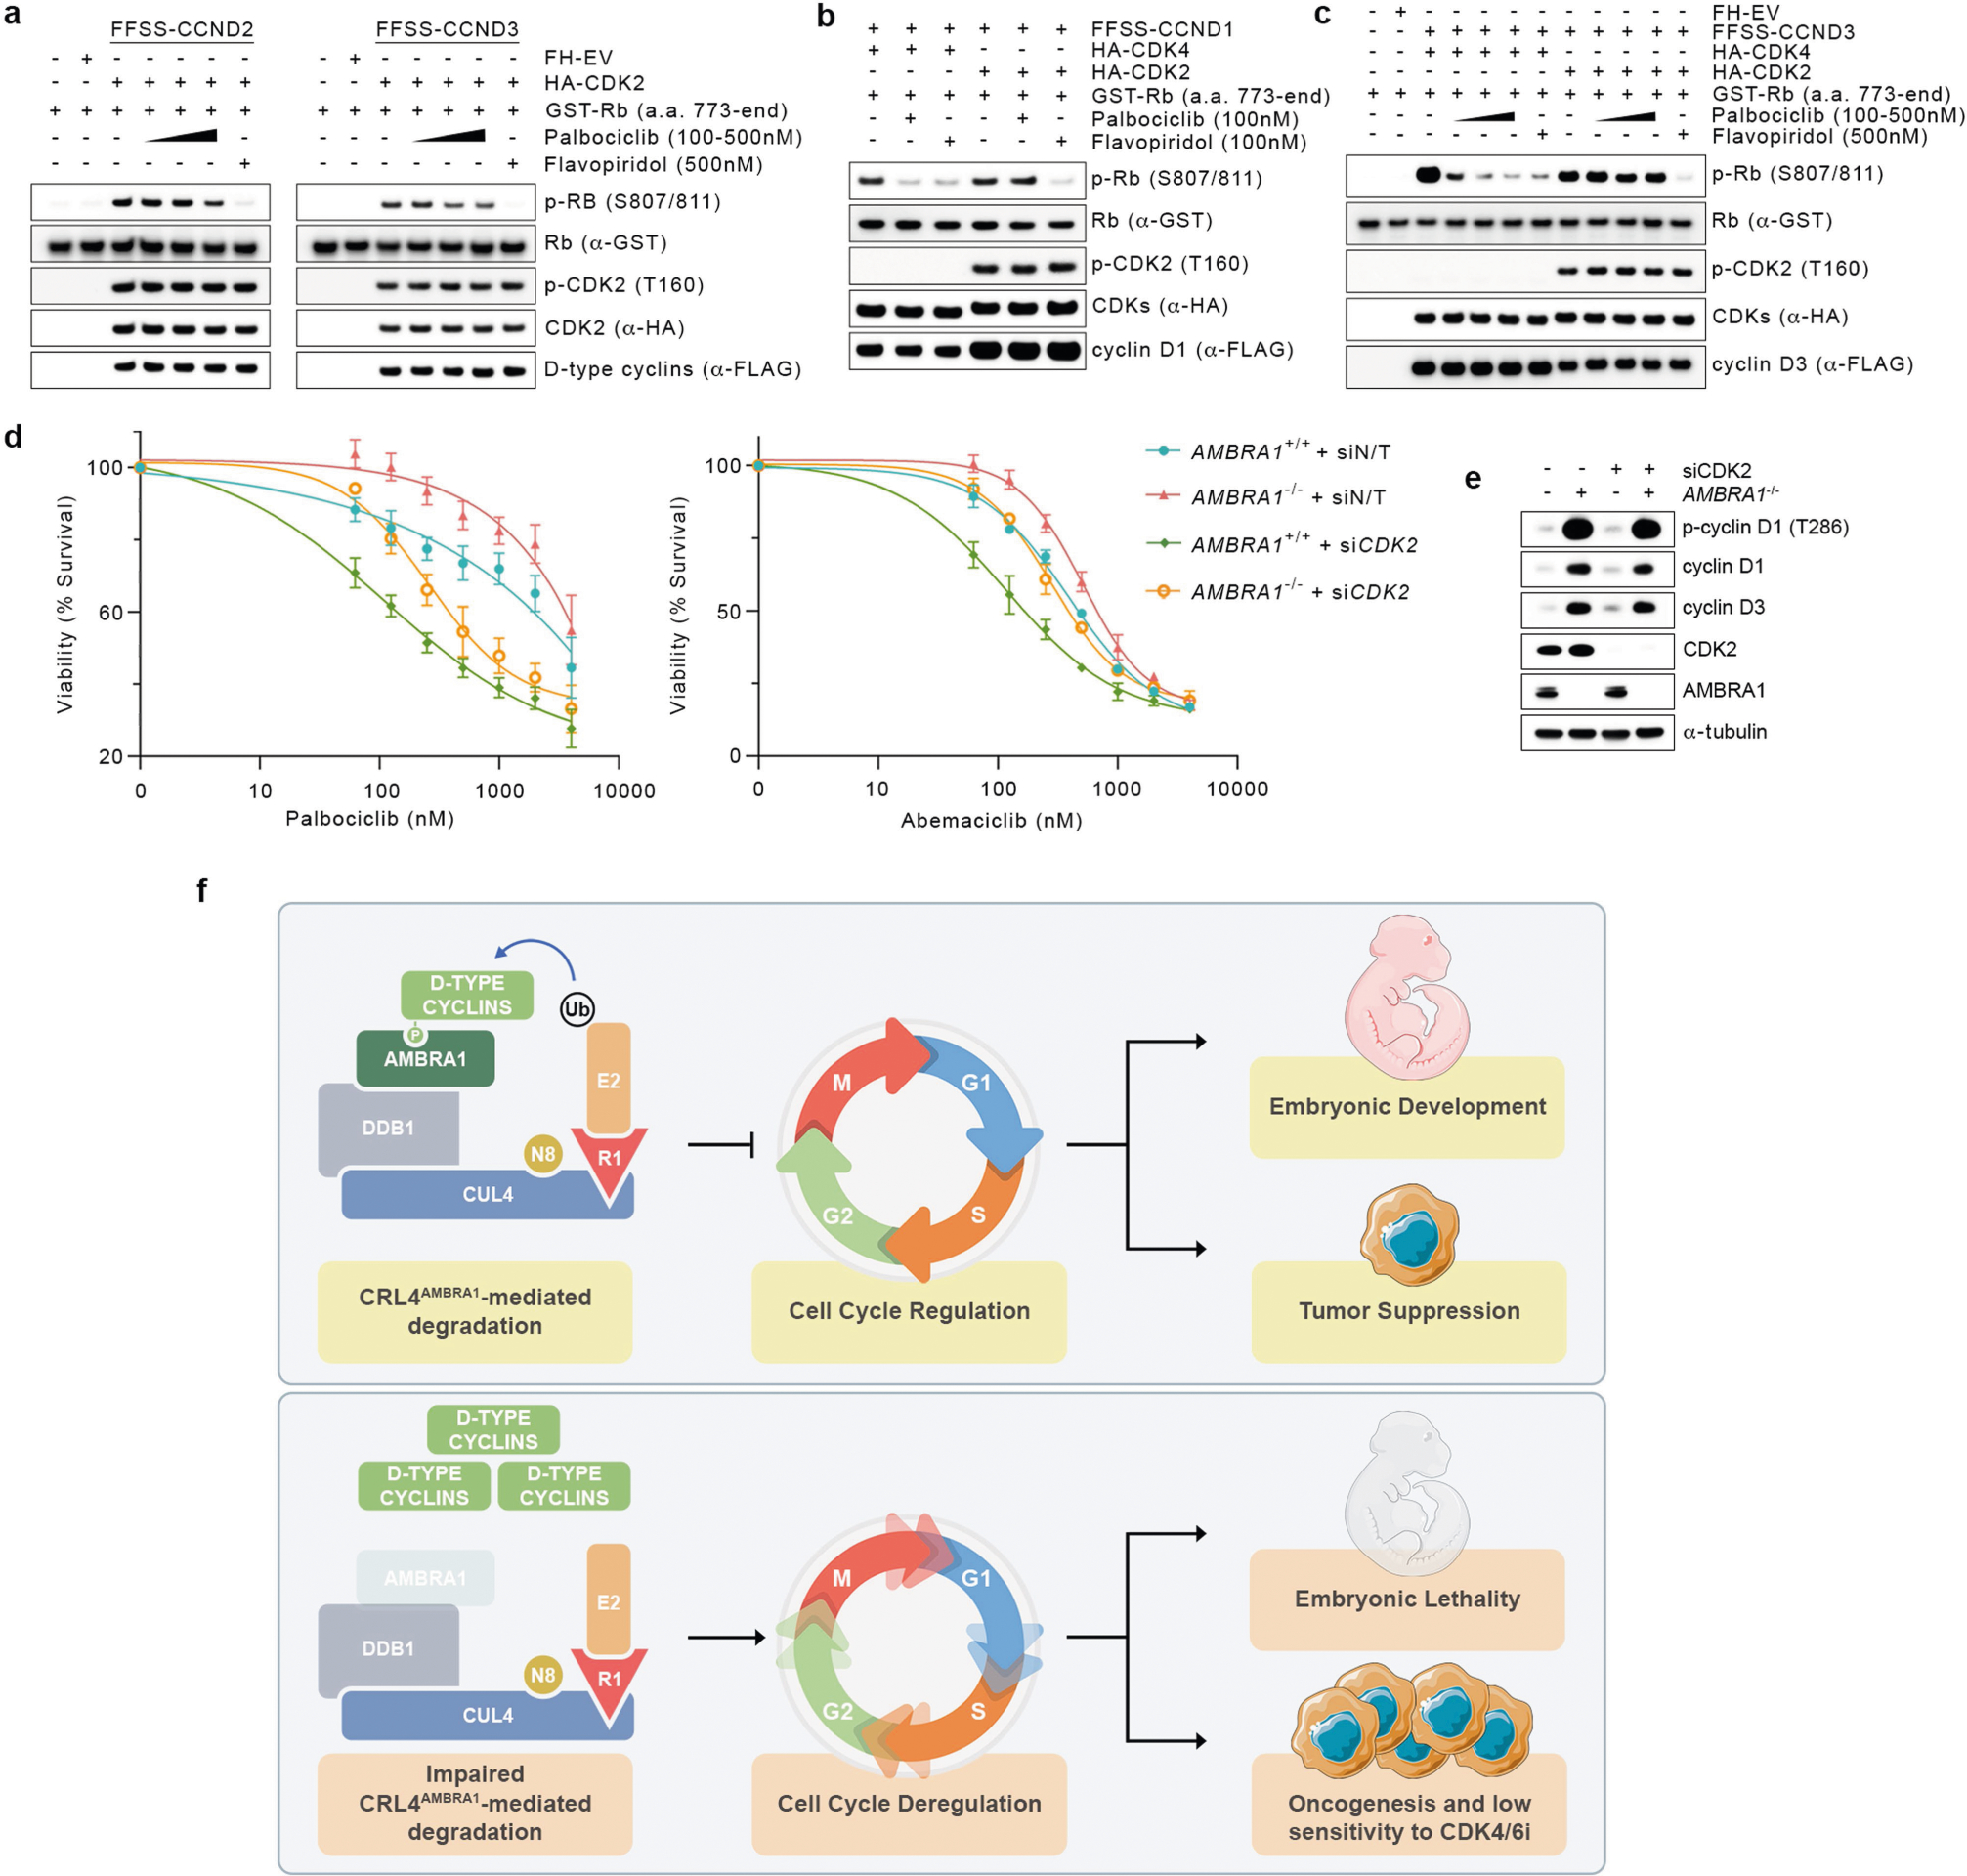
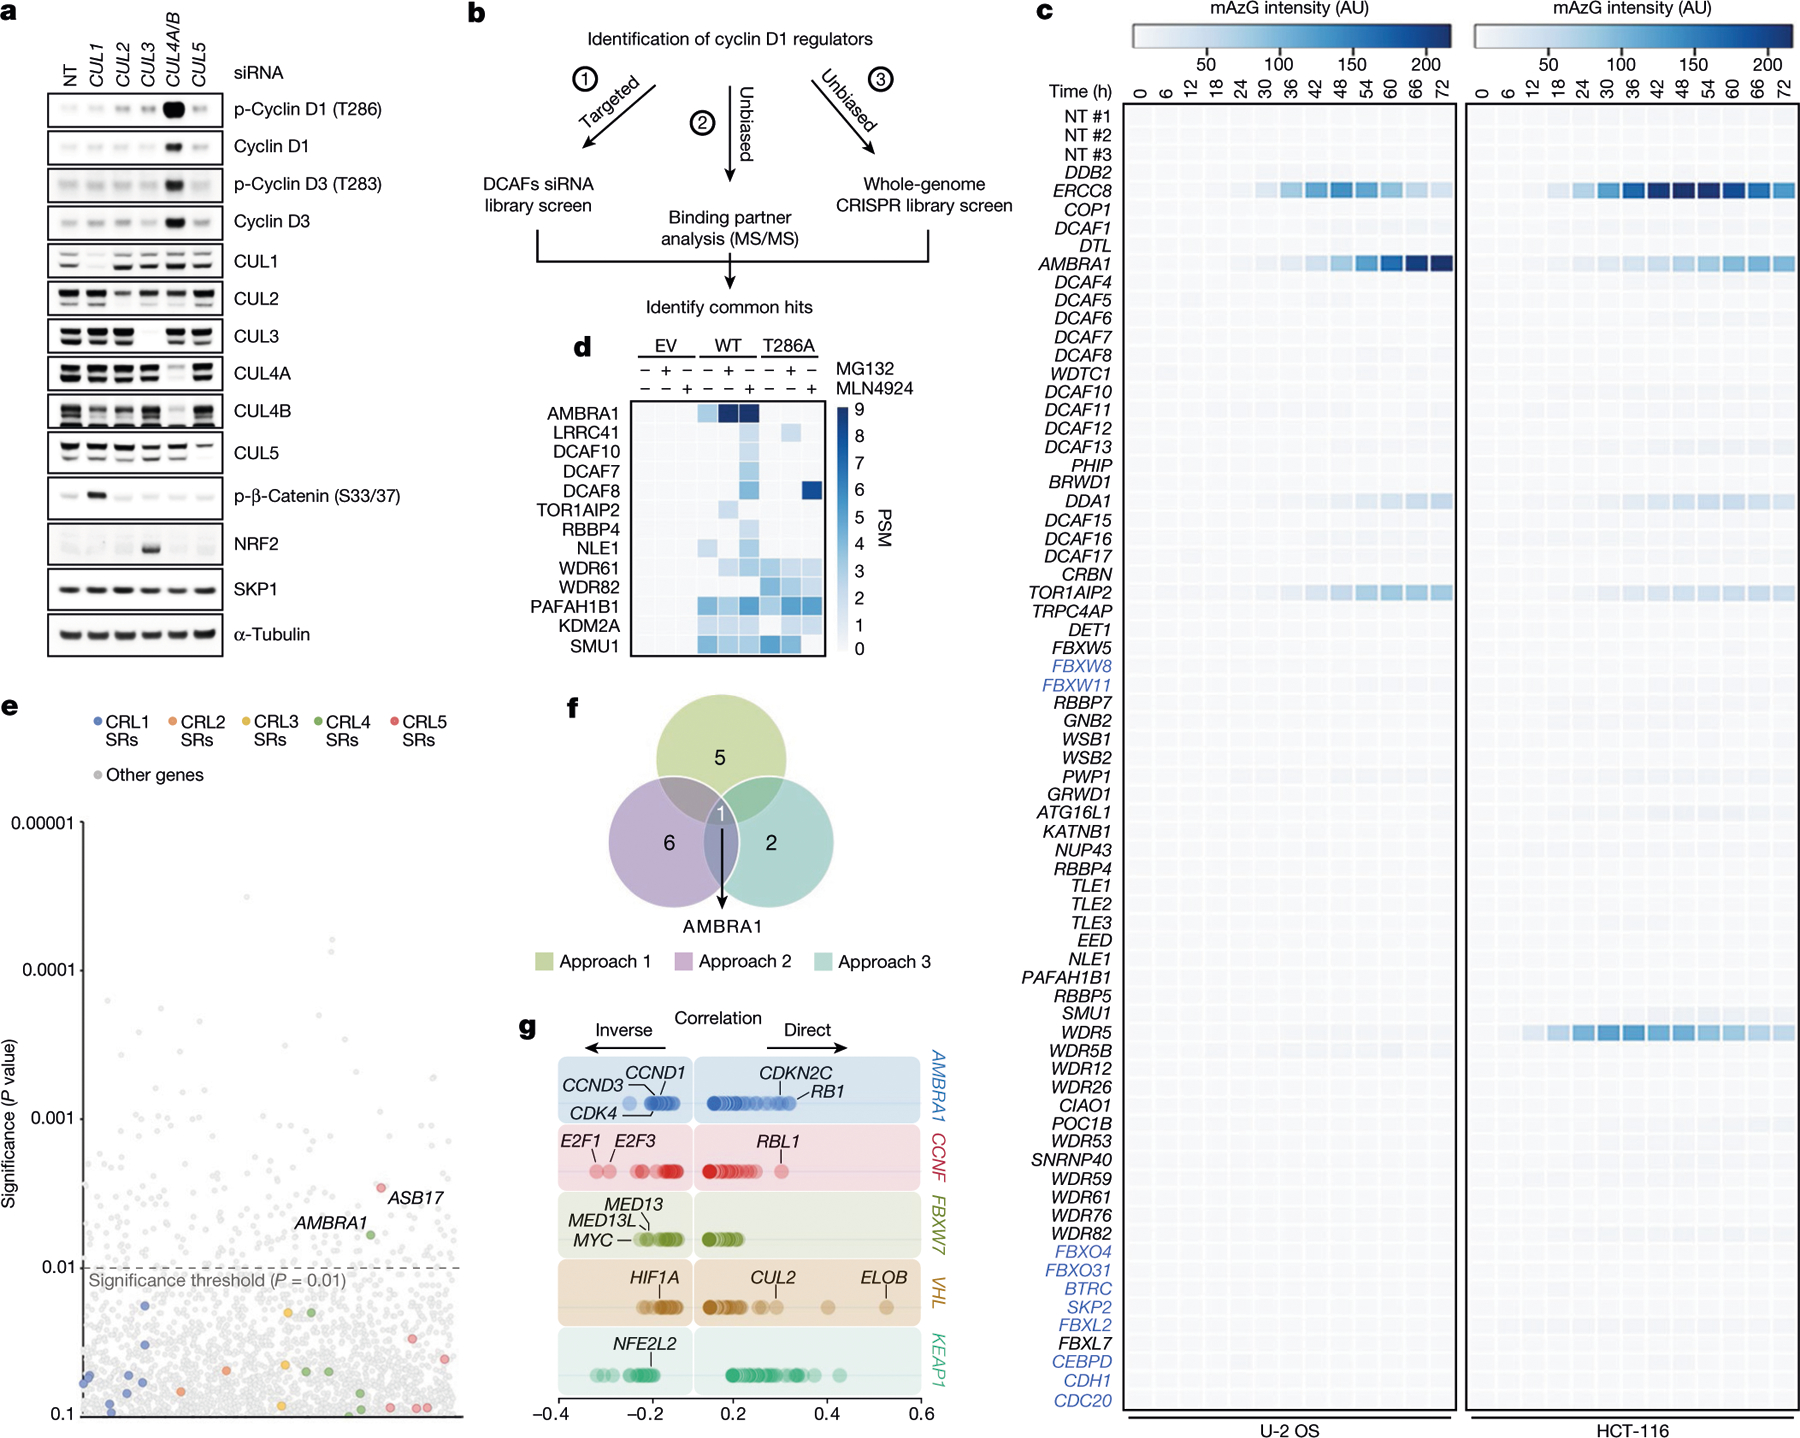
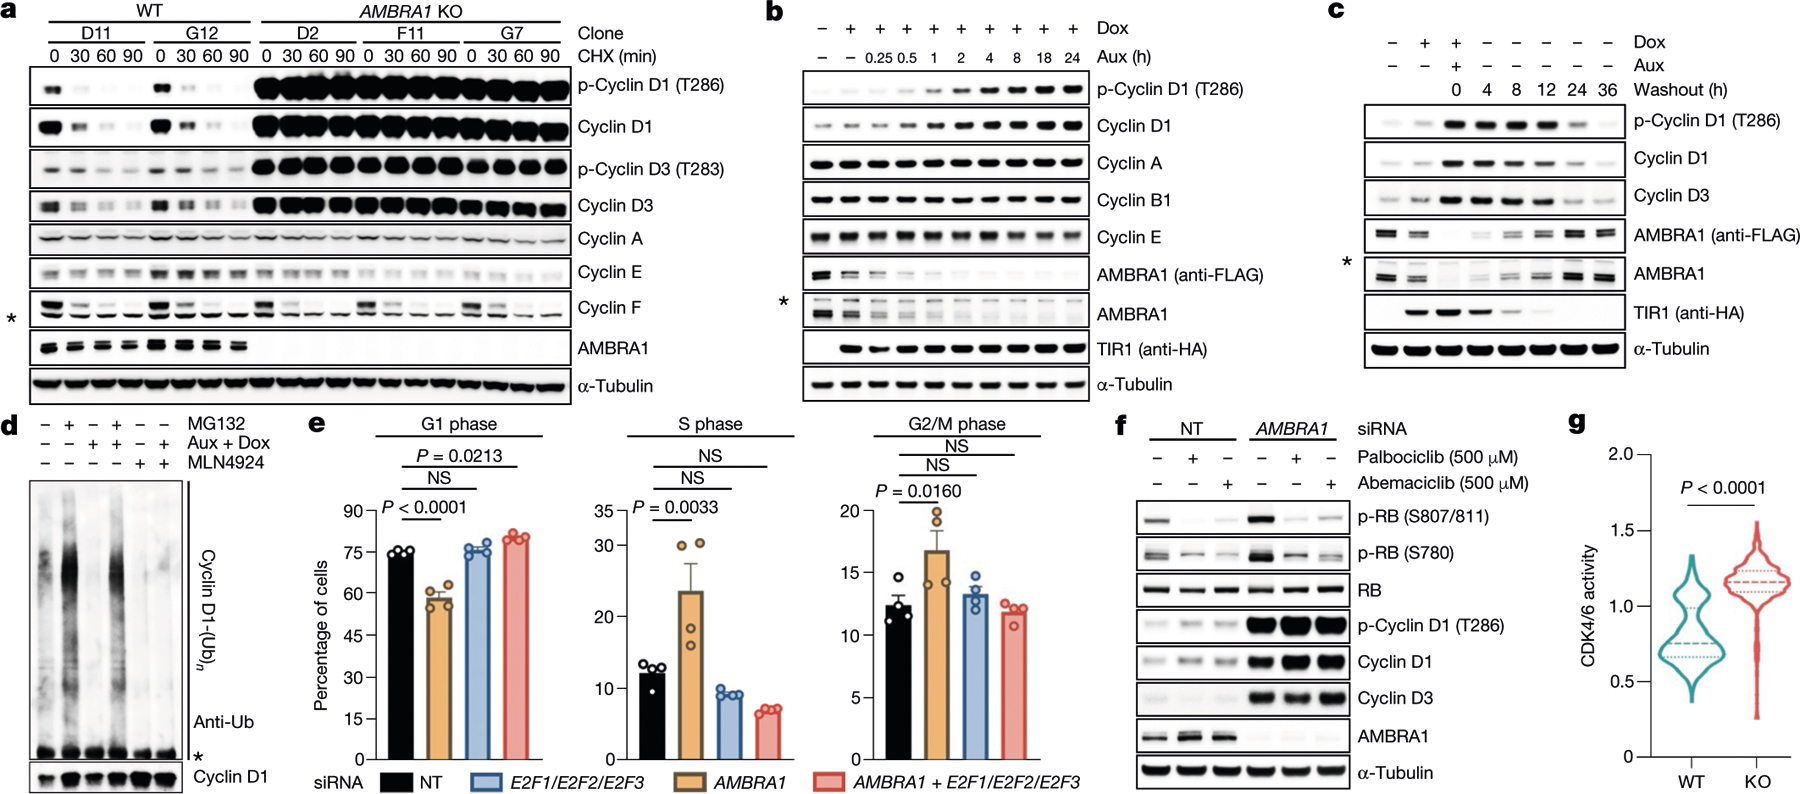
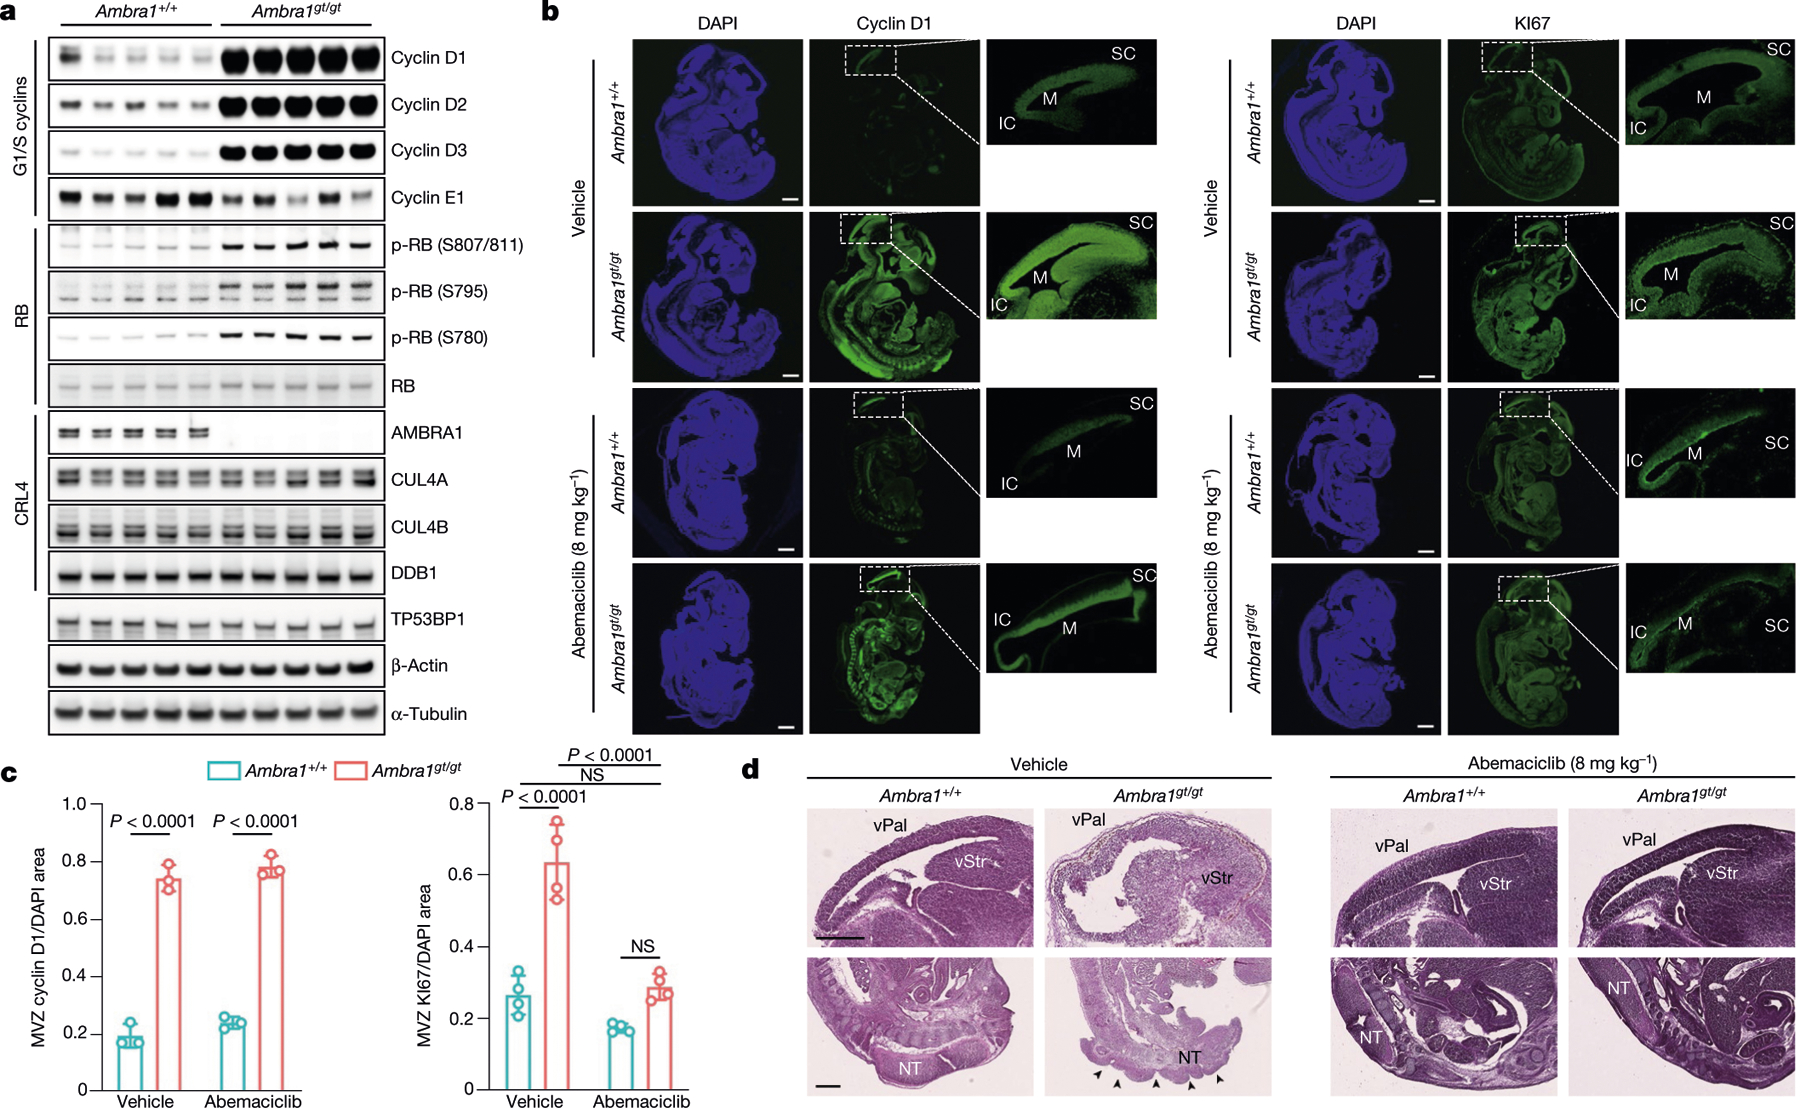
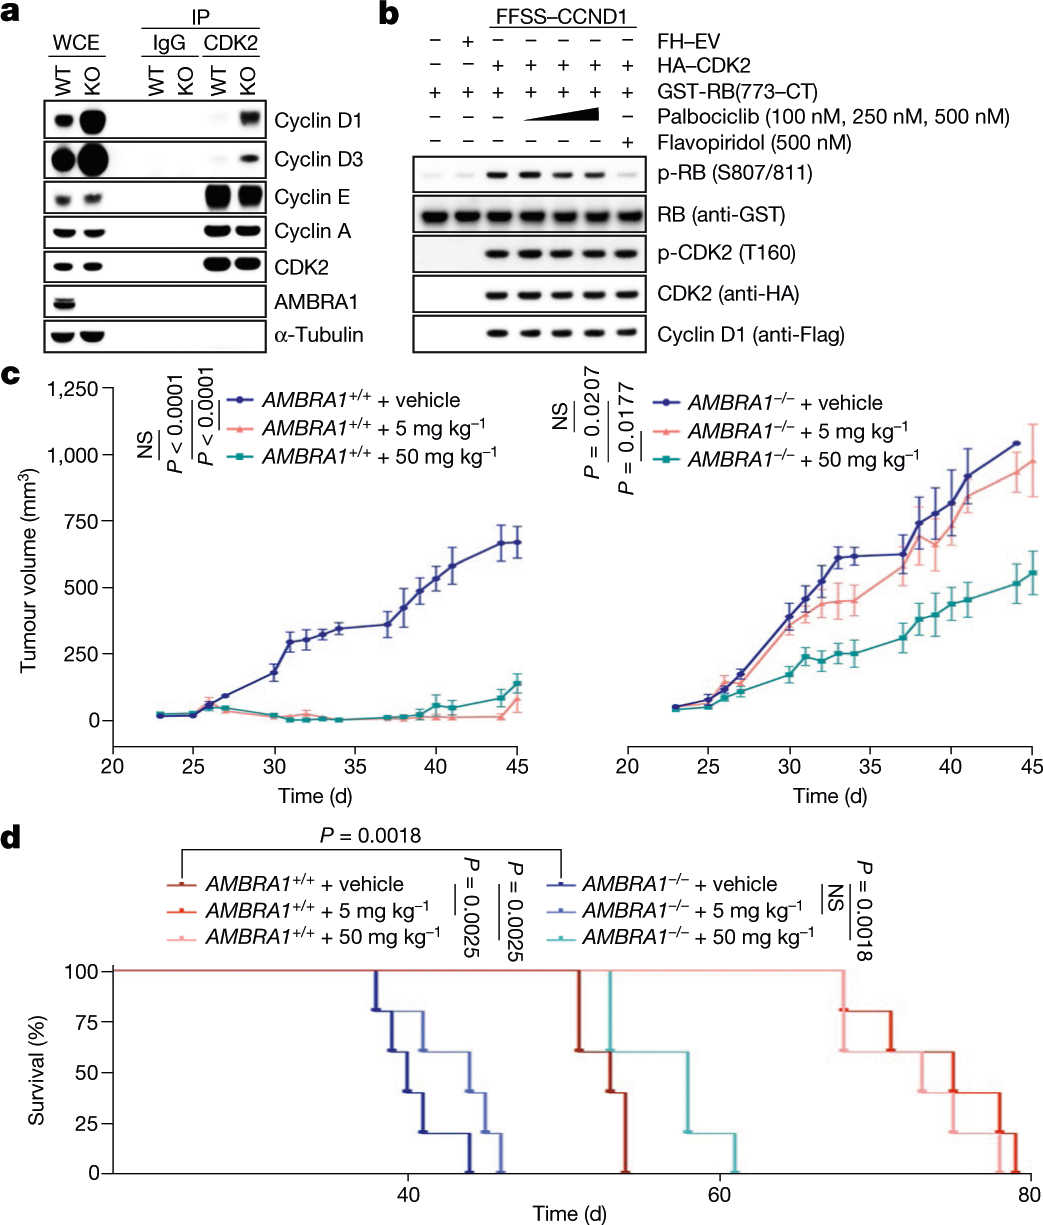
D-type cyclins are central regulators of the cell division cycle and are among the most frequently deregulated therapeutic targets in human cancer1, but the mechanisms that regulate their turnover are still being debated2,3. Here, by combining biochemical and genetics studies in somatic cells, we identify CRL4AMBRA1 (also known as CRL4DCAF3) as the ubiquitin ligase that targets all three D-type cyclins for degradation. During development, loss of Ambra1 induces the accumulation of D-type cyclins and retinoblastoma (RB) hyperphosphorylation and hyperproliferation, and results in defects of the nervous system that are reduced by treating pregnant mice with the FDA-approved CDK4 and CDK6 (CDK4/6) inhibitor abemaciclib. Moreover, AMBRA1 acts as a tumour suppressor in mouse models and low AMBRA1 mRNA levels are predictive of poor survival in cancer patients. Cancer hotspot mutations in D-type cyclins abrogate their binding to AMBRA1 and induce their stabilization. Finally, a whole-genome, CRISPR-Cas9 screen identified AMBRA1 as a regulator of the response to CDK4/6 inhibition. Loss of AMBRA1 reduces sensitivity to CDK4/6 inhibitors by promoting the formation of complexes of D-type cyclins with CDK2. Collectively, our results reveal the molecular mechanism that controls the stability of D-type cyclins during cell-cycle progression, in development and in human cancer, and implicate AMBRA1 as a critical regulator of the RB pathway.


Conflict of interest statement

Competing interests M.P. is a consultant for and has financial interests in Coho Therapeutics, CullGen, Kymera Therapeutics and SEED Therapeutics. M.P. is a cofounder of Coho Therapeutics, and is a member of the scientific advisory board of CullGen, Kymera Therapeutics and SEED Therapeutics, and is a consultant for Santi Therapeutics. The other authors declare no competing interests.

Figures

Extended Data Fig. 1 |
Extended Data Fig. 1 |. CRL1 does not contribute to the degradation of D-type cyclins.
a, hTERT RPE-1, U-2 OS and HCT-116 cells were treated with MG132 or MLN4924 for 4 h before collection. Cell extracts were immunoblotted for the indicated proteins. b, HCT-116 cells were treated for 3 h with vehicle (DMSO) or MLN4924 followed by cycloheximide for the indicated times before collection. Cell extracts were immunoblotted for the indicated proteins. c, HCT-116 cells were transfected with a non-targeting (N/T) siRNA or an siRNA against DDB1 for three rounds before lysis and immunoblotting for the indicated proteins. d, HCT-116 cells were transfected with a non-targeting siRNA or an siRNA against CUL1 for three rounds followed by treatment with cycloheximide for the indicated times before collection. Cell extracts were immunoblotted as indicated. e, U-2 OS cells were transfected with a non-targeting siRNA or an siRNA against CUL1 for three rounds followed by treatment with cycloheximide for the indicated times before collection. Cell extracts were immunoblotted as indicated. f, PC-3 cells were transfected with a non-targeting (N/T) siRNA or an siRNA against CUL1 for three rounds followed by treatment with cycloheximide for the indicated times before collection. Cell extracts were immunoblotted as indicated. g, hTERT RPE-1 cells were transfected with a non-targeting siRNA or an siRNA against CUL1 for three rounds followed by treatment with cycloheximide for the indicated times before collection. Cell extracts were immunoblotted as indicated. h, U-2 OS cells were infected with a doxycycline-inducible lentivirus expressing a dominant-negative mutant of CUL1 (DN-CUL1). Cells were treated with doxycycline for the indicated times. Where indicated, cells were exposed to UV (5 mJ cm−2) irradiation for 2 h before collection. Cell extracts were immunoblotted as indicated. i, Representatives images of U-2 OS cells infected with a retrovirus expressing mAzG-CCND1 and treated with MLN4924 for the indicated times. Cells were monitored via live-cell imaging. Scale bar, 20 μm. j, Quantification of relative mAzG-CCND1 nuclear intensity fold change in arbitrary units (A.U.) from single cells tracked over time as in i. Data are mean ± s.d., n = 34 cells. k, Schematic representation of approach 1, aimed at measuring the accumulation of cyclin D1 upon silencing of all human DCAFs and the previously-reported regulators of D-type cyclins in HCT-116 and U-2 OS cells. l, Schematic representation of approach 2, aimed at identifying the binding partners of FFSS-tagged wild-type cyclin D1 and FFSS-tagged cyclin D1(T286A) compared with empty vector. HCT-116 cells were treated with DMSO, MG132 or MLN4924 for 4 h before lysis and immunoprecipitation with an anti-Flag resin, followed by elution with a 3×Flag peptide. Eluted samples were then analysed by LC-MS/MS for the identification of binding partners. m, Schematic representation of approach 3, aimed at identifying global regulators of cyclin D1 in HCT-116 cells using the whole-genome, CRISPR–Cas9 human GECKOv2 pooled library. Unless otherwise noted, experiments were performed at least three independent times.
Extended Data Fig. 2 |
Extended Data Fig. 2 |. Validation of candidate regulators of D-type cyclins.
a, HCT-116 cells were transfected with a non-targeting siRNA or siRNAs against the indicated targets for two rounds before collection. Cell extracts were immunoblotted as indicated (upper panel). RNA extracts were also collected to measure the relative mRNA levels for each indicated target by quantitative PCR with reverse transcription (RT–qPCR). Each blue column represents the mRNA levels of the target indicated by the respective siRNA and normalized to its corresponding mRNA levels in cells transfected with a non-targeting siRNA (bottom). Data are mean mRNA levels ± s.d., n = 3 independent experiments. b, HCT-116 cells were transfected with a non-targeting siRNA or siRNAs against the indicated targets for two rounds followed by treatment with cycloheximide for the indicated times before collection. Cell extracts were immunoblotted as indicated. c, HCT-116 cells were transfected with a non-targeting siRNA or an siRNA against DCAF7 followed by treatment with cycloheximide for the indicated times before collection. Cell extracts were immunoblotted as indicated. d, U-2 OS cells were transfected with a non-targeting siRNA or an siRNA against DCAF8 followed by treatment with cycloheximide for the indicated times before collection. Cell extracts were immunoblotted as indicated. e, U-2 OS cells were transfected with a non-targeting siRNA or an siRNA against WDR61 followed by treatment with cycloheximide for the indicated times before collection. Cell extracts were immunoblotted as indicated (left). RNA extracts were also collected to measure the relative mRNA levels of WDR61 by RT–qPCR (right). Data are mean mRNA levels ± s.d., n = 3 independent experiments. f, hTERT RPE-1 cells were transfected with a non-targeting siRNA or an siRNA against AMBRA1 followed by treatment with cycloheximide for the indicated times before collection. Cell extracts were immunoblotted as indicated. g, HeLa, HEK 293T, HCT-116, hTERT RPE-1 and U-2 OS cells were transfected with a non-targeting siRNA or an siRNA against AMBRA1 before collection. Cell extracts were immunoblotted for the indicated proteins (l.e., long exposure; m.e., medium exposure; s.e., short exposure). h, Schematic representation of the AMBRA1 genomic locus and gRNA target location. Exon 2 refers to the human AMBRA1 gene in XM_005253009 (GRCh38. p13, NCBI gene: 55626). Representative AMBRA1 wild-type genomic DNA template and knockout mutant sequences identified by TOPO-TA cloning of PCR products from HCT-116, U-2 OS and hTERT-RPE1 cells are depicted. i, Three AMBRA1−/− and one AMBRA1+/+ hTERT RPE-1 clones were treated with cycloheximide for the indicated times, after which cell extracts were immunoblotted for the indicated proteins. j, Two AMBRA1−/− and one AMBRA1+/+ T98G clones were treated with either cycloheximide for the indicated times, MG132 or MLN4924 (both for 4 h) before collection. Cell extracts were then immunoblotted for the indicated proteins. k, HCT-116 cells were infected with a retrovirus expressing mAzG-CCND1 and transfected with a non-targeting siRNA or an siRNA against AMBRA1 for two rounds. Cells were then treated with cycloheximide for the indicated times, after which cell extracts were immunoblotted for the indicated proteins (endo, endogenous; exo, exogenous). l, AMBRA1−/− U-2 OS cells were transiently transfected with a vector expressing a C-terminal 3×Flag-tagged AMBRA1 or an empty vector for 96 h. Where indicated, cells were treated with MLN4924 for 4 h before lysis. Cell extracts were immunoblotted as indicated. Unless otherwise noted, experiments were performed at least three independent times.
Extended Data Fig. 3 |
Extended Data Fig. 3 |. Depletion of AMBRA1 using the auxin-inducible degron system.
a, Schematic representation of the CRISPR–Cas9-based strategy to insert an N-terminal, 2×Flag-tagged minimal AID (mAID) in the endogenous locus of AMBRA1 (5′-end of exon 2) in HCT-116 cells. Cells were infected with a doxycycline-inducible lentivirus expressing Oryza sativa TIR1 (osTIR1). b, Three knock-in clones were obtained as in a and compared to wild-type clones for proper endogenous tagging of AMBRA1 by immunoblotting. Note the higher molecular weight of 2×Flag-mAID-tagged AMBRA1. c, Three knock-in clones were treated with doxycycline with or without increasing doses of auxin for 12 h. Cell extracts were immunoblotted as indicated. The asterisk indicates a non-specific band. d, One clone of 2×Flag-mAID-AMBRA1 HCT-116 cells (clone #F1) was treated with either DMSO or doxycycline for 12 h, and/or auxin, MG132 and MLN4924 (alone or in combination) for 4 h as indicated. Cell extracts were immunoblotted as indicated. e, Longer exposure from the cyclin D1 and phospho-cyclin D1 (T286) immunoblots described in d. f, Whole-cell extracts from 2×Flag-mAID-AMBRA1 HCT-116 cells pre-treated with either DMSO or doxycycline for 12 h, and exposed to combinations of auxin, MG132 and/or MLN4924 as indicated for 4 h, related to Fig. 2d. Cell extracts were immunoblotted as indicated. Unless otherwise noted, experiments were performed at least three independent times.
Extended Data Fig. 4 |
Extended Data Fig. 4 |. Mutations in the TP motif of D-type cyclins protect them from AMBRA1-mediated degradation.
a, Protein sequence alignment of the extreme C termini of D-type cyclins from different source organisms. Amino acids highlighted in red correspond to the highly conserved TP motif. Asterisks indicate positions that are fully conserved. Colons indicate conservation between groups of strongly similar properties. The dot indicates conservation between groups of weakly similar properties. The alignment was performed in UniProt (https://www.uniprot.org/) using the Clustal Omega algorithm. UniProt identifiers are shown on the left. Source organisms: HUMAN, H. sapiens; BOVIN, Bos taurus; CANLF, Canis familiaris; MOUSE, Mus musculus; RAT, Rattus norvegicus; DANRE, Danio rerio; BRAFL, Branchiostoma floridae; STRPU, Strongylocentrotus purpuratus; CRAGI, Crassostrea gigas; LOTGI, Lottia gigantean; OCTBM, Octopus bimaculoides; STRMM, Strigamia maritima; BOMMO, Bombyx mori; ATTCE, Atta cephalotes; APIME, Apis mellifera; CULQU, Culex quinquefasciatus; HYDVU, Hydra vulgaris; NEMVE, Nematostella vectensis; TRIAD Trichoplax adhaerens. b, Multiple sequence logo of the alignment performed in a generated using WebLogo 3 (http://weblogo.threeplusone.com). c, HCT-116 cells were infected with lentiviruses expressing either FFSS-tagged empty vector (EV) or FFSS-tagged wild-type or mutant cyclin D1. Cells were treated with MLN4924 before lysis and affinity purification (AP) with an anti-STREP resin. Proteins were immunoblotted as indicated. d, HEK 293T cells were transiently transfected with plasmids expressing either SF-tagged empty vector or SF-tagged D-type cyclins wild-type or mutants. Cells were treated with MLN4924 before lysis and immunoprecipitation with an anti-Flag resin. Proteins were immunoblotted as indicated. e, HCT-116 cells were infected with retroviruses expressing FFSS-tagged wild-type or mutant cyclin D1. Cells were treated with cycloheximide for the indicated times before collection. Cell extracts were immunoblotted as indicated. f, HCT-116 cells were infected with retroviruses expressing FFSS-tagged wild-type or mutant cyclin D2. Cells were treated with cycloheximide for the indicated times before collection. Cell extracts were immunoblotted as indicated. g, HCT-116 cells were infected with retroviruses expressing FFSS-tagged wild-type or mutant cyclin D3. Cells were treated with cycloheximide for the indicated times before collection. Cell extracts were immunoblotted as indicated. h, HCT-116 cells were transfected with vectors expressing SF-tagged CDC25A, SF-tagged p27, SF-tagged cyclin D1, SF-tagged cyclin D1(T286A) or empty vector. Cells were treated with MLN4924 for 4 h before collection. Lysates were used for an immunoprecipitation with an anti-Flag resin. Proteins were immunoblotted as indicated. i, HCT-116 cells were transfected with vectors expressing HA-tagged FBXO4, SF-tagged TRF1, SF-tagged cyclin D1, SF-tagged cyclin D1(T286A) or empty vector. Cells were treated with MLN4924 for 4 h before collection. Lysates were used for an affinity purification with an anti-Strep resin. Proteins were immunoblotted as indicated. The asterisk indicates a non-specific band. j, HCT-116 cells were transfected with vectors expressing HA-tagged FBXW8, SF-tagged IRS1, SF-tagged cyclin D1, SF-tagged cyclin D1(T286A) or empty vector. Cells were treated with MLN4924 for 4 h before collection. Lysates were used for an immunoprecipitation with an anti-Flag resin. Proteins were immunoblotted as indicated. k, Parental and 2×Flag–mAID–AMBRA1 HCT-116 cells were lysed and their extracts were used for an immunoprecipitation with an anti-Flag resin. Proteins were immunoblotted as indicated. l, One clone of 2×Flag–mAID–AMBRA1 HCT-116 cells (clone F1) was infected with retroviruses expressing GFP-CCND1 or GFP-CCND1(T286A). Cells were treated with doxycycline for 12 h, before exposure to auxin for 4 h before collection as indicated. Control cells were treated with DMSO. Cell extracts were immunoblotted as indicated. m, Parental and AMBRA1−/− HCT-116 and U-2 OS cells were lysed and their extracts were blotted as indicated. The accumulation of cyclin D1 and phosphorylated cyclin D1 (T286) is reported as their corresponding intensity ratios between AMBRA1−/− and parental cells. Data are mean ± s.e.m. (n = 3 biological replicates per group). n, Three different AMBRA1−/− HCT-116 clones (clones D2, F11 and G7), 2×Flag-mAID-AMBRA1 HCT-116 cells (clone F1) and HCT-116 cells transfected with a non-targeting siRNA or an siRNA against AMBRA1 were lysed and their extracts were immunoblotted as indicated (either by employing fluorescently labelled secondary antibodies or by enhanced chemiluminescence). Untransfected CCND1−/− HCT-116 cells or CCND1−/− HCT-116 cells transfected with vectors expressing untagged cyclin D1(WT) or untagged cyclin D1(T286A) were used as control. Where indicated (black triangles), samples were serially diluted before electrophoresis and immunoblotting for easier visual comparison of cyclin D1 and phosphorylated cyclin D1 (T286) levels between groups. The analysis of normalized phosphorylated cyclin D1 (T286) over total cyclin D1 fluorescent intensity levels are provided as bar graphs. The ratios were calculated from lane 2 and lane 4 from each biological group in the fluorescent immunoblot. o, HCT-116 cells were infected with lentiviruses expressing FFSS-tagged cyclin D1 or FFSS-tagged cyclin D1(T286A). Cells were treated with DMSO (N/T) or MLN4924 for 4 h before lysis and immunoprecipitation with an anti-Flag resin, followed by elution with a 3×Flag peptide. Eluted samples were then analysed by LC-MS/MS for the identification of post-translational modifications. The table reports all identified sites in wild-type cyclin D1 and cyclin D1(T286A) that were modified with a di-Gly/114.0429 signature. p, Synthetic, unphosphorylated (amino acids PKAAEEEEEEEEEVDLACTPTDVRDVDI) and phosphorylated (T286) (amino acids PKAAEEEEEEEEEVDLAC-pT-PTDVRDVDI) peptides (2.5 μg each) corresponding to the extreme C terminus of cyclin D1 were spotted on a nitrocellulose membrane before immunoblotting with an anti-phosphorylated cyclin D1 (T286) antibody. q, Synthetic, phosphorylated (T286) peptide corresponding to the sequence of cyclin D1 indicated in p was incubated with in vitro transcribed and translated AMBRA1 from rabbit reticulocytes extracts for the indicated times in the presence of wild-type ubiquitin (Ub) or a mutant of ubiquitin [Ub(K0)] in which all lysine residues have been mutated to arginine. Reactions were stopped with Laemmli buffer. Proteins were immunoblotted as indicated. Unless otherwise noted, experiments were performed at least three independent times.
Extended Data Fig. 5 |
Extended Data Fig. 5 |. Loss of AMBRA1 regulates D-type cyclins during normal cell cycle, upon nutrient deprivation and after genotoxic stress.
a, Three AMBRA1−/− and two AMBRA1+/+ clones were pulsed with EdU for 45 min before fixation with 4% paraformaldehyde, and immunofluorescent staining for the indicated proteins. Detection of EdU was accomplished using the Click-iT Plus EdU Alexa Fluor 647 Imaging Kit (Thermo Fisher Scientific). DAPI was used to detect DNA. Scale bars, 20 μm. b, AMBRA1+/+ and AMBRA1−/− T98G cells were serum-deprived for 72 h. Cells were then released with the re-addition of 10% FBS and collected at the indicated times. Cell extracts were immunoblotted as indicated. c, Representative images of AMBRA1+/+ and AMBRA1−/− U-2 OS cells stably infected with retroviruses expressing mAzG-CCND1 and mPlum-PCNA and monitored via live-cell imaging. Note that mPlum-PCNA forms nuclear foci during S phase. Scale bar, 20 μm. d, Quantification of mAzG-CCND1 changes in mean nuclear intensity in single cells tracked over time related to c. Plots represent percentage change from t = 0 (PCNA foci formation). Lines show mean and the shaded regions represent the 95% confidence interval. AMBRA1 WT, n = 12 cells; AMBRA1 KO, n = 34 cells. e, U-2 OS cells were infected with a retrovirus expressing mAzG-cyclin D1, and transfected with a non-targeting siRNA or an siRNA against AMBRA1 for two rounds. Cells were then exposed to UV (5 mJ cm−2) irradiation for the indicated times before collection. Cell extracts were immunoblotted as indicated. f, HCT-116 cells were infected with a retrovirus expressing mAzG-cyclin D1, and transfected with a non-targeting siRNA or an siRNA against AMBRA1 for two rounds. Cells were then exposed to UV (5 mJ cm−2) irradiation for the indicated times before collection. Cell extracts were immunoblotted as indicated. g, AMBRA1+/+ and AMBRA1−/− HCT-116 and U-2 OS cells were maintained in normal medium or nutrient-deprived in EBSS for 4 h before collection. Cell extracts were immunoblotted as indicated. h, HCT-116 cells were transfected with a non-targeting siRNA or combinations of siRNAs against AMBRA1, E2F1, E2F2 and E2F3 as indicated for three rounds before lysis and immunoblotting for the indicated proteins. i, T98G cells were transfected with an sgRNA control or an sgRNA targeting AMBRA1. AMBRA1−/− clones positive for gene editing were pooled together. Parental and AMBRA1−/− pooled T98G cells were then infected with a CDK4/6 activity reporter and seeded in glass-bottom plates. Three days after seeding, cells were stained with Hoechst 33342 before imaging. Scale bars, 50 μm. j, AMBRA1+/+ and AMBRA1−/− U-2 OS cells were fixed in 4% paraformaldehyde and immunostained as indicated. DAPI was used to detect DNA. Scale bars, 20 μm. k, HCT-116, U-2 OS and hTERT RPE-1 cells were treated with leptomycin B (LMB) for 4 h before exposure to cycloheximide for the indicated times. Cell extracts were immunoblotted as indicated. l, U-2 OS cells were infected with retroviruses expressing either mAZG-tagged wild-type cyclin D1 or cyclin D1 fused to a nuclear localization signal (NLS). Cells were then treated with cycloheximide for the indicated times before collection. Cell extracts were immunoblotted as indicated. Unless otherwise noted, experiments were performed at least three independent times.
Extended Data Fig. 6 |
Extended Data Fig. 6 |. Report of MPPH-derived mutations in CCND2 and evidence of the ability of abemaciclib to cross the murine placental barrier.
a, Graphical representation of MPPH-associated CCND2 mutations affecting T280 and P281 in cyclin D2. b, Genotype and clinical phenotypes of patient 295112 (https://decipher.sanger.ac.uk) . c, Genotype and clinical phenotypes of patient 305416 (https://decipher.sanger.ac.uk) . d, Representative immunofluorescent sections (20× magnification) of the mesencephalic ventricular zone of E13.5 Ambra1+/+ and Ambra1gt/gt embryos stained for cyclin D1, cyclin D2 or p-RB (S807/811). Scale bars, 100 μm. e, Experimental timeline of the daily, oral administration of abemaciclib to pregnant Ambra1gt/+ mice (from E8.5 to E13.5) (1), and collection of amniotic fluid via a 28G insulin syringe from the amniotic sacs of E13.5 embryos for subsequent LC-MS/MS analysis (2). f, Mass spectrometry imaging of abemaciclib in mouse embryos. Left, optical registration image of the slide with each section before MALDI imaging. Right, extracted ion mobility image for abemaciclib (green) as detected based on authentic standards [M+H]+ at 507.2791 m/z (±15 ppm) with a mobility (1/K0) of 1.177 (±1%), maternal dose of 100 mg kg−1. Scale bar, 2 mm. This experiment was performed once. g, h, MS intensity of abemaciclib in tissue samples (g), interpolated abemaciclib concentration in maternal plasma (h, left) and interpolated abemaciclib concentration in amniotic fluid (h, right). Maternal brain, embryonic tissue, amniotic fluid and maternal plasma samples were obtained from mice administrated with daily dosages of abemaciclib mesylate at 8 mg kg−1 or 16 mg kg−1 from E8.5 to E13.5, and at 100 mg kg−1 from E12.5 to E13.5. The abemaciclib MS intensity shown for tissue samples was corrected based on a 3× signal-to-noise cut-off with a floor of 10,000 using the blank controls. The abemaciclib concentration shown in both the amniotic fluid and plasma sample was interpolated based on the standard curve prepared in blank amniotic fluid and blank plasma, respectively. N.D., not detected. This experiment was performed once. i, j, E13.5 Ambra1+/+ and Ambra1gt/gt embryos were collected from pregnant mice treated with vehicle (PBS) or 8 mg kg−1 abemaciclib. Immunofluorescence from sections was quantified to show area of p-RB (S807/811) (i) and cyclin D2 (j) staining in the mesencephalic ventricular zone (MVZ). Data are mean ± s.d. p-Rb (S807/811), n = 3; cyclin D2, n = 3. Adjusted P values were calculated using a two-way ANOVA with Tukey’s multiple comparisons test. k, Protein extracts derived from E9.5, E10.5 and E13.5 Ambra1+/+ and Ambra1gt/gt embryo heads (four independent embryos per group) were immunoblotted for the indicated proteins. Unless otherwise noted, experiments were performed at least three independent times.
Extended Data Fig. 7 |
Extended Data Fig. 7 |. AMBRA1 and D-type cyclins in human cancer.
a, Lolliplots showing amino acid positions and numbers of mutations in AMBRA1, FBXO11, CCNF and KEAP1 in pan-cancer samples generated from cBioPortal (https://www.cbioportal.org/) and using the curated set of non-redundant studies, (last accessed: December 2019). b, Scatter plot of cyclin D1 protein levels (RPPA) and mRNA expression levels of AMBRA1 (FPKM-UQ) in different TCGA cohorts. LGG, n = 435; OV, n = 257; PRAD, n = 344; TGCT, n = 124. Pearson correlation analysis was performed to calculate P and R values. The shaded area represents the 95% confidence interval of the regression line. c, Representative immunohistochemistry image fields of AMBRA1−/− and AMBRA1+/+ HCT-116 plasma-thrombin cell blocks stained with either a rabbit polyclonal anti-human AMBRA1 antibody (Proteintech Group 13762–1, lot nos. 00005112 and 00017852, RRID: AB_10642007), a mouse anti-human AMBRA1 clone G-6 antibody (Santa Cruz Biotechnology sc-398204, lot no. G1217, RRID: AB_2861324), or a rabbit anti-human cyclin D1 clone SP4 antibody (Ventana Medical Systems 790–4508, lot no. B08078, RRID: AB_2335988). Scale bar, 50 μm. This experiment was performed once. d, A TMA containing normal and tumour ovarian human specimens was immunostained with antibodies to AMBRA1 and cyclin D1. Violin plots show automated quantification of cyclin D1 intensity levels and pathological scoring of nuclear AMBRA1 intensity levels (0, no expression; 1, faint expression; 2, mild or moderate expression) (n = 44 biologically independent samples). Adjusted P values were calculated using a one-way ANOVA with Dunnett’s multiple comparisons test. e, The graph shows automated quantification of cyclin D1 and AMBRA1 intensity levels from the TMA described in d. n = 44 biologically independent samples. Pearson correlation analysis was performed to calculate P and R2 values. The shaded area represents the 95% confidence interval of the regression line. f, Kaplan–Meier plots showing survival probability of human cancer patients partitioned in low AMBRA1 mRNA levels (n = 2,110 for quantiles 0.2/0.8, and n = 5,273 for quantiles 0.5/0.5) and high AMBRA1 mRNA levels (n = 2,110 for quantiles 0.2/0.8, and n = 5,273 for quantiles 0.5/0.5; TCGA (https://cancer.gov/tcga)). P values were calculated using the log-rank test. Meta P values: 0.0389 (for quantiles 0.2/0.8), 0.0475 (for quantiles 0.5/0.5). g, Priority targets from pan-cancer and cancer-type analyses, as previously described. CCND1, CCND2, CDK4 and CDK6 are highlighted in red. Select oncogenes are in black.
Extended Data Fig. 8 |
Extended Data Fig. 8 |. C-terminal cancer mutations affecting cyclin D1, cyclin D2 and cyclin D3.
ac, Lolliplots showing the amino acid positions and their mutation numbers in the degron motif of CCND1 (a), CCND2 (b) and CCND3 (c) in pan-cancer, gathered and combined from cBioPortal (curated set of non-redundant studies),, COSMIC (https://cancer.sanger.ac.uk/cosmic) , and Schmitz et al. (indicated by the dagger). Black arrows in c indicate mutations identified in haematopoietic and lymphoid malignancies. del, deletion; fs, frameshift; *, stop codon. Last accessed October 2019.
Extended Data Fig. 9 |
Extended Data Fig. 9 |. AMBRA1 CRISPR gene score distribution in DLBCL.
ac, Average pan- (a), subtype-specific (b) and cell-type specific (c) DLBCL CRISPR gene score distribution, as reported. ABC, activated B cell-like; GCB, germinal centre B cell-like. Putative oncogenes are depicted in blue; putative tumour suppressors are depicted in red.
Extended Data Fig. 10 |
Extended Data Fig. 10 |. AMBRA1 is a tumour suppressor in DLBCL.
a, Differential expression of AMBRA1 in DLBCL compared with normal B-lymphocytes from Compagno et al.. P = 9.91 × 10⁻⁶. b, Differential expression of AMBRA1 in DLBCL compared with normal B-lymphocytes from Brune et al.. P = 0.003. a, b, Dots indicate maxima and minima; whiskers indicate 90th and 10th percentiles; box edges indicate 75th and 25th percentiles; and centre lines indicate median; P values were calculated using a Student’s t-test, as described (https://www.oncomine.org). c, TCGA-derived, CpG-aggregated methylation values (β-values) of AMBRA1 and other established hypermethylated genes in cancer (depicted in red) compared with hypomethylated genes (depicted in green) in DLBCL. Solid lines denote the mean of β-values for each group. d, Kaplan–Meier plot showing survival probability of patients with DLBCL partitioned in low AMBRA1 mRNA levels (n = 50) and high AMBRA1 mRNA levels (n = 49), combining GEO number GSE23501 and GEO number GSE10846, using probe 52731_at (https://www.oncomine.org) (0.10/0.90 quantiles). P values by log-rank test. e, OncoPrint map of the genetic alterations in AMBRA1 and selected RB-pathway genes; TCGA DLBC cohort. f, Heat map showing hierarchical clustering of transcriptional signatures of tumours bearing alterations in either AMBRA1 or CCND3, derived from TCGA DLBC cohort. del, deletion; mut, mutation; amp, amplification; other, tumours bearing unaltered AMBRA1 and CCND3. AMBRA1 (RefSeq XM_005253009) mutations: R439K and D1287G. CCND3 (RefSeq NM_001760) mutation: T283A. g, Gene enrichment analysis of the top 300 most differentially expressed genes in patients harbouring alterations in AMBRA1 and CCND3 from TCGA (DLBC cohort) was performed using Enrichr (https://amp.pharm.mssm.edu/Enrichr/) with BioPlant (2019), Reactome (2016) and NCI-Nature (2016) databases. Asterisks indicate pathways regulated by D-type cyclins. h, BJAB cells were infected with lentiviruses expressing either one of three independent sgRNAs targeting AMBRA1 or one sgRNA targeting luciferase as control (CTRL). Upon FACS sorting, cell populations were treated with cycloheximide for the indicated times, MG132 or MLN4924 (for 4 h) before collection. Cell extracts were immunoblotted for the indicated proteins. i, BJAB cells expressing either control sgRNA targeting luciferase or sgRNA targeting AMBRA1 were xenotransplanted in NSG mice via subcutaneous flank injections. Tumour volume was calculated by caliper measurement. Data are mean tumour volume ± s.d. (n = 3 per group); nonlinear (exponential growth) fitted curves. P values by unpaired, multiple-comparison t-test using the Holm–Sidak method. Day 0: NS; day 13: P = 0.1885]; day 14 P = 0.0045; day 15: P = 0.0083; day 16: P = 0.0048; day 17: P = 0.0223. *P < 0.05. j, The weight of tumours described in i was measured on excised tumours at the experimental end point. Data are mean tumour weight ± s.e.m. (n = 3 per group). P values by unpaired t-test. k, U-2932 cells were infected with lentiviruses expressing either one of three independent sgRNAs targeting AMBRA1 or one sgRNA targeting luciferase as control (CTRL). Upon FACS sorting, cell populations were collected, and cell extracts were immunoblotted as indicated. l, U-2932 expressing either control sgRNA targeting luciferase or sgRNA targeting AMBRA1 were xenotransplanted in NSG mice via subcutaneous flank injections. Tumour volume was calculated by caliper measurement. Data are mean tumour volume ± s.e.m. (n = 5 per group at day 0). P values by unpaired, multiple-comparison t-test using the Holm–Sidak method, until day 40 (the latest time point where at least 3 mice per group were available). Day 23: P = 0.0008; day 25: P = 0.0191; day 26: P = 0.0133; day 27: P = 0.0041; day 30: P = 0.0079; day 31: P = 0.0292; day 32: P = 0.0148; day 33: P = 0.0002; day 34: P = 0.0001; day 37: P = 0.0165; day 38: P = 0.0306; day 39: P = 0.0240; day 40: P = 0.0401. *P < 0.05. These data are from the same dataset shown in Fig. 4c. Unless otherwise noted, experiments were performed at least three independent times.
Extended Data Fig. 11 |
Extended Data Fig. 11 |. Loss of AMBRA1 promotes the formation of CDK2–D-type cyclins complexes.
a, Schematic representation of the experiment used to identify global regulators of the response to CDK4/6 inhibitors in U-2 OS cells using a whole-genome, CRISPR–Cas9 human GECKOv2 pooled library. b, Scatter plot of the candidate hits generated from a. This experiment was performed once, with four technical replicates. P values were calculated using the MAGeCK algorithm. c, Parental and AMBRA1−/− HCT-116, T98G or U-2 OS cells were treated with various concentrations of abemaciclib. Survival curves were generated using the AlamarBlue assay. Data are mean survival percentage ± s.d. (n = 3 biological replicates per group). The signal from each condition was normalized to an untreated control to adjust for any relative growth difference. d, AMBRA1+/+ and AMBRA1−/− T98G cells were treated with abemaciclib (75 nM) or DMSO for 24 h before collection and immunoblotting for the indicated proteins. e, HCT-116 cells were transfected with a non-targeting siRNA or an siRNA against AMBRA1 for three rounds before treatment with abemaciclib (75 nM) or DMSO for 24 h. Cells were collected and their extracts were immunoblotted for the indicated proteins. f, Parental and AMBRA1−/− HCT-116 cells were collected, and their extracts were used for an immunoprecipitation with an anti-CDK4 antibody or control IgG isotype. Proteins were immunoblotted as indicated. g, HEK 293T were transfected with plasmids expressing either FFSS-tagged cyclin D1, cyclin D2 and cyclin D3 or empty vector before lysis and immunoprecipitation with an anti-Flag resin. Proteins were immunoblotted as indicated. h, AMBRA1−/− HCT-116 cells were collected, and their extracts were used for an immunoprecipitation with an anti-cyclin D1 antibody or control IgG isotype. Proteins were immunoblotted as indicated. i, AMBRA1−/− HCT-116 cells were collected, and their extracts were used for an immunoprecipitation with an anti-cyclin D3 antibody or control IgG isotype. Proteins were immunoblotted as indicated. j, HCT-116 cells were infected with retroviruses expressing either FH-tagged cyclin D1(WT) or cyclin D1(T286A), and their extracts were used for immunoprecipitation with anti-CDK2 antibody or control IgG isotype. Proteins were immunoblotted as indicated. Unless otherwise noted, experiments were performed at least three independent times.
Extended Data Fig. 12 |
Extended Data Fig. 12 |. Loss of AMBRA1 desensitizes cells to CDK4/6 inhibitors.
a, HEK 293T cells were (co)transfected for 48 h with FFSS-tagged cyclin D2 or FFSS-tagged cyclin D3, HA-tagged CDK2, or FH-tagged empty vector, in the combinations indicated. After a double-immunoprecipitation, cyclin D–CDK2 complexes were incubated with GST–RB(773-CT) for 30 min with or without 100 nM, 250 nM or 500nM palbociclib, or 500 nM flavopiridol, before stopping the reaction with Laemmli buffer. Proteins were immunoblotted as indicated. b, HEK 293T cells were (co)transfected for 48 h with FFSS-tagged cyclin D1, HA-tagged CDK2, HA-tagged CDK4 or FH-tagged empty vector in the combinations indicated. After a double immunoprecipitation, the purified cyclin D1–CDK4 and cyclin D1–CDK2 complexes were incubated with GST–RB(773-CT) for 30 min with or without 100 nM palbociclib or 100 nM flavopiridol, before stopping the reaction with Laemmli buffer. Proteins were immunoblotted as indicated. c, HEK 293T cells were (co)transfected for 48 h with FFSS-tagged cyclin D3, HA-tagged CDK2, HA-tagged CDK4, or FH-tagged empty vector in the combinations indicated. After a double immunoprecipitation (anti-Flag immunoprecipitation, elution with 3×Flag peptide, then anti-HA immunoprecipitation), cyclin D3–CDK4 and cyclin D3–CDK2 complexes bound to the beads were incubated with GST–RB(773-CT) for 30 min with or without 100 nM, 250 nM or 500nM palbociclib, or 500 nM flavopiridol, before stopping the reaction with Laemmli buffer. Proteins were immunoblotted as indicated. d, Parental and AMBRA1−/− HCT-116 cells were transfected with a non-targeting siRNA or an siRNA against CDK2 for three rounds before treatment with various concentrations of palbociclib (left) or abemaciclib (right). Survival curves were generated using the AlamarBlue assay. Data are mean survival percentage ± s.d. (n = 3 biological replicates per group). The signal from each condition was normalized to an untreated control to adjust for any relative growth difference. e, Before treatment, cell extracts from d were immunoblotted as indicated. f, Working model: by modulating the levels of D-type cyclins, CRL4AMBRA1 controls the execution of cell-cycle progression, thus ensuring proper embryonic development and tumour suppression (top). Impairment of CRL4AMBRA1-mediated degradation of D-type cyclins (for example, alterations or downregulation of AMBRA1 or mutations in the TP motif of D-type cyclins) deregulates cell-cycle progression, and results in embryonic lethality, increased tumorigenic potential, and reduced sensitivity to CDK4/6 inhibitors (bottom). Unless otherwise noted, experiments were performed at least three independent times.
Fig. 1 |
Fig. 1 |. Three orthogonal screens identify CRL4AMBRA1 as a regulator of cyclin D1.
a, HCT-116 cells were transfected with a non-targeting (NT) siRNA or siRNAs against CUL1, CUL2, CUL3, CUL4A and CUL4B (CUL4A/B) or CUL5, and cell lysates were blotted with the indicated antibodies for proteins and phosphorylated (p-) proteins. This experiment was performed three times. b, Schematic representation of three orthogonal screens employed to identify regulators of cyclin D1. c, Heat map showing fluorescence intensity values in arbitrary units (AU), related to approach 1 in b. Genes encoding for the previously-reported regulators of D-type cyclins are reported in blue. This experiment was performed once in HCT-116 and once in U-2 OS cells. d, Heat map showing the number of peptide-spectrum matches (PSM) identified by LC-MS/MS matching substrate receptors from immunoprecipitates of empty vector (EV), wild-type (WT) cyclin D1, or cyclin D1(T286A), related to approach 2 in b. The full list of interactors is provided in Supplementary Table 1. e, Scatter plot of hits generated using approach 3 in b. This experiment was performed once, with three technical replicates. P values were calculated using the MAGeCK algorithm. SR, substrate receptor. f, Venn diagram showing the number of hits obtained from the three screens in b. g, The top 100 CRISPR (Avana) Public 20Q1 pre-computed associations for AMBRA1 and selected substrate receptors that have a role in human cancer are depicted on the basis of their dependency profiles at genome scale (https://depmap.org/portal/; last accessed January 2020).
Fig. 2 |
Fig. 2 |. AMBRA1 targets D-type cyclins for ubiquitin-mediated degradation, controlling cell cycle progression.
a, Three AMBRA1−/− (KO) and two AMBRA1+/+ HCT-116 clones were treated with cycloheximide (CHX) as indicated and lysates were blotted with the indicated antibodies. b, HCT-116 cells expressing 2×Flag–mAID–AMBRA1 (clone F1) were treated with DMSO or doxycycline (Dox) for 12 h before exposure to auxin (Aux). HA, haemagglutinin. c, HCT-116 cells expressing 2×Flag–mAID–AMBRA1 were treated as in b, washed, and cultured in growth medium as indicated. d, HCT-116 cells expressing 2×Flag–mAID–AMBRA1 were pre-treated with DMSO or doxycycline for 12 h, and exposed to combinations of auxin, doxycycline, MG132 or MLN4924 for 4 h. Endogenous cyclin D1 was immunoprecipitated in denaturing conditions and probed with ubiquitin (Ub) and cyclin D1 antibodies. e, HCT-116 cells were transfected with siRNAs as indicated (E2F1/E2F2/E2F3, E2F1, E2F2 and E2F3 siRNA; Extended Data Fig. 5h) before pulsing with EdU for 45 min. Cell cycle profiles were measured by flow cytometry. Data are mean ± s.e.m. (n = 4 biological replicates per group). Adjusted P values were calculated using a one-way ANOVA with Dunnett’s multiple comparisons test. NS, not significant. f, HCT-116 cells were transfected with a non-targeting (NT) siRNA or an siRNA against AMBRA1 before treatment with palbociclib or abemaciclib for 24 h. g, Ratio of cytoplasmic to nuclear CDK4/6 activity was measured in individual cells (Extended Data Fig. 5i). Violin plots show median (dashed line) and quartiles (dotted lines). P values were calculated using the non-parametric Mann–Whitney, unpaired t-test between AMBRA1 WT (n = 642 cells) and AMBRA1 KO (n = 738 cells). Unless otherwise noted, experiments were performed at least three independent times. Asterisks indicate non-specific bands.
Fig. 3 |
Fig. 3 |. D-type cyclins accumulate in Ambra1gt/gt mice and their hyperproliferative and neurological phenotypes are attenuated by CDK4/6 inhibition.
a, Immunoblotting of protein extracts of brain lysates from five E13.5 Ambra1+/+ and five Ambra1gt/gt mouse embryos. b, Representative immunofluorescent staining of E13.5 Ambra1+/+ and Ambra1gt/gt embryos collected from PBS-treated (top two rows) and abemaciclib-treated (bottom two rows) pregnant mice. M, mesencephalic ventricle; SC, superior colliculus; IC, inferior colliculus. Scale bars, 500 μm. c, Area of immunofluorescent staining for cyclin D1 and KI67 in the mesencephalic ventricular zone (MVZ) (data are mean ± s.d.; cyclin D1 n = 3; KI67 n = 4). P values by two-way ANOVA with Tukey’s multiple comparisons test. d, Representative sections stained with haematoxylin and eosin from PBS- (n = 3) or abemaciclib-treated (n = 7) E13.5 Ambra1+/+ and Ambra1gt/gt embryos. Top row, telencephalic structures: vStr (ventricular zone of striatum) and vPal (ventricular zone of pallium). Bottom row, caudal portion of the neural tube (NT). Arrows indicate the spina bifida phenotype. Scale bars, 500 μm. Unless otherwise noted, experiments were performed at least three independent times.
Fig. 4 |
Fig. 4 |. AMBRA1 acts as a tumour suppressor and its absence reduces sensitivity to inhibitors of CDK4/6 by promoting the formation of D-type cyclins–CDK2 complexes.
a, Endogenous CDK2 and IgG control immunoprecipitations (IPs) from parental and AMBRA1−/− HCT-116 cells. WCE, whole-cell extracts. b, HEK 293T cells were transfected as indicated. Immunopurified cyclin D1–CDK2 complexes were incubated with GST–RB(773-CT) and treated with palbociclib or flavopiridol. CT, C terminus. c, d, U-2932 cells expressing control short guide RNA (sgRNA) targeting luciferase or AMBRA1 were subcutaneously xenotransplanted in NSG mice and treated with PBS (vehicle) or palbociclib at the two indicated concentrations. c, Tumour volume. Data are mean ± s.e.m. (n = 5 per group at day 0). P values by unpaired, multiple-comparison t-test using the Holm–Sidak’s method, calculated at day 45 for the AMBRA1+/+ group and at day 40 for the AMBRA1−/− group (the latest time point where at least 3 mice per group were available). d, Survival curves. Experimental end point was declared when tumour volume reached 1,000 mm3 (n = 5 per group). P values by log-rank (Mantel–Cox) test. Unless otherwise noted, experiments were performed at least three independent times.

References

    1. Malumbres M & Barbacid M Cell cycle, CDKs and cancer: a changing paradigm. Nat. Rev. Cancer 9, 153–166 (2009). - PubMed
    1. Kanie T et al. Genetic reevaluation of the role of F-box proteins in cyclin D1 degradation. Mol. Cell. Biol. 32, 590–605 (2012). - PMC - PubMed
    1. Qie S & Diehl JA Cyclin D degradation by E3 ligases in cancer progression and treatment. Semin. Cancer Biol. 67, 159–170 (2020). - PMC - PubMed
    1. Reichermeier KM et al. PIKES analysis reveals response to degraders and key regulatory mechanisms of the CRL4 network. Mol. Cell 77, 1092–1106.e9 (2020). - PubMed
    1. Natsume T, Kiyomitsu T, Saga Y & Kanemaki MT Rapid protein depletion in human cells by auxin-inducible degron tagging with short homology donors. Cell Rep. 15, 210–218 (2016). - PubMed

Publication types

MeSH terms