. 2021 May;593(7858):289-293.
doi: 10.1038/s41586-021-03460-z. Epub 2021 Apr 14.

HP1 drives de novo 3D genome reorganization in early Drosophila embryos

Affiliations

HP1 drives de novo 3D genome reorganization in early Drosophila embryos

Fides Zenk et al. Nature. 2021 May.

Abstract

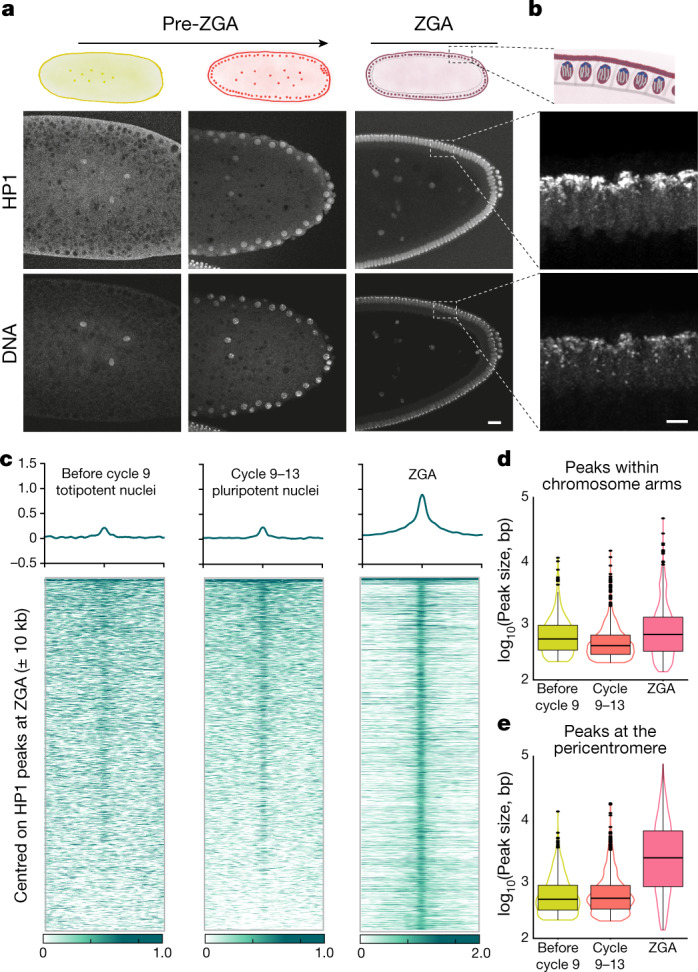
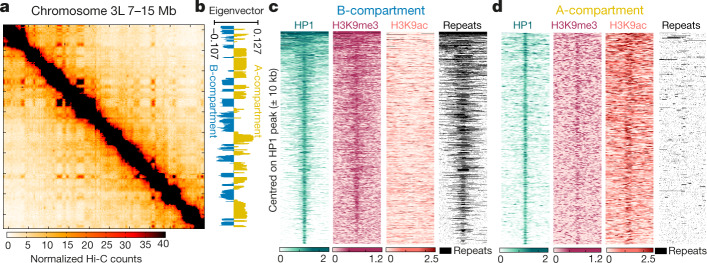
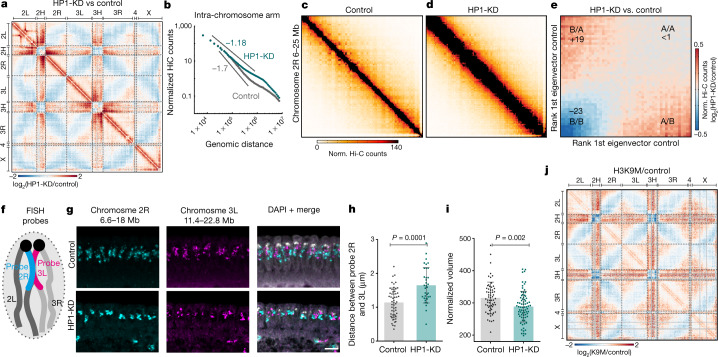
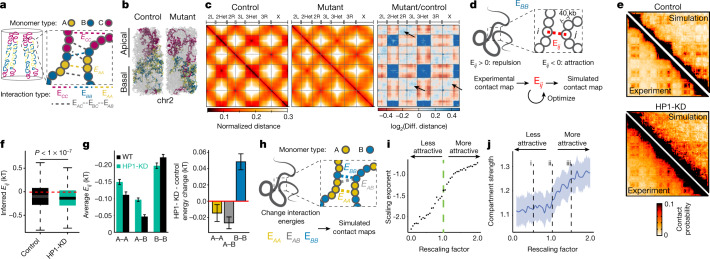
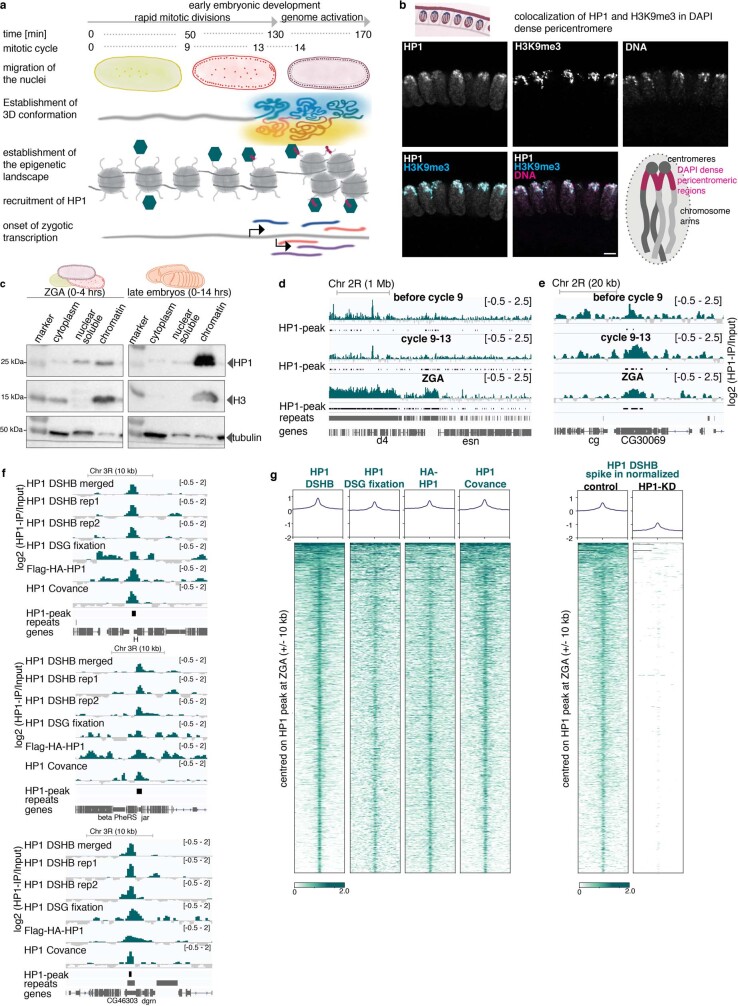
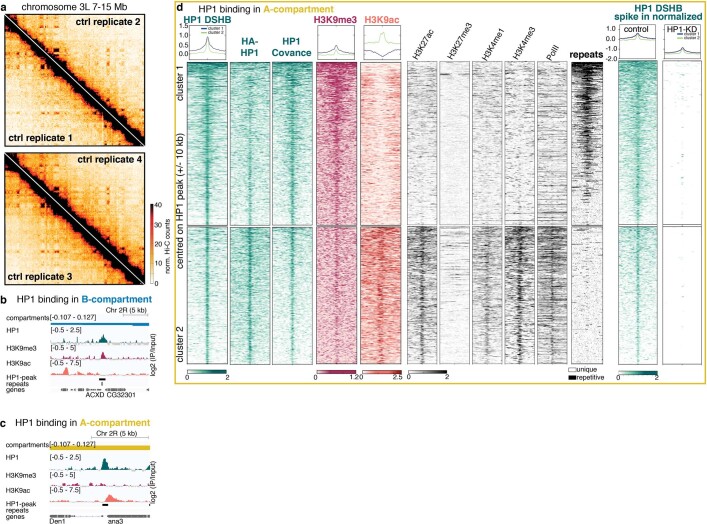
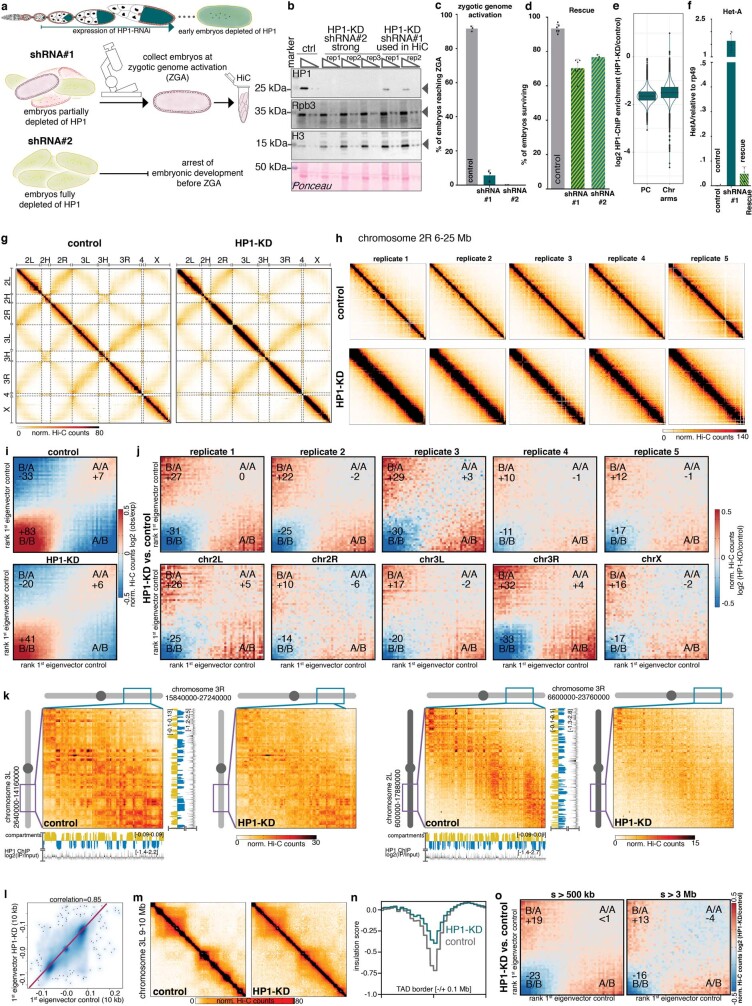
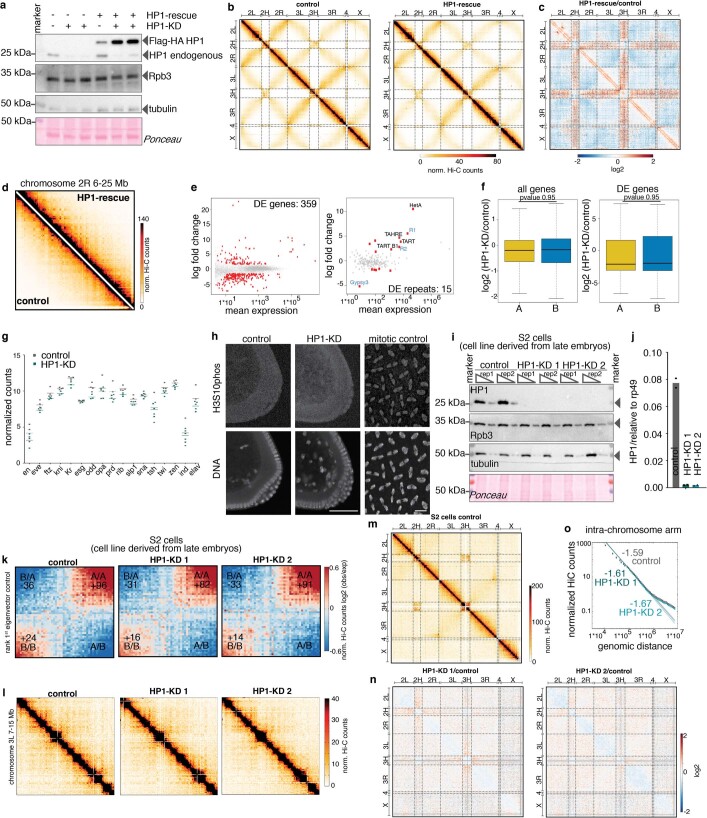
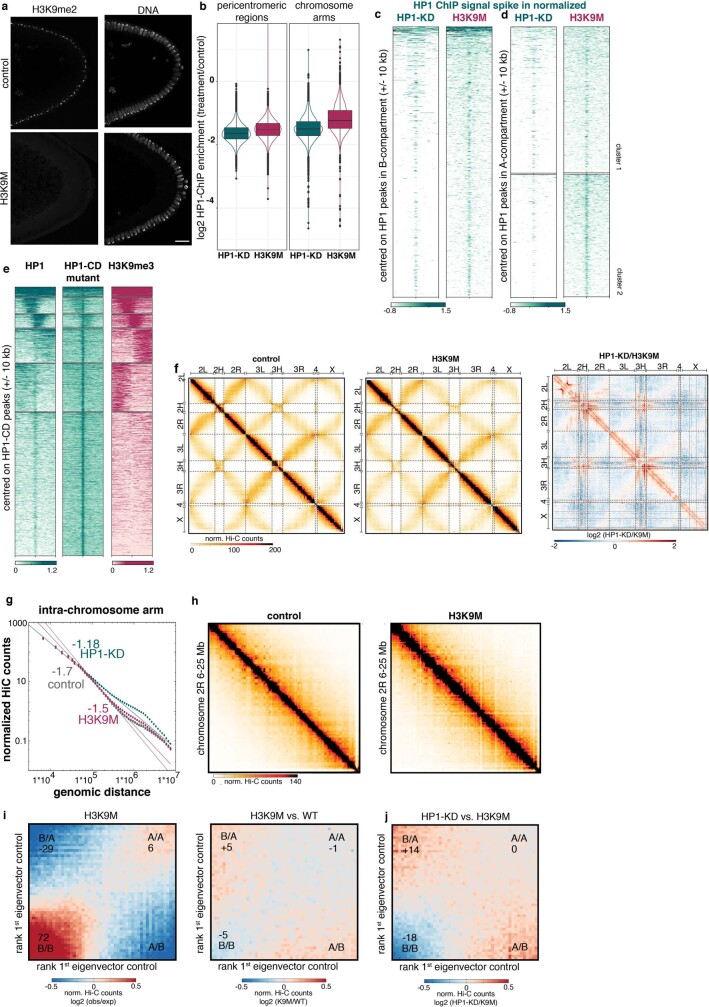
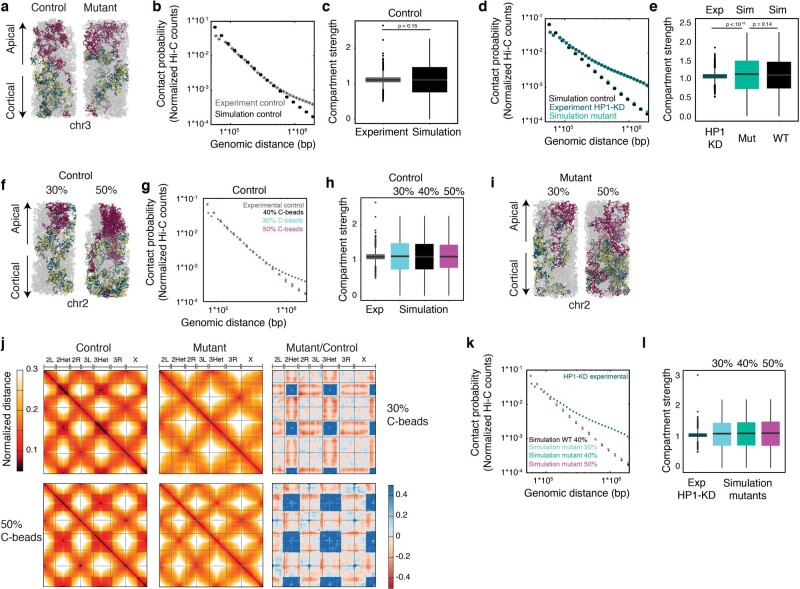
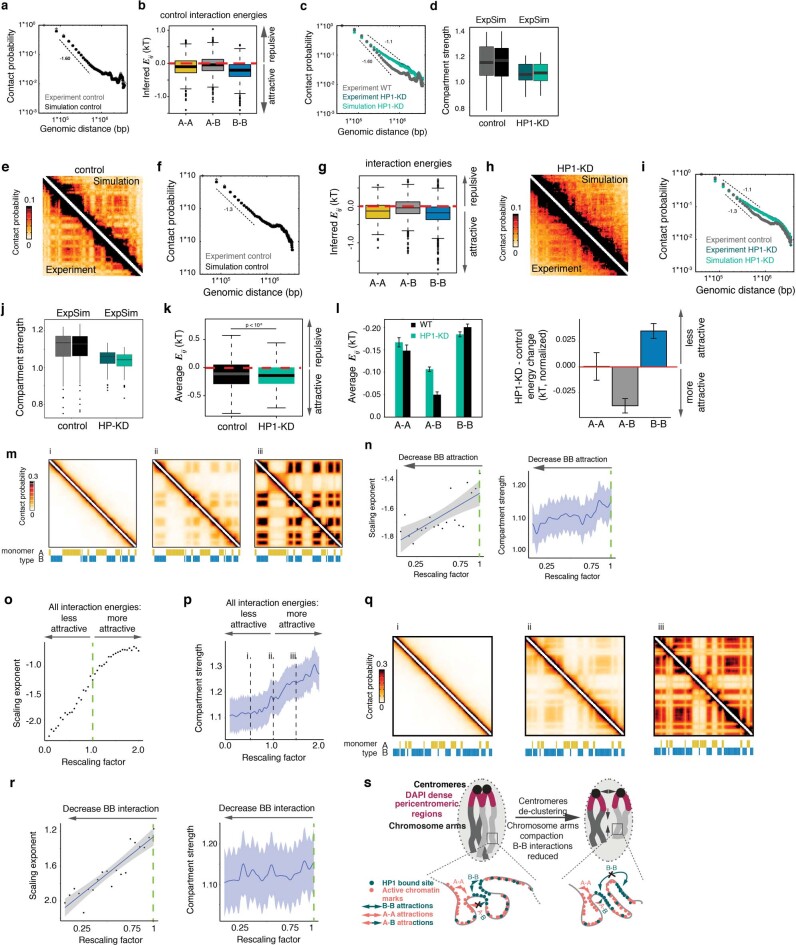
Fundamental features of 3D genome organization are established de novo in the early embryo, including clustering of pericentromeric regions, the folding of chromosome arms and the segregation of chromosomes into active (A-) and inactive (B-) compartments. However, the molecular mechanisms that drive de novo organization remain unknown1,2. Here, by combining chromosome conformation capture (Hi-C), chromatin immunoprecipitation with high-throughput sequencing (ChIP-seq), 3D DNA fluorescence in situ hybridization (3D DNA FISH) and polymer simulations, we show that heterochromatin protein 1a (HP1a) is essential for de novo 3D genome organization during Drosophila early development. The binding of HP1a at pericentromeric heterochromatin is required to establish clustering of pericentromeric regions. Moreover, HP1a binding within chromosome arms is responsible for overall chromosome folding and has an important role in the formation of B-compartment regions. However, depletion of HP1a does not affect the A-compartment, which suggests that a different molecular mechanism segregates active chromosome regions. Our work identifies HP1a as an epigenetic regulator that is involved in establishing the global structure of the genome in the early embryo.


Conflict of interest statement

The authors declare no competing interests.

Figures

Fig. 1
Fig. 1. Localization of HP1 during early embryonic development.
a, Top, schematic of early embryonic development. Bottom, immunofluorescence staining at different stages of early embryonic development. HP1 localizes to chromatin before ZGA and becomes enriched at the pericentromeric heterochromatin at ZGA. Scale bar, 20 μm. b, Close-up view of HP1 localization at ZGA. Top, schematic shows the Rabl configuration of the chromosomes at this developmental stage, with the centromeres localizing on top and the chromosome arms reaching to the bottom of the nucleus. Bottom, the centromeric regions display strong HP1 signals. Images in a and b are representative from four biological replicates. Scale bar, 5 μm. c, Heat maps of HP1 ChIP–seq signal at three different early embryonic developmental time points. The signal is centred on HP1 peaks within chromosome arms called at ZGA and ranked by signal intensity at cycles 9–13. HP1 binding to chromatin is already observed before cycle 9, and becomes more enriched during development. d, Box plots of HP1 peak size distribution within chromosome arms at cycle 9, cycles 9–13 and ZGA. e, Box plots of HP1 peak size distribution within pericentromeric regions at cycle 9, cycles 9–13 and ZGA, showing that HP1 peaks get broader at the pericentromeric regions at ZGA. In all box plots, centre line denotes the median; boxes denote lower and upper quartiles (Q1 and Q3, respectively); whiskers denote 1.5× the interquartile region (IQR) below Q1 and above Q3; points denote outliers. Source data
Fig. 2
Fig. 2. HP1 binds both A- and B-compartment regions at ZGA.
a, Hi-C contact map of an 8-Mb region on chromosome 3L (resolution 40 kb). Pooled Hi-C data of seven biological replicates are shown (Extended Data Fig. 2a). b, Compartment scores (first eigenvector of the Hi-C map, resolution: 10 kb), same region as in a (Supplementary Methods). c, Heat maps of HP1, H3K9me3 and H3K9ac ChIP–seq signals as well as repeat positions, ±10 kb centred on HP1 peaks occurring in B-compartment regions. HP1 binding overlaps with broad H3K9me3 peaks, repeats and is devoid of H3K9ac. d, As in c for HP1 peaks in A-compartment regions, showing enrichment in H3K9ac and absence of repeats (Extended Data Fig. 2b–d).
Fig. 3
Fig. 3. Depletion of HP1 causes increased intra-chromosome compaction and reduced compartmentalization.
a, Differential Hi-C contact map (log2-transformed), highlighting increased contact frequencies within chromosome arms, decreased inter-arm and inter-chromosome contacts, reduced associations within and between pericentromeric regions, and increased interactions of pericentromeric regions with chromosome arms in HP1-KD embryos. Biological replicates were pooled; n = 7 control and n = 5 HP1-KD embryos. b, HP1-KD embryos show a milder decay of contact probabilities above 100 kb. c, Hi-C contact maps of 19 Mb on chromosome 2R in control embryos (resolution: 120 kb). d, As in c, in HP1-KD embryos. e, Differential contact enrichment in HP1-KD versus control embryos, sorted by compartment score (Supplementary Methods), shows decreased B-compartment interactions and increased A/B intermixing. Changes relative to the control. f, Scheme of FISH probe design to quantify inter-arm distance and intra-arm compaction. g, Representative 3D-DNA FISH staining of control and HP1-KD embryos at ZGA. Signals from probes on chromosome 2R and chromosome 3L are shown separately and merged with DAPI staining. Scale bar, 5 μm. h, Quantification of physical distances between FISH signals from chromosome 2R and 3L (mean ± s.d., nuclei: control n = 55, HP1-KD n = 35). i, Quantification of compaction of FISH signals from chromosome 2R (mean ± s.d., nuclei: control n = 63, HP1-KD n = 75). j, Differential Hi-C contact map (log2-transformed), highlighting decreased inter-arm and inter-chromosomal contacts, reduced associations within and between pericentromeric regions, and increased interactions of pericentromeric regions with chromosome arms in H3K9M embryos. Biological replicates were pooled; n = 7 control and n = 2 H3K9M embryos. See Supplementary Methods and Extended Data Fig. 5 for further details. P values were determined by Wilcoxon two-sided test. Source data
Fig. 4
Fig. 4. HP1 establishes de novo chromatin architecture during development via two independent mechanisms.
a, Whole-genome polymer model. A- and B-type beads correspond to 10-kb A- and B-compartment regions. C-type beads correspond to pericentromeric and telomeric regions. b, Snapshots of wild-type control (left) and mutant (right) simulations. c, Genome-wide simulated distance maps of control (left) and mutant (centre). Right, differential distance map highlighting increased distances within and between centromeric and telomeric regions and reduced chromosome arm alignment (arrows). d, Polymer model of multi-megabase chromosome arm regions. Interaction energies between 40-kb beads are inferred to reproduce the experimental Hi-C map. e, Experimental and simulated contact maps in control (top) and HP1-KD (bottom) embryos (chr3R 17–20.6 Mb). f, Inferred interaction energies are overall more attractive in the HP1-KD model. P value determined by two-sided Wilcoxon test. Box plots are as in Fig. 1d. g, Left, interaction energies between B-type beads (B–B) become comparatively less attractive in HP1-KD embryos, but more attractive between A-type beads (A–A) and between A and B types (A–B). Right, average interaction energy changes between HP1-KD and control models. B-compartment attractions decrease in the HP1-KD model. Data are mean ± s.e.m., interactions: 990 (A–A), 2,069 (A–B), 1,035 (B–B). h, Chromatin is modelled as a chain of two types (A and B) of interacting 40-kb beads (chr3R 17–20.6 Mb). i, Scaling exponents increase when attractions between all beads are increased by a multiplicative factor, and vice versa. j, Compartment strength (bold line: mean) decreases when attractions between beads are increased, and vice versa. Confidence interval (shaded area) calculated using t-based approximation. Source data
Extended Data Fig. 1
Extended Data Fig. 1. Characterization of HP1 binding during early embryonic development.
a, Cartoon of early Drosophila developmental timing showing the onset of genome organization, chromatin modifications and transcription. b, Immunofluorescence staining of an embryo at ZGA. H3K9me3 and HP1 are enriched at the pericentromeric heterochromatin (clustering on top and corresponding to the DAPI dense signal; see cartoon). Representative image from four biological replicates. Scale bar, 5 μm. Quantification of the immunofluorescence signal shows that HP1 intensity is 30 times higher in the pericentromeric regions (co-localizing with H3K9me3) than in the rest of the nucleus. Average signal of 300 nuclei from 2 independent experiments. c, Cellular fractionation of embryonic extracts at 0–4 h (corresponding to ZGA) of development and from late embryos (corresponding to gastrulation and segmentation). HP1 is already detectable in the chromatin fraction at 0–4 h and becomes further enriched during differentiation. Representative of two independent experiments. For western blot source data, see Supplementary Fig. 1. d, e, Representative genomic regions showing HP1 signal as log2-transformed fold change over the input before cycle 9, between cycle 9–13 and at ZGA by ChIP–seq. HP1 peaks and repetitive sequences (UCSC RepeatMasker) are represented below. d, Strong enrichment of HP1 close to the pericentromeric heterochromatin. e, One euchromatic HP1 binding region. f, IGV browser snapshots of different genomic regions showing HP1 binding in euchromatin regions. We validated the HP1 ChIP–seq by performing replicate experiments with the same antibody from DSHB (rep1 and rep2). All further tracks in this Article show the merged track (top). To further validate our findings, we mapped the binding of HP1 by performing ChIP–seq against a Flag-haemagglutinin (HA)-tagged transgene and used a second commercial antibody (Covance) and detected the same peaks. We also used disuccinimidyl glutarate (DSG) as crosslinking agent to recover more extended regions of HP1 binding and obtained a similar result of HP1 binding. g, Heat maps of HP1, ChIP–seq signals ± 10 kb centred on HP1 peaks occurring along the chromosome arms at ZGA. We validated the binding profiles by performing ChIP–seq against HP1 with different antibodies (DSHB, HA, Covance) and also used the crosslinker DSG (left). To further validate the peaks within chromosome arms, we performed quantitative ChIP–seq in the HP1-KD background, using λ-DNA spike-in as normalizer. The HP1 signal is strongly reduced at HP1 peaks within chromosome arms at ZGA (right). See Supplementary Methods for further details. Source data
Extended Data Fig. 2
Extended Data Fig. 2. Characterization of HP1 binding within A- and B-compartment.
a, Hi-C contact maps with contact frequencies of chromosome 3L (7–15 Mb) at a resolution of 40 kb. Four out of seven biological replicates are shown. b, Representative example of HP1 binding in a B-compartment region. c, Representative example of HP1 binding in an A-compartment region. d, Extended characterization of HP1 binding in A-compartment regions. The heat maps show ChIP–seq signal and repeat coordinates in ±10 kb centred around HP1 peaks. Figure 2d shows only cluster 2 containing HP1 peaks that localize within non-repetitive, active regulatory sequences enriched in H3K9ac, H3K27ac, H3K4me1/3 as well as polymerase II. We validated this cluster in active regions by performing ChIP–seq with different antibodies against HP1 (HA antibody against a Flag-HA-HP1-tagged transgene (second heat map) and HP1 Covance antibody (third heat map)). We further performed ChIP–seq in HP1-KD embryos using λ-DNA spike-in to normalize the signal and found a strong reduction of HP1 binding. This further validates the specificity of the HP1 peaks. See Supplementary Methods for further information. A second cluster of HP1 binding events (cluster 1) occurs in repetitive chromatin regions that are largely devoid of active histone modification marks. Source data
Extended Data Fig. 3
Extended Data Fig. 3. Characterization of HP1 knockdown and its effect on 3D genome organization.
a, Schematic of the mode of action of the RNA interference (RNAi) knockdown. shRNA against HP1 is expressed only at late stages of oogenesis and does not interfere with the production of fertilized embryos. The resulting early embryo is devoid of maternally loaded mRNA and protein. The bottom part shows the two knockdowns and embryo collection strategy. b, Western blot showing reduction of HP1 protein in early embryos after shRNA-mediated knockdown. shRNA#1 was used to perform the Hi-C experiments and generated embryos carrying residual HP1; shRNA#2 completely depleted HP1 proteins. Rbp3, H3 and Ponceau staining were used as loading controls. Representative of two independent experiments. For western blot source data, see Supplementary Fig. 1. c, Following the use of shRNA#1, between 5% and 10% of the embryos reach ZGA, therefore allowing the study of 3D chromatin conformation. shRNA#2 blocked embryonic development at the first or second mitotic division, with 0% embryos reaching ZGA, therefore preventing the study of the 3D chromatin conformation establishment. Data are mean ± s.d. Number of biological replicates: 3 for control; 3 for HP1-KD shRNA#1; 3 for HP1-KD shRNA#2. d, Both shRNA#1 and shRNA#2 are specific towards HP1 depletion as both can be rescued by a Flag–HA-tagged HP1-rescue construct (Extended Data Fig. 4a). Data are mean ± s.d. Number of biological replicates: 6 for control; 7 for HP1-KD shRNA#1; shRNA#3 for HP1-KD shRNA#2. e, Box plot showing reduction of the HP1 ChIP–seq signal in HP1-KD embryos at zygotic genome activation on HP1 peaks at pericentromeric (PC) regions (left) and on HP1-peaks along the chromosome (Chr) arms (right). The signal is overall more reduced within pericentromeric regions compared to peaks along the chromosome arms. For comparison, quantitative ChIP–seq data using spike-in normalization have been used. See Supplementary Methods for definition of the pericentromeric regions. Box plots are as in Fig. 1d. f, Quantitative PCR (qPCR) measuring the upregulation of the telomeric repeat element Het-A caused by HP1-KD. The overexpression of Het-A can be rescued by the introduction of a HP1-rescue construct, that cannot be targeted by the hairpin. Data are mean ± s.d. Number of biological replicates: n = 4 for control; n = 4 for HP1-KD; 3 for HP1-rescue. g, Genome-wide Hi-C contact maps of control (left, 7 replicates) and HP1-KD (right, 5 replicates) embryos. h, Hi-C contact map in control (top) and HP1-KD (bottom) embryos across chromosome 2R 6–25 Mb at a resolution of 120 kb. Five biological replicates are shown. i, Hi-C contact enrichment in control (top) and HP1-KD (bottom) embryos, sorted by compartment score showing strong decrease in B-compartment contacts and gain in in A/B intermingling upon depletion of HP1. Quantification of the enrichment in compartment interactions is indicated in the respective corner of the plot. See Supplementary Methods for further details. j, Differential Hi-C contact enrichment in HP1-KD versus control Hi-C maps, sorted by compartment score for all individual replicates used in the study (top) and the individual chromosome arms (bottom), confirming the consistency of the phenotype across replicates and chromosome arms. k, Hi-C contact maps in control (left) and HP1-KD (right) embryos showing the inter-arm interactions (3L 2640000–14160000 and 3R 15840000–27240000) of chromosome 3 (left) as well as inter-chromosome interactions between chromosome 2L (6000000–17880000) and chromosome 3R (6600000-23760000). In both cases, contacts and compartmentalization are strongly reduced after HP1 knockdown. l, Scatter plot of compartment scores (first eigenvector values at 10-kb resolution) in control and HP1-KD embryos (Spearman correlation 0.85), indicating the complete absence of compartment switches between control and HP1-KD embryos. m, Hi-C contact map across a 1-Mb region on chr3L, showing decreased insulation across topologically associating domains in HP1-KD embryos. n, Insulation scores in ±100 kb surrounding TAD boundaries (Supplementary Methods) showing decreased insulation after HP1 depletion. o, Differential Hi-C contact enrichment in HP1-KD versus control Hi-C maps, sorted by compartment score for regions further apart than 500 kb (left) and regions further apart than 3 Mb (right). B-compartment contacts are also decreased at distances that exceed typical TAD sizes in Drosophila, which confirms that the moderately decreased insulation cannot account for the loss of B-compartment interactions. Source data
Extended Data Fig. 4
Extended Data Fig. 4. Characterization of HP1 rescue, transcriptomic changes after HP1 knockdown and its effect on 3D genome organization in differentiated S2 cells.
a, Western blot showing the expression of the Flag-HA-tagged HP1 transgene in the background of control and HP1-KD embryos. Rpd3, tubulin and Ponceau were used as loading controls. After depletion of endogenous HP1, the expression of the transgene is increased. Blots are representative of two independent experiments. For western blot source data, see Supplementary Fig. 1. b, Genome-wide Hi-C contact maps in control (left) and HP1-rescue (right) embryos (40-kb resolution). The HP1-rescue and HP1-KD embryos show an inversion on chromosome 2L. c, Genome-wide differential Hi-C contact maps (log2-transformed fold change) in HP1-rescue versus control embryos. The HP1-rescue construct reverses the structural effects of HP1-KD (reduced contact frequency between the pericentromeric regions, as well as inter-chromosome arm interactions and compaction defects). d, Same genomic region as in Fig. 3c, d, with control and HP1-KD embryos expressing HP1-rescue. e, Left, MA plot illustrating differential expression of genes at zygotic genome activation in HP1-KD versus control embryos. In total, we detected 359 differentially expressed genes using RNA-seq (red dots) (Supplementary Methods) (of the total 277 genes are in A-compartment, 72 genes are in the B-compartment regions and 10 genes are on chrUn_CP007120v1). Right, MA plot showing the differential expression of types of repeat. We detected 15 differentially expressed repeat types, highlighted in the plot (Supplementary Methods). f, Box plot showing the distribution of gene expression changes within A- and B-compartments. We did not detect any differences in the distribution of gene expression changes in A- and B-compartments either considering all genes (left, P = 0.95, one-sided Wilcoxon test) or only significant differentially expressed genes (right, P = 0.95, one-sided Wilcoxon test). Box plots are as in Fig. 1d; outliers not shown. g, Expression of a panel of 17 purely zygotically expressed transcription factors in control and HP1-knockdown embryos. In unfertilized eggs all factors are not expressed and become upregulated at zygotic genome activation. The expression of the zygotic transcription factors confirms that HP1-KD embryos undergo zygotic genome activation. Each dot represents the normalized counts for a given transcription factor of a replicate RNA sequencing (RNA-seq) experiment. h, Immunofluorescence staining of control and HP1-KD embryos at zygotic genome activation with the mitosis marker H3S10 phosphorylated. Until the cellular blastoderm stage (ZGA), all nuclei undergo mitosis synchronously and then enter G2 phase at ZGA. The ratio of mitotic cells and the timing of mitosis is not altered in HP1-KD embryos. Scale bar, 50 μm. As a control for antibody specificity, an earlier stage of embryogenesis (before ZGA) was stained showing a strong H3S10phospho signal after synchronous entry into mitosis (right). Representative images from three biological replicates. Scale bar, 10 μm. i, Western blot showing the reduction of HP1 after treatment with double-stranded RNA (dsRNA) treatment in S2 cells (cell culture cells derived from a primary culture of late-stage (20–24 h old) Drosophila embryos, probably from a macrophage-like lineage). Rpd3, tubulin and Ponceau were used as loading controls. To control for unspecific effects of the dsRNA treatment, control cells were treated with a dsRNA against glutathione S-transferases (GST) and two different dsRNAs were used to deplete HP1. Representative of two independent experiments. For western blot source data, see Supplementary Fig. 1. See Supplementary Methods for further details. j, qPCR analysis showing the reduction of HP1 mRNA after dsRNA treatment in S2 cells. The signal is relative to rp49. To control for unspecific effects of the dsRNA treatment, control cells were treated with a dsRNA against GST and two different dsRNAs were used to deplete HP1. See Supplementary Methods for further details. Data are mean of two independent experiments. k, Hi-C contact enrichment in control (left) and HP1-KD (right) in S2 cells, sorted by compartment score, showing no decrease in B-compartment contacts after depletion of HP1 with either dsRNA. This indicates that HP1 is required for the establishment of the B-compartment during early embryonic development but does not affect the maintenance of compartmentalization in late differentiated cells. l, Hi-C contact frequencies of a 19-Mb region on chromosome 3L at a resolution of 120 kb. Pooled Hi-C data of two biological replicates are shown. m, Genome-wide Hi-C contact map in control S2 cells (120-kb resolution). n, Genome wide differential Hi-C contact maps (log2-transformed fold change) in HP1-KD versus control S2 cells. The differential contact maps show the HP1-KD with two independent shRNA on the left and right, respectively. o, Contact probabilities over the genomic distance of control and HP1-KD S2 cells. The contact probability of the HP1-KD cells closely resembles the control. Pericentromeric regions were excluded from the analysis of contact probabilities (Supplementary Methods). Source data
Extended Data Fig. 5
Extended Data Fig. 5. Characterization of H3K9M.
a, Immunofluorescence staining of embryos at ZGA showing that H3K9me2 is completely lost after expression of the H3K9M mutant. H3K9M depletes H3K9me2/3 from chromatin, and acts as a competitive inhibitor of the histone methyltransferases. Representative image from three biological replicates. Scale bar, 20 μm. b, Box plot showing the reduction of the HP1 ChIP–seq signal over the control embryos at ZGA at HP1 peaks in HP1-KD (green) and H3K9M (red) embryos. The signal is reduced overall in HP1-KD embryos, with more loss in the pericentromeric region (left) compared to chromosome arms (right). For comparison, quantitative ChIP–seq data using spike-in normalization has been used. Box plots are as in Fig. 1d. c, Characterization of HP1 binding in B-compartment regions after HP1 knockdown (left) and H3K9M overexpression (right). Heat maps of HP1 ChIP–seq signals are ±10 kb centred on HP1 peaks and show that HP1 is retained at a higher level in H3K9M embryos compared to the HP1-KD embryos. Spike-in normalization has been used to quantify the enrichment. d, As in c, but in A-compartment regions. e, Characterization of HP1 binding in ovaries. Left, binding of a control HP1–Flag-HA-tagged transgene. Middle, binding of a Flag-HA-tagged chromodomain mutant of HP1 (HP1-CD) that cannot bind to H3K9me2/3. Right, the enrichment of H3K9me3 in ovaries. The heat maps of HP1 ChIP–seq signals are ± 10 kb centred on HP1 peaks called in the HP1 chromodomain mutant. f, Genome-wide Hi-C contact maps in control (left) and H3K9M (middle) embryos (120-kb resolution, pooled Hi-C data of two biological replicates). Right, differential Hi-C contact map (log2-transformed fold change in HP1-KD versus H3K9M), highlighting milder compaction within arms in H3K9M with respect to HP1-KD. g, H3K9M shows decay of contact probability similar to control embryos within arms. This suggests that compaction in the H3K9M mutant is milder than in HP1-KD embryos. h, Hi-C contact maps on chr2R (6–25 Mb) in control and H3K9M embryos (120-kb resolution). i, Hi-C contact enrichment in H3K9M (left) and differential Hi-C contact enrichment in H3K9M versus control (right) in embryos, sorted by compartment score showing no decrease in B-compartment contacts upon H3K9M expression. j, Differential Hi-C contact enrichment in HP1-KD versus H3K9M Hi-C maps, sorted by compartment score. B-compartment interactions are more strongly decreased in HP1-KD embryos than in H3K9M embryos. Source data
Extended Data Fig. 6
Extended Data Fig. 6. Genome-wide simulations show that loss of HP1 at pericentromeric regions does not cause the phenotype within chromosome arms.
a, Snapshots of control (left) and mutant (decreased interactions between C-type beads and between C-type beads and the nuclear envelope, right) simulations, reproducing the experimental scaling and compartment strength. Colour code as in Fig. 4a. b, Scaling of contact probabilities in experimental and simulated contact maps. c, Simulated and experimental compartment strength. P values determined by two-sided Wilcoxon test. d, Scaling of contact probabilities in experimental HP1-KD and simulated control embryos and mutant contact maps. No differences between simulated control and mutant are detected. e, Experimental compartment strength in HP1-KD and simulated compartment strength in control and mutant samples. No differences between simulated control and mutant are detected. P values determined by two-sided Wilcoxon test. f, Snapshots of the control simulations with different amounts of C-type beads (30% and 50%). A single full chromosome is highlighted in each snapshot. g, Scaling of contact probabilities in experimental and simulated contact maps with different amounts of C-type beads. h, Experimental and simulated compartment strength with different amounts of C-type beads. i, Snapshots of the simulations with decreased interactions between C-type beads and their interaction with nuclear surface. A single chromosome is highlighted in each snapshot. Different amounts of C-type beads (30% and 50% of the total number of beads) are shown. j, Genome-wide simulated distance maps of control (left) and mutant samples with decreased interaction within and between C-type beads and their interaction with nuclear surface (middle). Differential distance map (log2-transformed fold change in mutant versus control) highlighting increased distance within and between centromeric and telomeric regions (right). Different amounts of C-type beads (30% and 50% of the total number of beads) are shown. k, Scaling of contact probabilities in experimental HP1-KD and simulated control and mutant contact maps with different amounts of C-type beads. No differences between simulated control and mutants are detected. l, Experimental compartment strength in HP1-KD and simulated compartment strength in mutants with different amounts of C-type beads. No differences between the simulated mutants are detected. Box plots are as in Fig. 1d. Source data
Extended Data Fig. 7
Extended Data Fig. 7. HP1-KD phenotype is driven by two independent mechanisms, both mediated by HP1.
a, Scaling of contact probabilities in experimental and simulated contact maps shown in Fig. 4e. b, Inferred interaction energies between pairs of beads are overall attractive, with interactions between B-compartment beads being more attractive than interactions between A–A and A–B beads. Simulated region: chr3R 17–20.6 Mb. c, Scaling of contact probabilities in experimental and simulated Hi-C maps, compared to the scaling in the experimental control Hi-C heat map as a reference. Simulated region: chr3R 17–20.6 Mb. d, Simulated and experimental compartment strength (chr3R 17–20.6 Mb). e, Experimental and simulated contact maps of control embryos. Simulated region: chr3R 25.4–29 Mb. f, Scaling of contact probabilities in experimental and simulated contact maps shown in e. g, Inferred interaction energies between pairs of beads are overall attractive, with attractions between B-compartment beads being more attractive than interactions between A–A and A–B beads. Simulated region: chr3R 25.4–29 Mb. h, Experimental and simulated HP1-KD contact maps in the same region as in e. i, Scaling of contact probabilities in experimental and simulated Hi-C maps, compared to the scaling in the experimental control. Simulated region: chr3R 25.4–29 Mb. j, Simulated and experimental compartment strength in the same chr3R region. Simulated region: chr3R 25.4–29 Mb. k, Inferred interaction energies are overall more attractive in the HP1-KD model. P value determined by two-sided Wilcoxon test. Simulated region: chr3R 25.4–29 Mb. l, Left, interaction energies between B-compartment type beads become comparatively less attractive, whereas interactions between A-type compartment beads and between A- and B-type beads become more attractive. Data are mean and s.e.m. across each interaction energy class (number of interactions: 465 for A–A; 1,858 for A–B; and 1,769 for B–B). Right, average changes in inferred interaction energies between HP1-KD and the control models, classified according to whether they are within or across A- and B-compartment regions. Attractions between B-compartment regions are decreased in the HP1-KD model. Data are mean and s.e.m. across each interaction energy class (number of interactions: 465 for A–A; 1,858 for A–B; and 1,769 for B–B). Average changes in inferred interaction energies between HP1-KD and the control models, irrespective of being within or across A- and B-compartment regions, are set to zero. Interaction energies between B-compartment type beads become less attractive, whereas energies between A-type compartment beads and between A and B become more attractive. m, Example of the simulated contact maps for different levels of compartment strength, corresponding to different energy rescaling factors (i, ii and iii, as in Fig. 4j). Arrangement of A and B beads based on: chr3R 17–20.6 Mb. n, Same plot as in Fig. 4i, j, when only attractions between B-compartment regions are decreased. Mean (bold line) with the confidence interval (shaded area) calculated using t-based approximation is shown. Arrangement of A and B beads based on: chr3R 17–20.6 Mb. o, Scaling exponents in simulated contact maps are plotted against increasing or decreasing (by a multiplicative scaling factor) A–A, A–B and B–B attractive interaction. The scaling exponent increases when increasing attractions between all beads and vice versa. Arrangement of A and B beads based on chr3R 25.4–29 Mb. p, Compartment strength in simulated contact maps decreases upon increase in attractions between all types of bead, and vice versa. Mean (bold line) with the confidence interval (shaded area) calculated using t-based approximation is shown. Arrangement of A and B beads based on chr3R 25.4–29 Mb. q, Example of the simulated contact maps for different levels of compartment strength, corresponding to different energy rescaling factors. Arrangement of A and B beads based on chr3R 25.4–29 Mb. r, As in o and p, when only attractions between B-compartment regions are decreased. Mean (bold line) with the confidence interval (shaded area) calculated using t-based approximation is shown. Arrangement of A and B beads based on chr3R 25.4–29 Mb. s, Proposed model in which chromatin-bound HP1 mediates B–B attractions. A–A attractions independent of HP1 promote establishment of the A-compartment. Depletion of HP1 causes pericentromeric region declustering and increased chromosome arm compaction. B–B interactions are reduced, leading to an overall increase in A–A and A–B attractive energies (Supplementary Methods, Extended Data Fig. 6). Box plots are as in Fig. 1d; outliers not shown in k. Source data

References

    1. Falk M, et al. Heterochromatin drives compartmentalization of inverted and conventional nuclei. Nature. 2019;570:395–399. doi: 10.1038/s41586-019-1275-3. - DOI - PMC - PubMed
    1. Hildebrand EM, Dekker J. Mechanisms and functions of chromosome compartmentalization. Trends Biochem. Sci. 2020;45:385–396. doi: 10.1016/j.tibs.2020.01.002. - DOI - PMC - PubMed
    1. Marshall WF, Dernburg AF, Harmon B, Agard DA, Sedat JW. Specific interactions of chromatin with the nuclear envelope: positional determination within the nucleus in Drosophila melanogaster. Mol. Biol. Cell. 1996;7:825–842. doi: 10.1091/mbc.7.5.825. - DOI - PMC - PubMed
    1. Merico V, et al. Epigenomic differentiation in mouse preimplantation nuclei of biparental, parthenote and cloned embryos. Chromosome Res. 2007;15:341–360. - PubMed
    1. Hug CB, Grimaldi AG, Kruse K, Vaquerizas JM. Chromatin architecture emerges during zygotic genome activation independent of transcription. Cell. 2017;169:216–228. doi: 10.1016/j.cell.2017.03.024. - DOI - PubMed

Publication types

MeSH terms

Substances