. 2021 Apr;592(7856):794-798.
doi: 10.1038/s41586-021-03474-7. Epub 2021 Apr 14.

The AMBRA1 E3 ligase adaptor regulates the stability of cyclin D

Affiliations

The AMBRA1 E3 ligase adaptor regulates the stability of cyclin D

Andrea C Chaikovsky et al. Nature. 2021 Apr.

Abstract

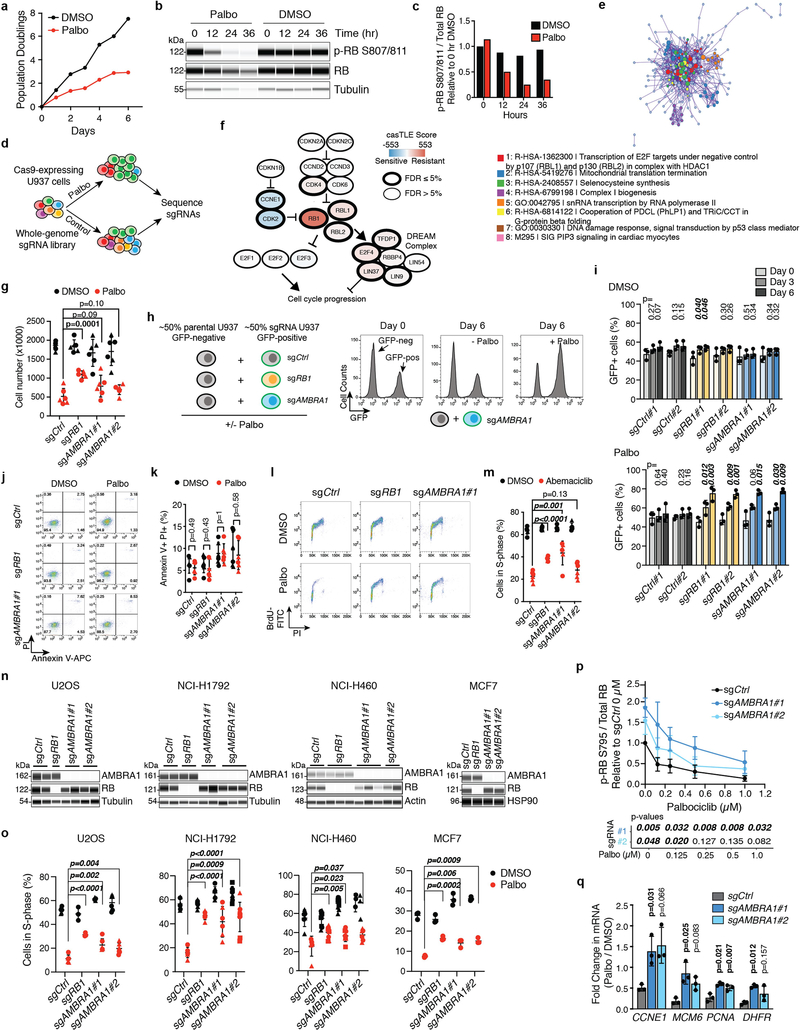
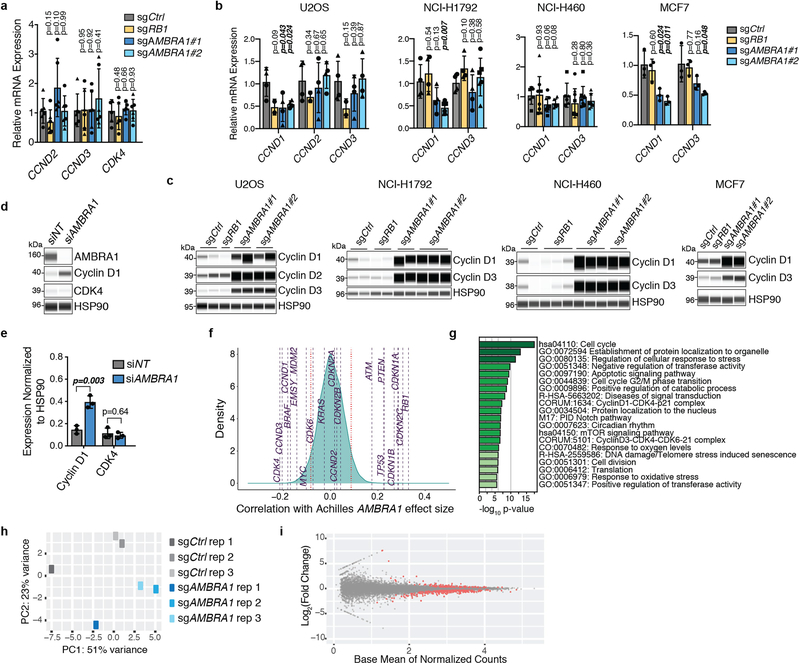
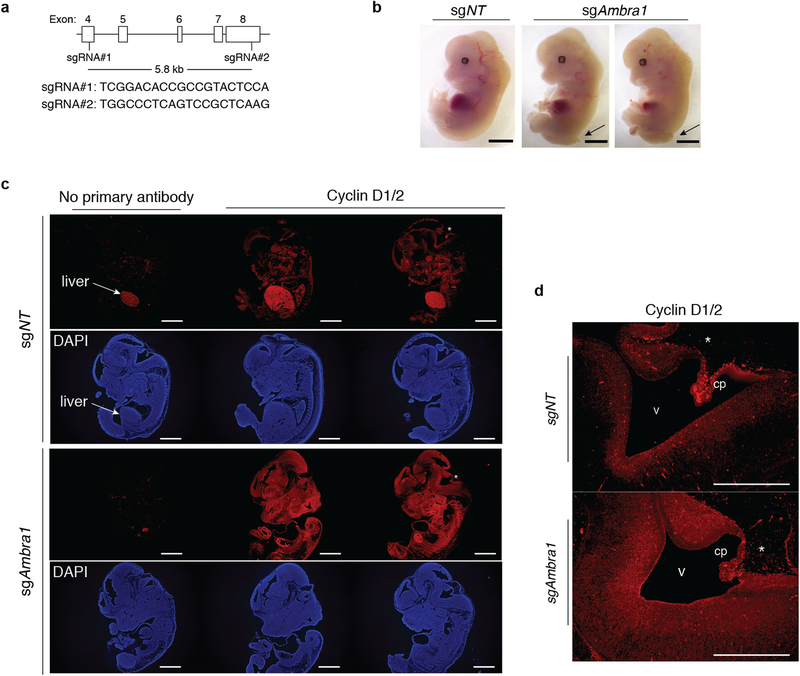
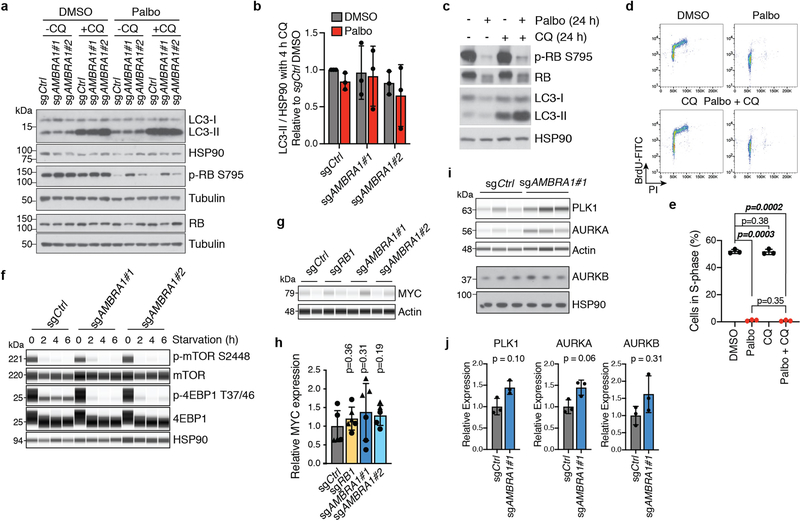
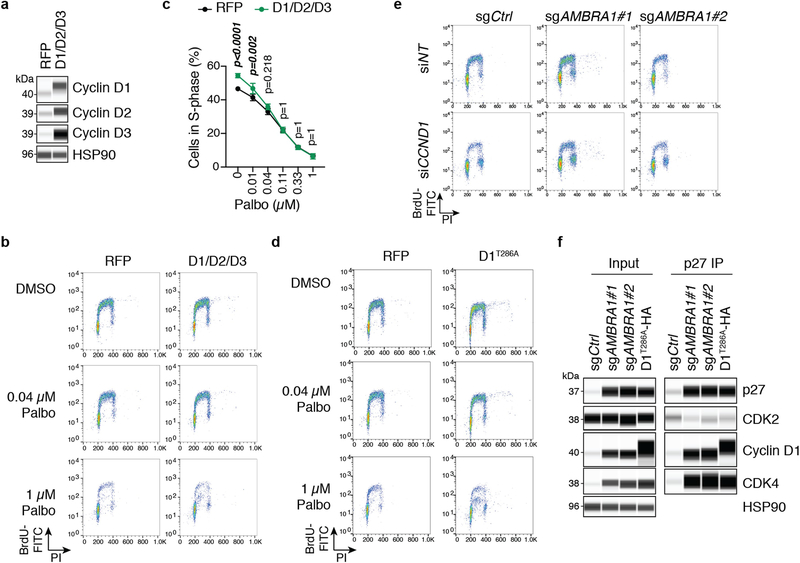
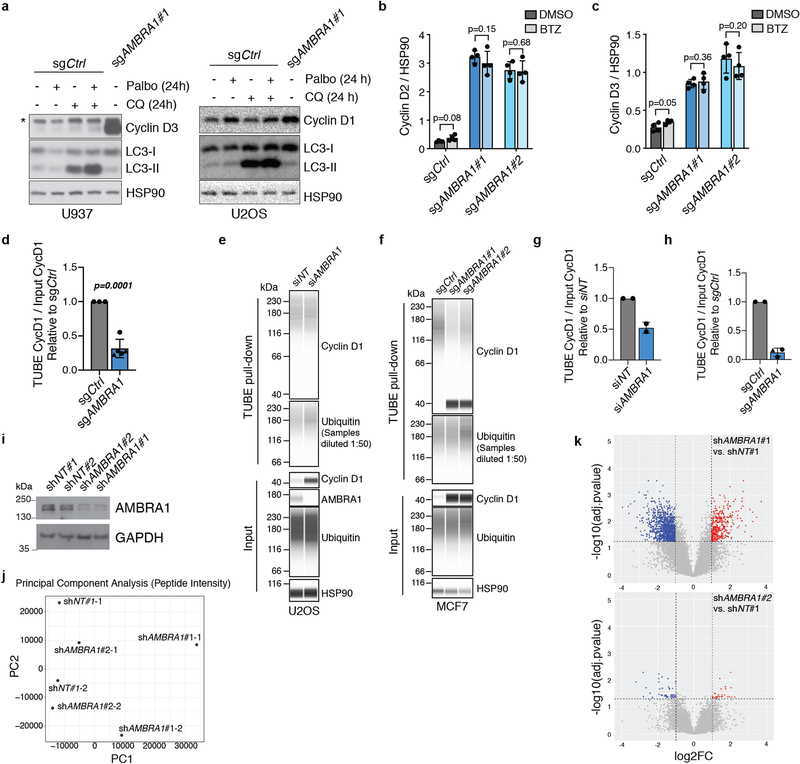
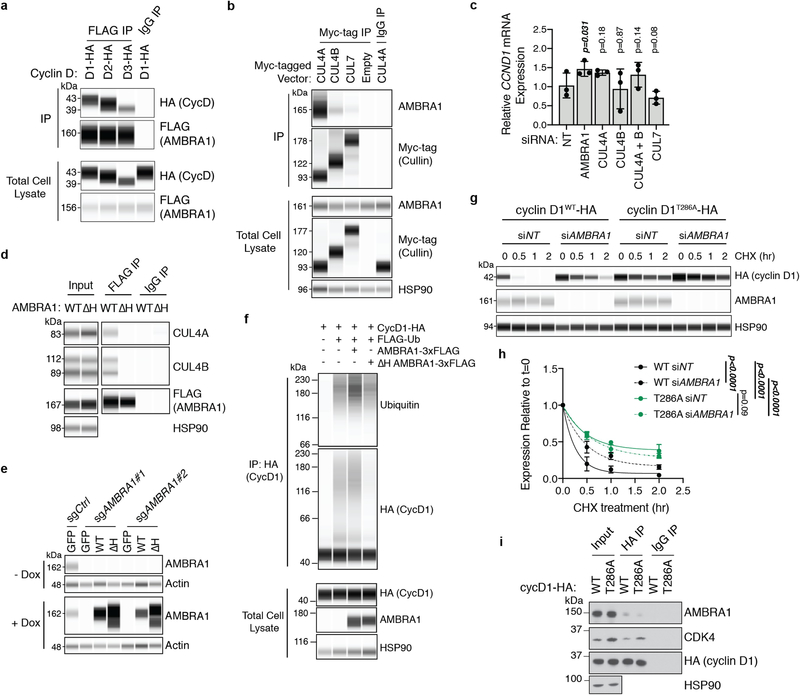
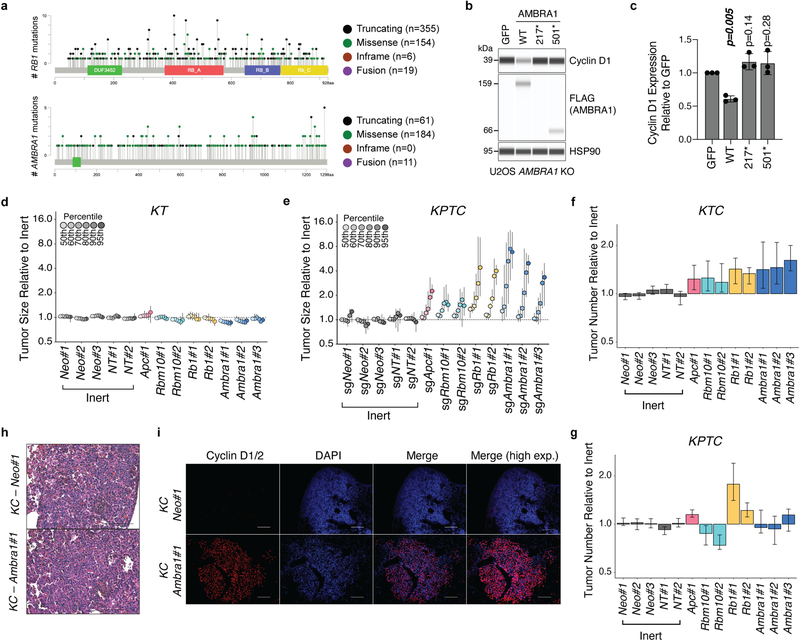
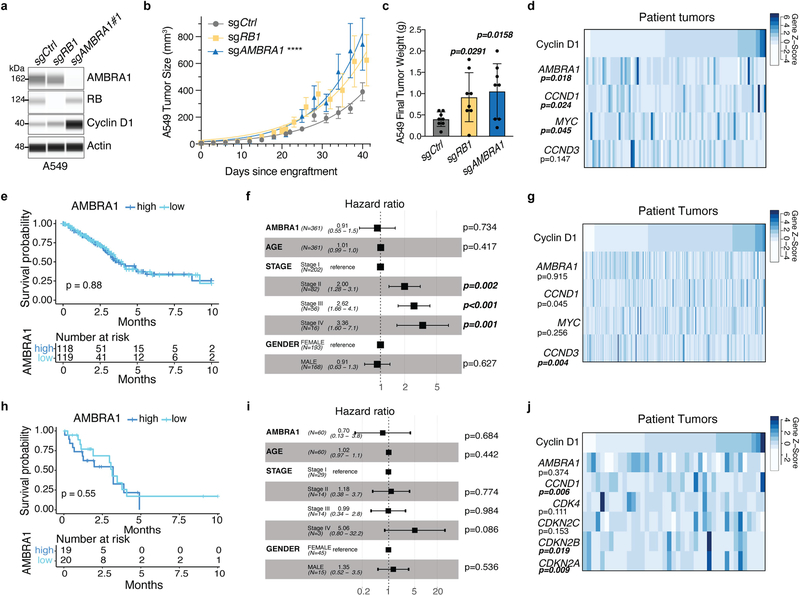
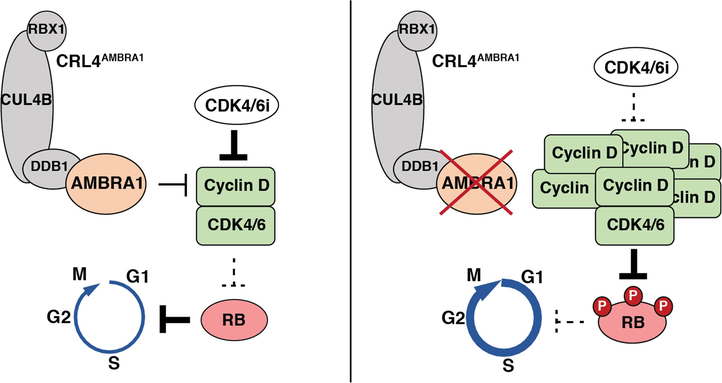
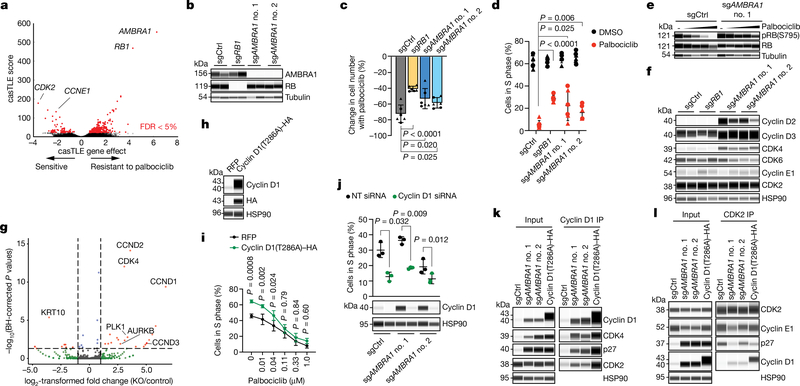
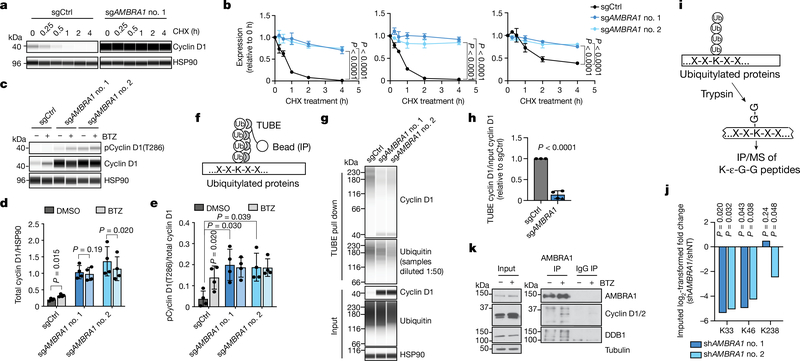
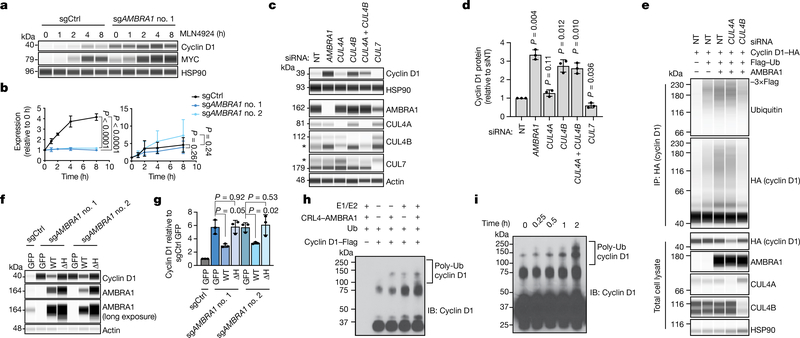
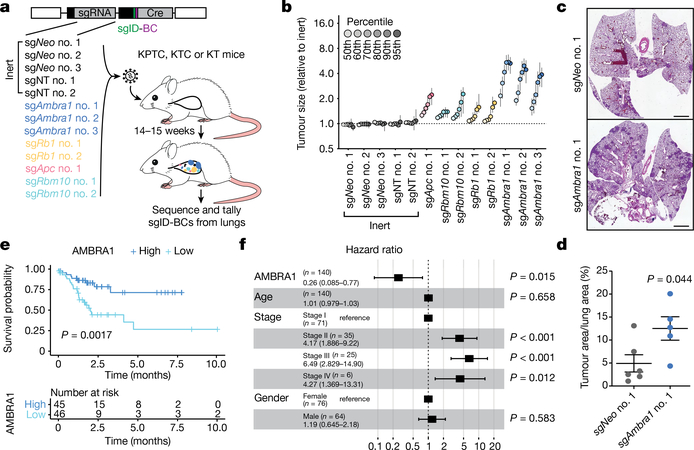
The initiation of cell division integrates a large number of intra- and extracellular inputs. D-type cyclins (hereafter, cyclin D) couple these inputs to the initiation of DNA replication1. Increased levels of cyclin D promote cell division by activating cyclin-dependent kinases 4 and 6 (hereafter, CDK4/6), which in turn phosphorylate and inactivate the retinoblastoma tumour suppressor. Accordingly, increased levels and activity of cyclin D-CDK4/6 complexes are strongly linked to unchecked cell proliferation and cancer2,3. However, the mechanisms that regulate levels of cyclin D are incompletely understood4,5. Here we show that autophagy and beclin 1 regulator 1 (AMBRA1) is the main regulator of the degradation of cyclin D. We identified AMBRA1 in a genome-wide screen to investigate the genetic basis of the response to CDK4/6 inhibition. Loss of AMBRA1 results in high levels of cyclin D in cells and in mice, which promotes proliferation and decreases sensitivity to CDK4/6 inhibition. Mechanistically, AMBRA1 mediates ubiquitylation and proteasomal degradation of cyclin D as a substrate receptor for the cullin 4 E3 ligase complex. Loss of AMBRA1 enhances the growth of lung adenocarcinoma in a mouse model, and low levels of AMBRA1 correlate with worse survival in patients with lung adenocarcinoma. Thus, AMBRA1 regulates cellular levels of cyclin D, and contributes to cancer development and the response of cancer cells to CDK4/6 inhibitors.


Figures

Extended Data Fig. 1 |
Extended Data Fig. 1 |. Identification of AMBRA1 and other factors involved in the response of cells to CDK4/6 inhibitors.
a, Proliferation of U937 cells in the presence of 0.5 μM palbociclib (palbo) over 6 d, determined by cell counting (n = 1 experiment). b, Immunoassay of total RB and RB phosphorylated at S807 and S811 (p-RB S807/811) in U937 cells over 36 h of palbociclib treatment. c, Quantification of phosphorylated RB relative to total RB from b (n = 1 experiment). d, Schematic of the CRISPR-Cas9 screen in U937 cells. e, Protein–protein interaction map of screen results, generated using Metascape. Coloured nodes represent densely connected gene neighbourhoods. Legend indicates the gene ontology term that is most significantly enriched within each neighbourhood. Node size indicates the degree of connectedness. Gene names can be found in Supplementary Table 3. f, Schematic of the screen results among RB-pathway genes expressed in U937 cells. g, Number of control and knockout U937 cells treated with 0.5 μM palbociclib or DMSO control for 48 h. Each symbol is an isogenic clone (n = 3 biological replicates per clone). h, Left, schematic of the competition assay between GFP-negative parental U937 cells and GFP-positive knockout cell populations. Right, example of flow cytometry analysis for one experiment with AMBRA1-knockout cells. i, Percentage of GFP-positive control or knockout populations in competition assays as in h (n = 3 biological replicates). j, Representative flow cytometry plots of annexin V and propidium iodide (PI) staining in U937 cells treated with 0.5 μM palbociclib for 24 h. k, Percentage of apoptotic (annexinV+PI+) U937 cells after a 24-h palbociclib treatment (n = 3 biological replicates per clone). Palbociclib does not induce apoptosis in any genotype. l, Representative flow cytometry plots of BrdU and PI staining in U937 cells treated with 0.5 μM palbociclib for 24 h. m, Percentage of S-phase cells by BrdU and PI staining in U937 cells treated with 1 μM abemaciclib for 24 h (n = 3 biological replicates per clone). n, Immunoassay for AMBRA1 and RB in control and knockout cancer cell lines generated by CRISPR–Cas9. For U2OS (osteosarcoma), NCI-H1792 (lung adenocarcinoma) and NCI-H460 (large cell lung cancer), each lane is an isogenic clone. MCF7 cells (breast cancer) are populations. o, Percentage of cycling S-phase cells from n after a 24-h treatment with palbociclib (0.5 μM for all cell lines except for MCF7 cells, 0.04 μM). U2OS, NCI-H1792 and NCI-H460 cells were analysed by BrdU and PI staining, and each symbol is an isogenic clone (n = 3 biological replicates per clone). MCF7 cells were analysed by PI staining (n = 3 biological replicates). p, Quantification of RB phosphorylated at S795 (p-RB S795) over total RB in U937 cells treated with increasing doses of palbociclib for 24 h, measured by immunoassay (n = 4 biological replicates). q, Fold-change in mRNA levels of E2F target genes in U937 cells treated with 0.5 μM palbociclib for 24 h, measured by quantitative PCR with reverse transcription (RT–qPCR) (n = 3 biological replicates). All data are mean ± s.d. P values calculated by two-sided unpaired t-test (g, k, m, o) and two-sided paired t-test (i, p, q). Tubulin, HSP90 and actin are loading controls.
Extended Data Fig. 2 |
Extended Data Fig. 2 |. AMBRA1 loss regulates cyclin D post-transcriptionally and dependency on AMBRA1 correlates with cyclin D signalling networks.
a, b, RT–qPCR analysis of the genes encoding D-type cyclins (CCND genes) and CDK4 in U937 cells (a) (n = 3 biological replicates per clone) or expressed D-type cyclins in other cancer cell lines (b). For U2OS, NCI-H1792 and NCI-H460 cells, each symbol is an isogenic clone (n = 2 biological replicates per clone). MCF7 cells are populations (n = 3 biological replicates). P values evaluate differences between knockout cells and controls for each gene. c, Immunoassay of D-type cyclins in cancer cell lines in b. d, Immunoassay of AMBRA1, cyclin D1 and CDK4 in U2OS cells after 48 h of AMBRA1 knockdown by siRNA pools. e, Quantification of cyclin D1 and CDK4 protein levels in d (n = 3 biological replicates). f, Correlation of gene dependency scores between AMBRA1, RB pathway genes and additional cancer drivers, according to DepMap. Red lines mark the top and bottom 5% of genes. g, The 20 most significantly enriched gene ontology terms among the top 100 genes, the loss of which best correlate with loss of AMBRA1 in DepMap. h, Principal component (PC) analysis of RNA-sequencing data from U2OS cells, three biological replicates per cell line. i, Volcano plot of RNA-sequencing results comparing control and AMBRA1-knockout U2OS cells. Significantly differentially expressed genes (P < 0.01) are in red. All data shown as mean ± s.d. P values calculated by two-sided unpaired t-test (a, b), two-sided paired t-test (e), hypergeometric test (g) and Wald test (i).
Extended Data Fig. 3 |
Extended Data Fig. 3 |. AMBRA1 deletion in mouse embryos results in increased cyclin D levels.
a, sgRNA design to knockout Ambra1 in mouse zygotes by microinjection of sgRNAs and Cas9. Controls were injected with a non-targeting sgRNA. b, Representative bright-field images of control (n = 5) and mutant (n = 3) embryos at embryonic day (E)13.5. Similar to previous reports, the Ambra1-mutant embryos generated here have neural tube defects with midbrain and hindbrain exencephaly and/or spina bifida (arrows). Scale bar, 2 mm. c, Representative cyclin D immunofluorescence (red signal, the antibody recognizes cyclin D1 and cyclin D2) in control and Ambral-mutant E13.5 embryos (from n = 3 embryos per sgRNA). DAPI shows DNA. The liver is autofluorescent. Scale bar, 1 mm. d, High-magnification view of the developing brain from one control and one Ambra1-mutant embryo (asterisks in c). v, ventricle, cp, choroid plexus. Scale bar, 500 μm. Representative of three embryos per sgRNA.
Extended Data Fig. 4 |
Extended Data Fig. 4 |. Pathways previously associated with AMBRA1 do not explain tolerance to CDK4/6 inhibitors.
a, Immunoblot analysis of autophagy flux by LC3 conversion (LC3-I to LC3-II, which occurs during autophagosome formation) and RB phosphorylation (p-RB S795) in U937 cells treated with 0.5 μM palbociclib for 24 h and acutely treated with 25 μM chloroquine (CQ) (an autophagy inhibitor) for the final 4 h. b, Quantification of LC3-II levels with 4 h of chloroquine treatment, indicating autophagy flux, from cells in a (n = 3 biological replicates). No significant differences were identified by two-way ANOVA (Pcell line = 0.44, Ptreatment = 0.38, Pinteraction = 0.92). c, Immunoblot of total and phosphorylated RB and LC3 conversion in wild-type U937 cells treated with 0.5 μM palbociclib, 25 μM chloroquine or both for 24 h. Representative of three independent experiments. d, Representative flow cytometry plots of BrdU and PI staining in cells from c. e, Quantification of S-phase cells from d (n = 3 biological replicates). Autophagy inhibition does not alter palbociclib response. f, Immunoassay of the mTORC1 target phosphorylation sites (S2448 of mTOR, and T37 and T46 of 4EBP1) in U937 cells following amino acid starvation. Representative of two independent experiments. g, Immunoassay of MYC in U937 clones. h, Quantification of MYC from g. Each symbol is an isogenic clone (n = 3 biological replicates per clone). i, Immunoassay of PLK1 and AURKA and immunoblot of AURKB in control and AMBRA1-knockout U2OS cells. Each lane is a biological replicate. j, Quantification of i (n = 3 biological replicates). All data are mean ± s.d. P values calculated by two-way ANOVA (b), two-sided paired t-test (e, j), and two-sided unpaired t-test (h). HSP90, tubulin and actin are loading controls.
Extended Data Fig. 5 |
Extended Data Fig. 5 |. Cyclin D mediates the phenotypes of AMBRA1- mutant cells.
a, Immunoassay of cyclin D1, D2, and D3 in wild-type U2OS cells overexpressing all three D-type cyclins from the same lentiviral vector or RFP as a control. b, Representative flow cytometry plots of BrdU and PI staining in cells from a treated with increasing doses of palbociclib for 24 h. c, Percentage of cycling S-phase cells from b (n = 3 biological replicates). Data are mean ± s.d. P values calculated by two-way ANOVA (Pcell line < 0.0001) with post hoc Sidak test. d, Representative flow cytometry plots of BrdU and PI staining in U2OS cells overexpressing stabilized cyclin D1(T286A)–HA or RFP control, treated with increasing doses of palbociclib for 24 h. e, Representative flow cytometry plots of BrdU and PI staining in control and AMBRA1-knockout U2OS clones after 48 h of cyclin D1 (CCND1) knockdown with siRNA pools. f, Co-immunoprecipitation of p27 in control, knockout and cyclin-D1(T286A)-overexpressing U2OS cells, and immunoassay of relevant protein complexes (n = 2 biological replicates). HSP90 is a loading control.
Extended Data Fig. 6 |
Extended Data Fig. 6 |. AMBRA1 regulates the ubiquitylation of D-type cyclins.
a, Immunoblot analysis of cyclin D3 in wild-type U937 cells (left) or cyclin D1 in wild-type U2OS cells (right) treated with 0.5 μM palbociclib, 25 μM chloroquine or both for 24 h. LC3 and HSP90 blots for U937 cells are the same as in Extended Data Fig. 4c, as the experiments were performed simultaneously. Untreated AMBRA1-knockout cells serve as a control for increased cyclin D expression. Asterisk, unspecific band. n = 3 (U937) or n = 1 (U2OS) biological replicates. b, c, Immunoassay quantification of cyclin D2 (b) and cyclin D3 (c) in U2OS cells treated with 1 μM bortezomib for 4 h (n = 4 biological replicates). d, Quantification of ubiquitylated cyclin D1 relative to total cyclin D1 isolated from U2OS clones pretreated with 1 μM bortezomib for 4 h using TUBEs. Each symbol is an isogenic clone (n = 3 (sgCtrl) or n = 5 (sgAMBRA1)). e, f, Immunoassay of ubiquitylated cyclin D1 isolated using TUBEs following AMBRA1 knockdown in U2OS cells (e) or in populations of control and AMBRA1-knockout MCF7 cells (f). g, h, Quantification of ubiquitylated cyclin D1 relative to total cyclin D1 in AMBRA1-knockdown U2OS cells (g) (n = 2 biological replicates) or AMBRA1-knockout MCF7 cells (h) (n = 2 (sgCtrl) or n = 3 (sgAMBRA1) biological replicates) as shown in e, f, respectively. For all TUBE experiments, only quantification of samples with similar levels of ubiquitin pull down are shown. See Supplementary Table 9 for all data. i, Immunoblot analysis of AMBRA1 in 293T cells expressing control or AMBRA1-targeting shRNAs, pretreated with 10 μM MG132 for 4 h. (n = 1 experiment). j, Principal component analysis of mass spectrometry data from cells in i (two replicates each of shNT no. 1 and shAMBRA1 no. 1 and no. 2) after enriching for ubiquitylated peptides. k, Volcano plot of mass-spectrometry data comparing ubiquitylated peptides in control and AMBRA1 knockdown 293T cells. Each dot is a peptide. Red symbols, significantly upregulated peptides; blue symbols, significantly downregulated peptides, with the indicated cut-offs. All other data are mean ± s.d. P values calculated by two-sided paired t-test (b, c), two-sided unpaired t-test (d) and two-sided unpaired t-test followed by Benjamini–Hochberg correction (k). HSP90 and GAPDH are loading controls.
Extended Data Fig. 7 |
Extended Data Fig. 7 |. AMBRA1 binding to CUL4 is required for regulating cyclin D.
a, Co-immunoprecipitation of transfected AMBRA1–Myc–Flag and cyclin D–HA (D1, D2 or D3) in 293T cells, analysed by immunoassay. b, Co-immunoprecipitation of transfected Myc-tagged cullin proteins with endogenous AMBRA1 in U2OS cells, analysed by immunoassay. c, RT–qPCR analysis of CCND1 mRNA expression in U2OS cells following knockdown of AMBRA1 or various cullin genes by siRNA pools (n = 3 biological replicates). d, Co-immunoprecipitation of transfected wild-type (WT) AMBRA1 and AMBRA1(ΔH) with endogenous CUL4A and CUL4B in 293T cells. e, Immunoassay of AMBRA1 in control and AMBRA1-knockout U2OS cells with doxycycline-inducible expression of wild-type AMBRA1, AMBRA1(ΔH) or GFP control, after treatment with 500 ng ml−1 doxycycline (+Dox) or DMSO (−Dox) for 2 d. f, Immunoassay of cyclin D1 ubiquitylation in 293T cells with overexpression of wild-type AMBRA1 or AMBRA1(ΔH). Cells were pretreated with 1 μM bortezomib for 3 h and lysed in denaturing conditions before immunoprecipitation of cyclin D1. Representative of two independent experiments. g, Immunoassay of cyclin D1–HA in U2OS cells expressing wild-type cyclin D1 or phosphomutant cyclin D1 (cyclin D1(T286A)) treated with 10 μg ml−1 cycloheximide for up to 2 h. Cells were transfected with control or AMBRA1-targeted siRNA pools 3 d previously. h, Quantification of cyclin D1–HA protein levels in U2OS cells from g with best-fit curves for one-phase decay (n = 3 biological replicates). i, Co-immunoprecipitation of cyclin D1–HA (wild-type or T286A) and endogenous AMBRA1 in U2OS cells. CDK4 serves as a positive control for cyclin D1 binding. Representative of two independent experiments. All data are mean ± s.d. P values calculated by two-sided paired t-test (c) and two-way ANOVA (h). HSP90 and actin are loading controls.
Extended Data Fig. 8 |
Extended Data Fig. 8 |. AMBRA1 ubiquitylates cyclin D.
a, Coomassie-blue-stained gel with protein extracts from insect Sf9 cells (−) or Sf9 cells expressing cyclin D1 and CDK4 (arrows). b, Immunoblot for cyclin D1, cyclin D1 phosphorylated on T286 (P-T286) and CDK4 in protein extracts, similar to a. c, Immunoassay of Flag and Myc tag in untransfected 293T cells (−) or 293T cells transfected with AMBRA1–3×Flag or Myc3–CUL4B. Actin is a loading control. n = 1 experiment.
Extended Data Fig. 9 |
Extended Data Fig. 9 |. AMBRA1 is a tumour suppressor in KRAS-mutant mouse lung adenocarcinoma.
a, Lollipop plot for RB1 and AMBRA1 mutations in 10,953 patients (10,967 samples) in 32 studies from TCGA (data downloaded from https://cbioportal.org in September 2020). b, Immunoassay of AMBRA1 and cyclin D1 in AMBRA1-knockout U2OS cells upon stable expression of GFP, wild-type AMBRA1 (WT) or two mutant forms of AMBRA1 from a (stop codons at the position indicated by an asterisk). HSP90 is a loading control. Expression of 217* was not detected, suggesting an unstable protein. c, Quantification of cyclin D1 in b (n = 3 biological replicates). Data are mean ± s.d. P values calculated by two-sided paired t-test. d, e, Relative tumour sizes for each sgRNA in KT mice (lacking Cas9) (d) (n = 4 mice) and KPTC mice (e) (n = 5 mice). Tumour sizes were calculated from merged data from all tumours in all mice and normalized to inert sgRNAs 15 (d) or 14 (e) weeks after cancer initiation. f, g, Tumour number for each sgRNA in KTC mice (f) (n = 9 mice) and KPTC mice (g) (n = 5 mice). Data from all tumours in all mice were merged and normalized to the average tumour number across inert sgRNAs. For dg, error bars denote 95% confidence intervals determined by bootstrap sampling. h, Representative H&E staining of tumours from KC mice infected with lentiviral vectors encoding Cre recombinase and either a control or Ambr1-targeted sgRNA. Scale bar, 100 μm. n = 6 (Neo no. 1) or n = 5 (Ambra1 no. 1) mice). i, Representative immunofluorescence for cyclin D in control and Ambra1-knockout KC tumours. The cyclin D antibody used recognizes cyclin D1 and D2. Scale bars, 100 μm. From n = 2 mice per sgRNA).
Extended Data Fig. 10 |
Extended Data Fig. 10 |. AMBRA1 is a tumour suppressor in KRAS-mutant human lung adenocarcinoma.
a, Immunoassay of AMBRA1, RB and cyclin D1 in control and knockout human A549 lung adenocarcinoma cells. Actin is a loading control. b, Growth of control and mutant A549 xenografts in NOD-SCID-gamma (NSG) mice (n = 8 tumours per sgRNA). ****Pinteraction < 0.0001 by two-way ANOVA comparing the AMBRA1-knockout curve with control. Tumour volume measurements for RB1-knockout tumours were staggered 1 d behind control and AMBRA1-knockout tumours, which precludes two-way ANOVA. Data are mean ± s.e.m., with best-fit curves for exponential growth. c, Final tumour weights from b. Each symbol is one tumour (n = 8 per sgRNA). Data are mean ± s.d. d, g, j, Cyclin D1 protein levels as measured by reverse phase protein array in relation to the mRNA expression as measured by RNA sequencing (upper quartile of fragments per kilobase of transcript per million mapped reads (FPKM-UQ)) of RB pathway genes that best predict cyclin D1 protein in TCGA KRAS G12-mutant lung adenocarcinoma (d) (n = 90 samples), KRAS wild-type lung adenocarcinoma (g) (n = 257 samples) and EGFR-mutant lung adenocarcinoma (j) (n = 41 samples), using a step-wise regression model. For g, j, AMBRA1 was not selected in the final model but is shown for comparison. Each column is an individual sample, and samples are sorted by cyclin D1 protein levels. e, h, Kaplan–Meier plot of AMBRA1 expression (high, upper third; low, bottom third) in TCGA KRAS wild-type lung adenocarcinoma (e) (n = 361 patients) and EGFR-mutant lung adenocarcinoma (h) (n = 60 patients). f, i, Forest plot of Cox proportional hazard model of TCGA KRAS wild-type lung adenocarcinoma (f) (n = 340 patients) and EGFR-mutant lung adenocarcinoma (i) (n = 60 patients). Model is adjusted by stage, age and gender. P values calculated by two-way ANOVA (b), two-sided unpaired t-test (c), F-test (d, g, j), log-rank test (e, h) and Wald test (f, i).
Extended Data Fig. 11 |
Extended Data Fig. 11 |. AMBRA1 regulates cyclin D protein stability and signalling through the RB pathway.
AMBRA1 limits CDK4/6 activity by mediating ubiquitylation and degradation of D-type cyclins as part of the CRL4 E3 ligase complex. Loss of AMBRA1 leads to accumulation of cyclin D protein and decreased sensitivity to CDK4/6 inhibitors, owing to sustained RB phosphorylation and therefore persistent cell cycle progression.
Fig. 1 |
Fig. 1 |. AMBRA1 loss regulates the response to CDK4/6 inhibition as well as levels of cyclin D.
a, Volcano plot of a CRISPR–Cas9 screen for genes that regulate the response to palbociclib in U937 cells, analysed using the Cas9 high-throughput maximum likelihood estimator (casTLE). FDR, false-discovery rate. b, Immunoassay for AMBRA1 or RB in control and AMBRA1- or RB1-knockout U937 cl ones. sgAMBRA1 no. 1 and no. 2 denote two different sgRNAs against AMBRA1; sgCtrl, control sgRNA. c, Change in U937 cell numbers after a 48-h treatment with 0.5 μM palbociclib or DMSO. d, BrdU and propidium iodide staining analysis of cycling S-phase U937 cells treated with 0.5 μM palbociclib for 24 h. Each symbol in c, d is an isogenic clone (n = 3 biological replicates per clone). e, Immunoassay of RB phosphorylation (at S795) in U937 cells treated with increasing doses of palbociclib or DMSO (−) for 24 h. f, Immunoassay of G1 cyclins and cyclin-dependent kinases in U937 clones. U937 cells do not express cyclin D1. g, Volcano plot of shotgun mass spectrometry comparing control and AMBRA1-knockout (KO) U2OS cells. Significant hits (|log2-transformed fold change| > 1, adjusted P < 0.05) are in red. BH, Benjamin–Hochberg. h, Immunoassay of cyclin D1 and haemagglutinin (HA) in U2OS cells overexpressing HA-tagged, stabilized cyclin D1 (cyclin D1(T286A)–HA) or red fluorescent protein (RFP) control. i, Analysis of cycling S-phase cells from h treated with increasing doses of palbociclib for 24 h (n = 3 biological replicates). j, Top, analysis of cycling S-phase U2OS cells after cyclin D1 (CCND1) knockdown by siRNA pools. Bottom, corresponding immunoassay 48 h after siRNA transfection (n = 3 biological replicates). NT, non-targeting control. k, l, Co-immunoprecipitation (IP) of cyclin D1 (k) and CDK2 (l) in control, AMBRA1-knockout and cyclin-D1(T286A)-overexpressing U2OS cells, and immunoassay of relevant protein complexes (n = 1 (k) or n = 2 (l) biological replicates). Tubulin and HSP90 are loading controls. All data are mean ± s.d. P values calculated by two-sided unpaired t-test (c, d), negative binomial test (g), two-way analysis of variance (ANOVA) with post hoc Sidak test (i, ANOVA Pcell line < 0.0001) and two-sided paired t-test (j).
Fig. 2 |
Fig. 2 |. AMBRA1 regulates the stability of cyclin D.
a, Immunoassay of cyclin D1 in control and AMBRA1-knockout U2OS cells treated with 10 μg ml−1 translation inhibitor cycloheximide (CHX) for 0 to 4 h. b, Quantification of cyclin D1 (left), cyclin D2 (middle) and cyclin D3 (right) levels as in a (n = 3 biological replicates). c, Immunoassay of cyclin D1 phosphorylated at T286 and total cyclin D1 in U2OS cells treated with 1 μM proteasome inhibitor bortezomib (BTZ) for 4 h. d, e, Quantification of cyclin D1 (d) and cyclin D1 phosphorylation at T286 (e) in cells from c (n = 4 biological replicates). f, Schematic of the tandem ubiquitin binding entities (TUBE) assay to immunoprecipitate ubiquitylated proteins. g, Immunoassay of ubiquitylated cyclin D1 isolated from U2OS cells using TUBEs. h, Quantification of cyclin D1 ubiquitylation relative to total cyclin D1 from g (n = 3 biological replicates). Data from both AMBRA1 sgRNAs are pooled. Only data from samples with similar levels of ubiquitin pull down are shown. See Supplementary Table 9 for all data. i, Schematic of mass spectrometry (MS) analysis to detect ubiquitylated proteins after immunoprecipitation with anti-K-ε-G-G antibodies. j, Quantification of cyclin D1 ubiquitylation at the three lysines detected by immunoprecipitation and mass spectrometry of K-ε-G-G peptides. shAMBRAl no. 1 and no. 2 denote two different short hairpin RNAs (shRNA) against AMBRA1; shNT, non-targeting shRNA. k, Co-immunoprecipitation of endogenous AMBRA1 and cyclin D in U2OS cells pretreated with 1 μM bortezomib for 4 h, analysed by immunoblot. DDB1 is a positive control for AMBRA1 binding. The cyclin D antibody recognizes cyclin D1 and D2. Representative of two independent experiments. HSP90 and tubulin are loading controls. All data are mean ± s.d. P values calculated by two-way ANOVA (b), two-sided t-test (paired t-test for d, e; unpaired t-test for h), and two-sided unpaired t-test with Benjamini–Hochberg correction (j).
Fig. 3 |
Fig. 3 |. CRL4AMBRA1 ubiquitylates cyclin D.
a, Immunoassay of cyclin D1 and MYC in U2OS cells treated with 1 μM neddylation inhibitor MLN4924 for 0 to 8 h. b, Quantification of a (n = 3 biological replicates). Left, cyclin D1; right, MYC. c, Immunoassay of cyclin D1 in U2OS cells following knockdown of AMBRA1 or various cullin proteins. Asterisk, nonspecific band. The CUL4B antibody appears to cross-react with CUL4A. d, Quantification of cyclin D1 in c (n = 3 biological replicates). e, Immunoassay of cyclin D1 ubiquitylation in 293T cells following overexpression of AMBRA1 and knockdown of CUL4A or CUL4B. Cells were pretreated with 1 μM bortezomib for 3 h. Representative of two independent experiments. f, Immunoassay of cyclin D1 and AMBRA1 in U2OS cells with doxycycline-inducible wild-type AMBRA1 (WT), AMBRA1(ΔH) (ΔH) or GFP control, treated with 500 ng ml−1 doxycycline for 2 d. g, Quantification of cyclin D1 in f (n = 3 biological replicates). h, Immunoblot of cyclin D1 polyubiquitylation (poly-Ub) from in vitro ubiquitylation assays performed on purified cyclin D1. AMBRA1 and CUL4B (CRL4–AMBRA1) were independently purified from 293T cells, and E1, E2 and ubiquitin (Ub) are recombinant proteins (n = 1 experiment). i, Immunoblot of cyclin D1 polyubiquitylation from in vitro ubiquitylation time-course assays, similar to h. Representative of two independent experiments. HSP90 and actin are loading controls. All data are mean ± s.d. P values calculated by two-way ANOVA (b) or two-sided paired t-test (d, g).
Fig. 4 |
Fig. 4 |. AMBRA1 is a tumour suppressor in KRAS-mutant lung adenocarcinoma.
a, Schematic of multiplexed CRISPR–Cas9 gene editing and Tuba-seq in KPTC mice, KTC mice (wild type for p53) and KT mice (wild type for p53 and lacking Cas9). sgID-BC, dual barcode to identify each individual tumour and its associated sgRNA. Neo denotes the neomycin resistance gene. b, Relative tumour sizes for each sgRNA in KTC mice (n = 9 mice). Tumour sizes were calculated from merged data from all tumours in all mice and normalized to inert sgRNAs 15 weeks after cancer initiation. Error bars denote 95% confidence intervals determined by bootstrap sampling. c, Representative haematoxylin and eosin (H&E) staining of lung sections from control and Ambra1-mutant KC mice 15 weeks after cancer initiation. Scale bars, 1 mm. d, Quantification of tumours in c. n = 6 (sgNeo no. 1) or 5 (sgAmbra1 no. 1) mice. Data are mean ± s.e.m. e, Kaplan–Meier plot of AMBRA1 expression (high, upper third; low, bottom third) in TCGA KRAS G12-mutant lung adenocarcinoma (n = 136 patients). f, Forest plot of Cox proportional hazard model of TCGA KRAS G12-mutant lung adenocarcinoma (n = 131 patients). Model is adjusted by stage, age and gender. Hazard ratios are given with 95% confidence interval in parentheses. P values calculated by two-sided unpaired t-test (d), log-rank test (e) and Wald test (f).

References

    1. Deshpande A, Sicinski P & Hinds PW Cyclins and cdks in development and cancer: a perspective. Oncogene 24, 2909–2915 (2005). - PubMed
    1. Sherr CJ Cancer cell cycles. Science 274, 1672–1677 (1996). - PubMed
    1. Malumbres M & Barbacid M Cell cycle, CDKs and cancer: a changing paradigm. Nat. Rev. Cancer 9, 153–166 (2009). - PubMed
    1. Kanie T et al. Genetic reevaluation of the role of F-box proteins in cyclin D1 degradation. Mol. Cell. Biol. 32, 590–605 (2012). - PMC - PubMed
    1. Qie S & Diehl JA Cyclin D degradation by E3 ligases in cancer progression and treatment. Semin. Cancer Biol. 67, 159–170 (2020). - PMC - PubMed

Publication types