. 2021 Mar 29:15:630898.
doi: 10.3389/fnhum.2021.630898. eCollection 2021.

Progression of Visual Pathway Degeneration in Primary Open-Angle Glaucoma: A Longitudinal Study

Affiliations

Progression of Visual Pathway Degeneration in Primary Open-Angle Glaucoma: A Longitudinal Study

Shereif Haykal et al. Front Hum Neurosci. .

Abstract

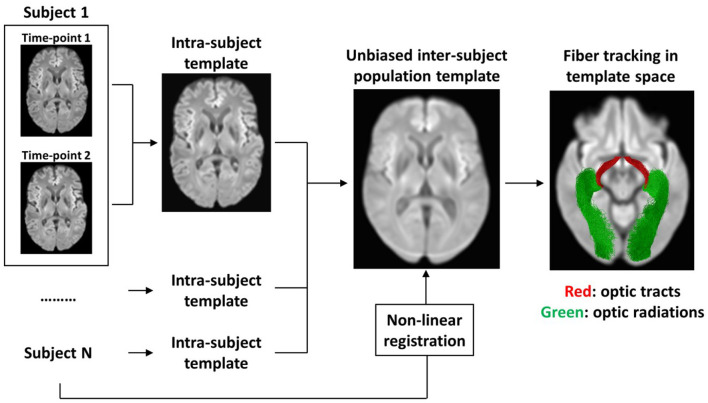
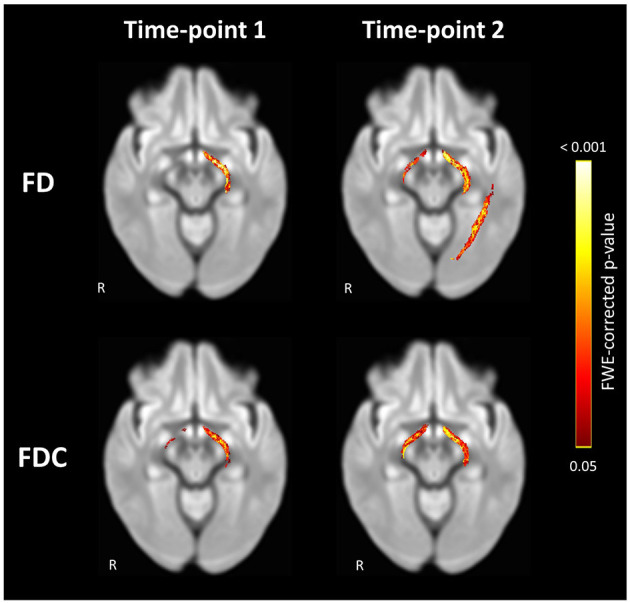
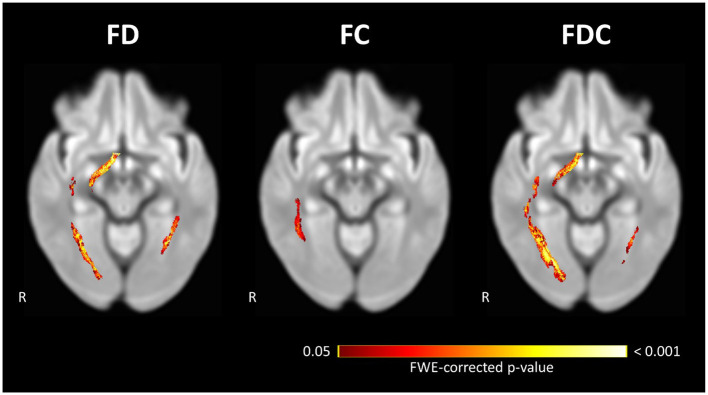
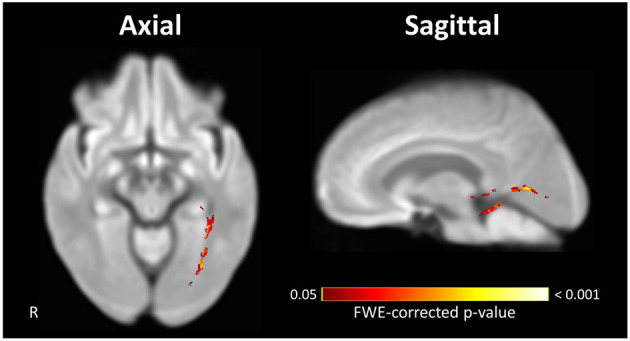
Background: Primary open-angle glaucoma (POAG) patients exhibit widespread white matter (WM) degeneration throughout their visual pathways. Whether this degeneration starts at the pre- or post-geniculate pathways remains unclear. In this longitudinal study, we assess the progression of WM degeneration exhibited by the pre-geniculate optic tracts (OTs) and the post-geniculate optic radiations (ORs) of POAG patients over time, aiming to determine the source and pattern of spread of this degeneration. Methods: Diffusion-weighted MRI scans were acquired for 12 POAG patients and 14 controls at two time-points 5.4 ± 2.1 years apart. Fiber density (FD), an estimate of WM axonal density, was computed for the OTs and ORs of all participants in an unbiased longitudinal population template space. First, FD was compared between POAG patients and the controls at time-point 1 (TP1) and time-point 2 (TP2) independently. Secondly, repeated measures analysis was performed for FD change in POAG patients between the two time-points. Finally, we compared the rate of FD change over time between the two groups. Results: Compared to the controls, POAG patients exhibited significantly lower FD in the left OT at TP1 and in both OTs and the left OR at TP2. POAG patients showed a significant loss of FD between the time-points in the right OT and both ORs, while the left OR showed a significantly higher rate of FD loss in POAG patients compared to the controls. Conclusions: We find longitudinal progression of neurodegenerative WM changes in both the pre- and post-geniculate visual pathways of POAG patients. The pattern of changes suggests that glaucomatous WM degeneration starts at the pre-geniculate pathways and then spreads to the post-geniculate pathways. Furthermore, we find evidence that the trans-synaptic spread of glaucomatous degeneration to the post-geniculate pathways is a prolonged process which continues in the absence of detectable pre-geniculate degenerative progression. This suggests the presence of a time window for salvaging intact post-geniculate pathways, which could prove to be a viable therapeutic target in the future.

Keywords: diffusion MRI; fixel-based analysis; glaucoma; longitudinal; white matter.


Conflict of interest statement

The authors declare that the research was conducted in the absence of any commercial or financial relationships that could be construed as a potential conflict of interest.

Figures

Figure 1
Figure 1
Flow-chart summarizing the main steps for creating an unbiased longitudinal population template. First, an intra-subject template was created from TP1 and TP2 scans of each participant individually. Then, the intra-subject templates of all participants were used to create an unbiased inter-subject population template. To achieve spatial correspondence between all participants in template space, each of the participant's scans were warped from native space to template space using non-linear registration. To specifically analyze the visual pathways, the OTs and the ORs were tracked using probabilistic tractography in template space.
Figure 2
Figure 2
Significant loss of FD and FDC in the visual pathways of POAG patients compared to controls at Time-point 1 and Time-point 2. Loss of FD was found in the left OT at Time-point 1 and in both OTs and left OR at Time-point 2. Loss of FDC was found in both OTs at both time-points. Streamlines corresponding to fixels exhibiting significant (FWE-corrected P < 0.05) loss are overlaid on a representative axial slice of the inter-subject population template and colored according to their p-values. Images are shown in radiologic convention. FD, fiber density; FDC, fiber density and bundle cross section.
Figure 3
Figure 3
Significant loss of FD, FC, and FDC in the visual pathways of POAG patients between Time-point 1 and Time-point 2. Repeated measures analysis of POAG patients reveals a significant loss of FD and FDC at the right OT and both ORs, and a significant loss of FC in the right OR. Streamlines corresponding to fixels exhibiting significant (FWE-corrected P < 0.05) loss are overlaid on a representative axial slice of the inter-subject population template and colored according to their p-values. Images are shown in radiologic convention. FC, fiber-bundle cross section; FD, fiber density; FDC, fiber density and bundle cross section.
Figure 4
Figure 4
Significant difference in the rate of FD loss exhibited by visual pathways of POAG patients compared to controls. The left OR of POAG patients showed a significantly higher rate of FD loss compared to the controls. Streamlines corresponding to fixels exhibiting a significant (FWE-corrected P < 0.05) difference between groups are overlaid on representative axial (left) and sagittal (right) slices of the inter-subject population template and colored according to their p-values. Images are shown in radiologic convention. FD, fiber density.
Figure 5
Figure 5
Scatterplots showing correlations between changes in FBA measures of the OTs and ORs and changes in (A) RNFL thickness (represented by NFI) and (B) visual function (represented by VDMD) over time. Displayed FBA, NFI, and VMFD values are the differences in the measures between the two time-points.

References

    1. Andersson J. L. R., Skare S., Ashburner J. (2003). How to correct susceptibility distortions in spin-echo echo-planar images: application to diffusion tensor imaging. Neuroimage 20, 870–888. 10.1016/S1053-8119(03)00336-7 - DOI - PubMed
    1. Andersson J. L. R., Sotiropoulos S. N. (2016). An integrated approach to correction for off-resonance effects and subject movement in diffusion MR imaging. Neuroimage 125, 1063–1078. 10.1016/j.neuroimage.2015.10.019 - DOI - PMC - PubMed
    1. Bolacchi F., Garaci F. G., Martucci A., Meschini A., Fornari M., Marziali S., et al. (2012). Differences between proximal versus distal intraorbital optic nerve diffusion tensor magnetic resonance imaging properties in glaucoma patients. Invest. Ophthalmol. Vis. Sci. 53, 4191–4196. 10.1167/iovs.11-9345 - DOI - PubMed
    1. Calkins D. J., Horner P. J. (2012). The cell and molecular biology of glaucoma: axonopathy and the brain. Invest. Ophthalmol. Vis. Sci. 53, 2482–2484. 10.1167/iovs.12-9483i - DOI - PMC - PubMed
    1. Chen Z., Lin F., Wang J., Li Z., Dai H., Mu K., et al. (2013). Diffusion tensor magnetic resonance imaging reveals visual pathway damage that correlates with clinical severity in glaucoma. Clin. Experiment. Ophthalmol. 41, 43–49. 10.1111/j.1442-9071.2012.02832.x - DOI - PubMed

LinkOut - more resources