. 2021 Mar 29:12:605930.
doi: 10.3389/fimmu.2021.605930. eCollection 2021.

cGAS-STING Pathway Does Not Promote Autoimmunity in Murine Models of SLE

Affiliations

cGAS-STING Pathway Does Not Promote Autoimmunity in Murine Models of SLE

Mona Motwani et al. Front Immunol. .

Abstract

Detection of DNA is an important determinant of host-defense but also a driver of autoinflammatory and autoimmune diseases. Failure to degrade self-DNA in DNAseII or III(TREX1)-deficient mice results in activation of the cGAS-STING pathway. Deficiency of cGAS or STING in these models ameliorates disease manifestations. However, the contribution of the cGAS-STING pathway, relative to endosomal TLRs, in systemic lupus erythematosus (SLE) is controversial. In fact, STING deficiency failed to rescue, and actually exacerbated, disease manifestations in Fas-deficient SLE-prone mice. We have now extended these observations to a chronic model of SLE induced by the i.p. injection of TMPD (pristane). We found that both cGAS- and STING-deficiency not only failed to rescue mice from TMPD-induced SLE, but resulted in increased autoantibody production and higher proteinuria levels compared to cGAS STING sufficient mice. Further, we generated cGASKOFaslpr mice on a pure MRL/Faslpr background using Crispr/Cas9 and found slightly exacerbated, and not attenuated, disease. We hypothesized that the cGAS-STING pathway constrains TLR activation, and thereby limits autoimmune manifestations in these two models. Consistent with this premise, mice lacking cGAS and Unc93B1 or STING and Unc93B1 developed minimal systemic autoimmunity as compared to cGAS or STING single knock out animals. Nevertheless, TMPD-driven lupus in B6 mice was abrogated upon AAV-delivery of DNAse I, implicating a DNA trigger. Overall, this study demonstrated that the cGAS-STING pathway does not promote systemic autoimmunity in murine models of SLE. These data have important implications for cGAS-STING-directed therapies being developed for the treatment of systemic autoimmunity.

Keywords: DNaseI; SLE; TLRs; cGAS/STING; pristane.


Conflict of interest statement

GAB is employed by the company Merck and Co., Inc., Kenilworth, NJ, United States. The authors declare that this study received funding from sponsored research agreement from GSK (100251747). The funder had the following involvement with the study: decision to submit it for publication. The remaining authors declare that the research was conducted in the absence of any commercial or financial relationships that could be construed as a potential conflict of interest.

Figures
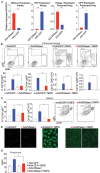
Figure 1
Figure 1
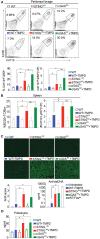
Overexpression of DNAse I ameliorates inflammation in chronic TMPD mediated peritonitis. 8–10 weeks old female C57BL6/J WT mice were either injected i.p. with 1011 AAV/GFP or AAV/DNAseI particles in 200 uL PBS. 10 weeks later mice were either injected with 500 ul TMPD or un-injected and analyzed from two independent experiments 6 months after TMPD injection. All the experiments were performed using the following N's of mice- AAV/GFP (blue open bars) AAV/DNAseI (red open bars) are uninjected mice n = 3. AAV/GFP+TMPD (blue closed bars) n = 4 and AAV/DNAseI +TMPD (red closed bars) are injected mice n = 8. (A) qPCR was performed to measure DNAse1 and GFP gene expression in total tissue, peritoneal lining and kidney. AAV/DNAseI injected mice are indicated in red bars and AAV/GFP mice are indicated in blue. (B) CD11b+ peritoneal exudate cells stained to identify Ly6Chi monocytes and Ly6Ghi granulocytes. AAV/GFP (blue) and AAV/DNAse I (red) uninjected mice are indicated by open bars and TMPD injected mice are indicated as closed bars. The top panel shows representative flow plots and frequency/ numbers are graphed in the bottom panel. (C) CD11b+ splenic cells stained to identify Ly6Chi monocytes. AAV/GFP (blue) and AAV/DNAseI (red) uninjected mice are indicated by open bars and TMPD injected mice are indicated as closed bars. The right panel shows representative flow plots and frequency/numbers are graphed in the left panel (D) Sera was collected 6 months after TMPD injection and ANA was measured using HEp2 substrate slides. Representative image from uninjected mice and AAV/GFP +TMPD injected mice is shown. Representative image is shown for two patterns observed in AAV DNAseI TMPD injected mice at 20X magnification. (E) Urine samples collected 6 months after TMPD injection were screened for proteinuria using an albumin ELISA assay. AAV/GFP (blue) and AAV/DNAseI (red) uninjected mice are indicated by open bars and TMPD injected mice are indicated as closed bars. Statistical significance is represented by *P < 0.05, **P < 0.01.
Figure 2
Figure 2
STING and cGAS deficiency exacerbate disease in chronic model of TMPD induced autoimmunity. 12–16 week-old female WT, STINGKO or cGASKO mice were either uninjected (open bars, n = 5) or injected with 500 ul of TMPD (closed bars, n = 15) were analyzed from two independent experiments. (A) 6 months later, peritoneal exudate cells were evaluated by flow cytometry. Live and single Ly6CLy6G cells were gated for CD11b+ and F4/80hi. The top panel indicates representative flow plots from uninjected mice (WT = blue open bar, STINGKO = green open bar and cGASKO = red open bar). The middle panel shows representative flow plots from injected animals (closed bars) and the graphs for both frequency and numbers of CD11b+ and F4/80hi cells are shown in the bottom panel. (B) Flow cytometry was performed on splenocytes and double negative T cells (CD4 CD8) were identified as CD3+ B220+ and CD11b+ and Ly6Chi cells were identified as inflammatory monocytes. The frequency of double negatives and cell numbers for inflammatory monocytes are graphed. (C) Sera was collected 3 months after TMPD injection and ANAs were detected using HEp2 substrate slides at 1:50 serum dilution. The representative images from each genotype and condition are shown at 20X magnification in the top panel. The slides were scored for fluorescence intensity and the scores are graphed at the bottom. Anti-ds DNA antibodies were measured in the serum at 3 months after TMPD injection (closed bars, n = 6). Sera from a WT/Faslpr strain was used as a positive control. (D) Proteinuria was assessed in urine collected 6 months after TMPD injection by using an albumin ELISA assay. Statistical significance is represented by *P < 0.05.
Figure 3
Figure 3
Exacerbation of TMPD-induced SLE in cGAS or STING deficient mice is dependent on endosomal TLRs. 12–16 week old female WT (blue), STINGKO (red), cGASKO (green), UNCKO (blue with dots), UNCKO STINGKO (red with dots), and UNCKOcGASKO (green with dots) mice were injected with 500 ul of TMPD (n = 10). Uninjected controls are indicated as open bars (n = 4 per genotype). The mice were analyzed 5 months post injection from two independent experiments. (A) Peritoneal exudate cells were evaluated by flow cytometry. Live and single Ly6CLy6G cells were gated for CD11b+ and F4/80hi. Representative flow plots for WT STINGKO, cGASKO injected mice are shown in the top panel, the double deficient injected mice in the middle panel and the graphs for cell frequency and cell numbers are shown in bottom panel. (B) Sera was collected 3 months after TMPD injection and ANA were detected using HEp2 substrate slides at 1:50 serum dilution. The representative images from each genotype and condition are shown at 20X magnification in the top and middle panels and the scores for fluorescence intensity are graphed in the bottom. (C) Proteinuria was assessed in urine collected 5 months after TMPD injection by using an albumin ELISA assay. Statistical significance is represented by *P < 0.05.
Figure 4
Figure 4
cGAS deficiency does not rescue SLE-prone MRL/Faslpr mice. (A) BMDMs were isolated from WT/ Faslpr and cGAS KO/ Faslpr mice. These cells were either transfected or un-transfected with ISD 5 uM and interferon β ELISA was performed after overnight treatments. (B) BMDM cell lysates were prepared and western blot was performed to detect cGAS levels. Actin was blotted as loading control. (B) WT/Faslpr (n = 10) and cGASKO/Faslpr (n = 18) mice were observed until the time of death and Kaplan Meier survival analysis was performed. (C) Anti-nucleosome ELISA was performed for 12–16 week old mice B6 WT and B6 cGASKO mice (open bars), WT/Faslpr littermates (blue bar, n = 16), cGASKO/Faslpr mice (green bar, n = 16). (D) Urine samples from 16 week old B6 WT and B6 cGASKO mice (open bars), WT/Faslpr littermates (blue bar, n = 16), cGASKO/Faslpr mice (green bar, n = 18) were screened for proteinuria using an albumin ELISA assay. H&E staining was performed to analyze cellular infiltrate WT/Faslpr littermates (blue bar, n = 7), cGASKO/Faslpr mice (green bar, n = 7). (E) Spleen and lymph nodes weights were determined at 12 weeks of age (n = 16 mice each for WT/Faslpr and cGASKO/Faslpr). (F) Flow cytometry was performed on splenocytes and double negative T cells (CD4 CD8) were identified as CD3+ B220+. To enumerate pDCs, B220 CD3 CD11c+ splenocytes were gated for SiglecH+ and Bst2+ cells. Representative flow plot is shown for each cell type and corresponding genotype in the top/middle panels and the frequency of cells is graphed in the bottom. All the flow analysis was performed on 12 week old female mice, (n = 16 mice each for WT/Faslpr and cGASKO/Faslpr). Statistical significance is represented by *P < 0.05.

References

    1. Pascual V, Farkas L, Banchereau J. Systemic lupus erythematosus: all roads lead to type I interferons. Curr Opin Immunol. (2006) 18:676–82. 10.1016/j.coi.2006.09.014 - DOI - PubMed
    1. Christensen SR, Shupe J, Nickerson K, Kashgarian M, Flavell RA, Shlomchik MJ. Toll-like receptor 7 and TLR9 dictate autoantibody specificity and have opposing inflammatory and regulatory roles in a murine model of lupus. Immunity. (2006) 25:417–28. 10.1016/j.immuni.2006.07.013 - DOI - PubMed
    1. Santiago-Raber ML, Baudino L, Izui S. Emerging roles of TLR7 and TLR9 in murine SLE. J Autoimmun. (2009) 33:231–8. 10.1016/j.jaut.2009.10.001 - DOI - PubMed
    1. Ueki M, Takeshita H, Fujihara J, Iida R, Yuasa I, Kato H, et al. . Caucasian-specific allele in non-synonymous single nucleotide polymorphisms of the gene encoding deoxyribonuclease I-like 3, potentially relevant to autoimmunity, produces an inactive enzyme. Clin Chim Acta. (2009) 407:20–4. 10.1016/j.cca.2009.06.022 - DOI - PubMed
    1. Al-Mayouf SM, Sunker A, Abdwani R, Abrawi SA, Almurshedi F, Alhashmi N, et al. . Loss-of-function variant in DNASE1L3 causes a familial form of systemic lupus erythematosus. Nat Genet. (2011) 43:1186–8. 10.1038/ng.975 - DOI - PubMed

Publication types

MeSH terms