. 2021 Mar 29:12:626308.
doi: 10.3389/fimmu.2021.626308. eCollection 2021.

Integrin Activation Enables Sensitive Detection of Functional CD4+ and CD8+ T Cells: Application to Characterize SARS-CoV-2 Immunity

Affiliations

Integrin Activation Enables Sensitive Detection of Functional CD4+ and CD8+ T Cells: Application to Characterize SARS-CoV-2 Immunity

Anna Schöllhorn et al. Front Immunol. .

Abstract

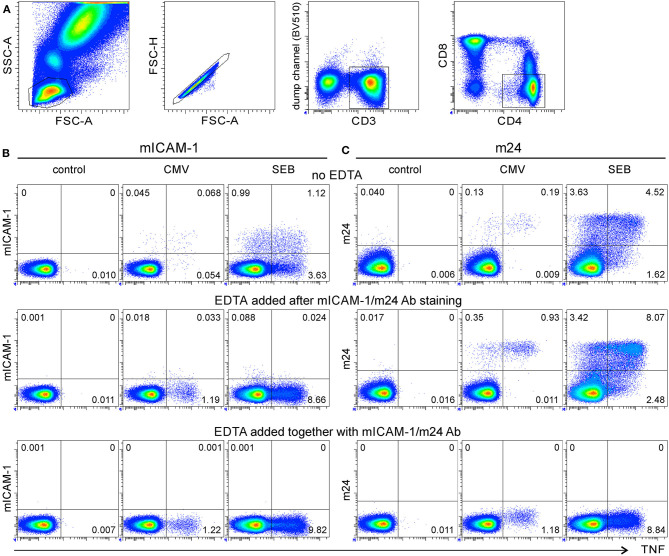
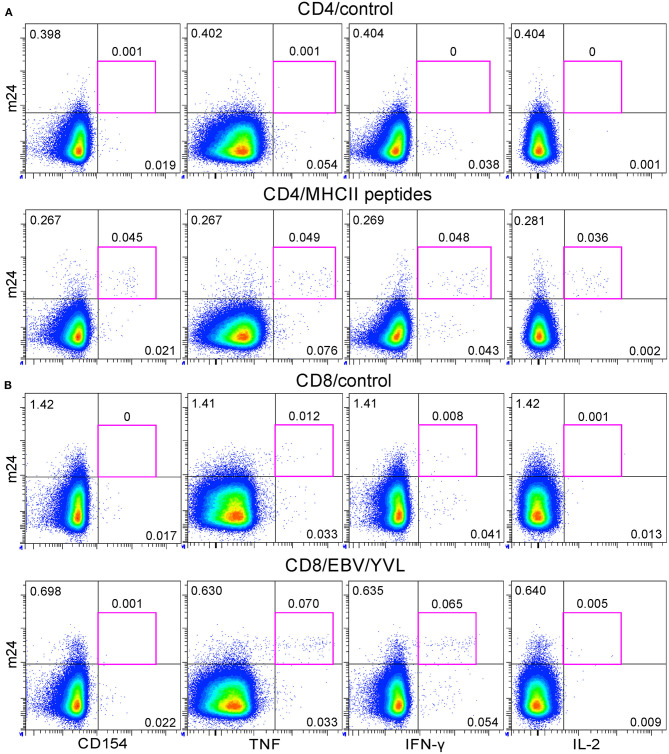
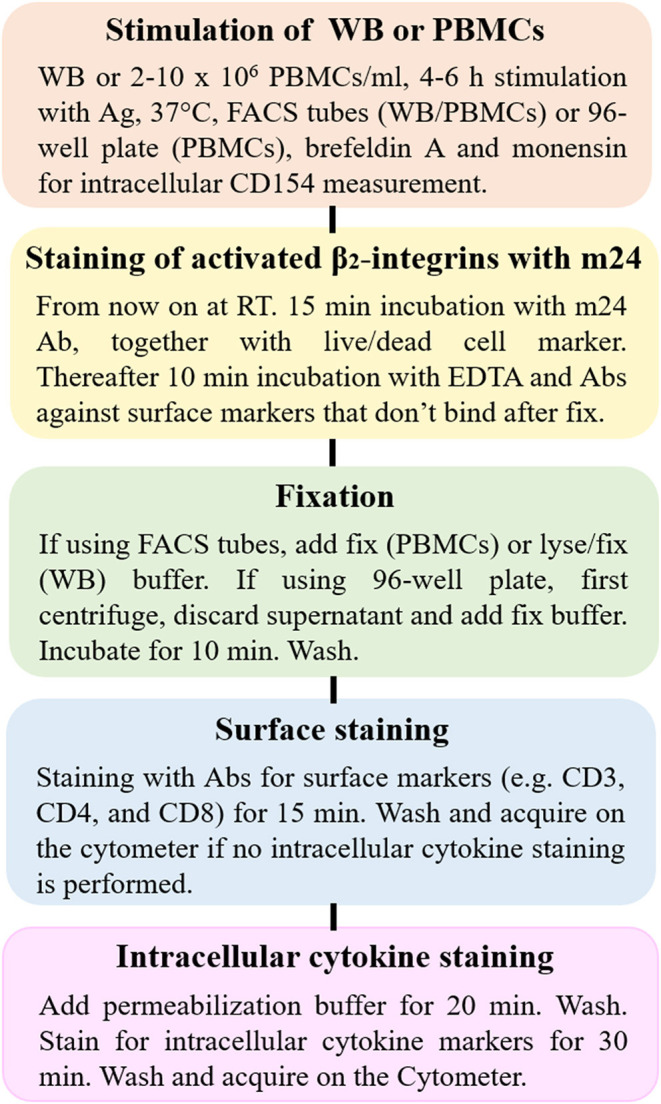
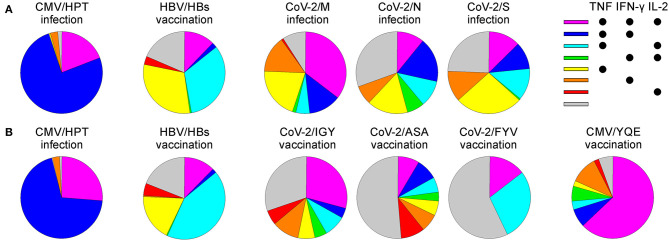
We have previously shown that conformational change in the β2-integrin is a very early activation marker that can be detected with fluorescent multimers of its ligand intercellular adhesion molecule (ICAM)-1 for rapid assessment of antigen-specific CD8+ T cells. In this study, we describe a modified protocol of this assay for sensitive detection of functional antigen-specific CD4+ T cells using a monoclonal antibody (clone m24 Ab) specific for the open, high-affinity conformation of the β2-integrin. The kinetics of β2-integrin activation was different on CD4+ and CD8+ T cells (several hours vs. few minutes, respectively); however, m24 Ab readily stained both cell types 4-6 h after antigen stimulation. With this protocol, we were able to monitor ex vivo effector and memory CD4+ and CD8+ T cells specific for severe acute respiratory syndrome coronavirus 2 (SARS-CoV-2), cytomegalovirus (CMV), Epstein-Barr virus (EBV), and hepatitis B virus (HBV) in whole blood or cryopreserved peripheral blood mononuclear cells (PBMCs) of infected or vaccinated individuals. By costaining β2-integrin with m24 and CD154 Abs, we assessed extremely low frequencies of polyfunctional CD4+ T cell responses. The novel assay used in this study allows very sensitive and simultaneous screening of both CD4+ and CD8+ T cell reactivities, with versatile applicability in clinical and vaccination studies.

Keywords: CD4+ T cells; CD8+ T cells; SARS-CoV-2; antigen specificity; integrin activation.


Conflict of interest statement

The authors declare that the research was conducted in the absence of any commercial or financial relationships that could be construed as a potential conflict of interest.

Figures

Figure 1
Figure 1
m24 Antibody (Ab) staining of activated β2-integrins followed by ethylenediaminetetraacetic acid (EDTA) treatment can be used to detect antigen-specific CD4+ T cells. Assessment of whole blood (WB) antigen-specific CD4+ T cells by staining of activated β2-integrins. (A) Gating strategy. From left to right, the lymphocyte gate, the FSC-A/H duplet exclusion, the gating of CD3+ events followed by CD4+ events. (B,C) Intercellular adhesion molecule-1 (ICAM-1) multimer and m24 Ab stainings under different EDTA treatment. WB from a donor having a large number of CMV/HPT-specific CD4+ T cells was cultured without stimulus (left, control), with the CMV/HPT peptide (middle), or with Staphylococcus enterotoxin B (SEB) (right) in the presence of brefeldin A and monensin. After 4 h, cells were either stained with multimers of ICAM-1 (mICAM-1) for 4 min (B) or with m24 Ab for 15 min (C), without (top), or with EDTA addition after (middle), or at the time (bottom) of the staining. The cells were subsequently labeled with CD3, CD4, and CD8 Abs and for the intracellular expression of tumor necrosis factor (TNF) to identify CMV-specific CD4+ T cells. Numbers indicate frequencies among CD4+ T cells in %.
Figure 2
Figure 2
The antigen-specific β2-integrin activation on CD8+ T cells can be visualized by either ICAM-1 multimers (without EDTA) or by m24 Ab with or without EDTA treatment. Assessment of WB antigen-specific CD8+ T cells by staining of activated β2-integrins. (A) Gating strategy. From left to right, the lymphocyte gate, the FSC-A/H duplet exclusion, the gating of CD3+ events, followed by CD8+ events. (B) The WB from a selected HLA-A*02+ donor was incubated with the NLV peptide for 16 min, then either not treated (top) or treated with EDTA after (middle) or at the time of (bottom) the staining with multimers of ICAM-1 or with m24 Ab. Cells were simultaneously stained with A*02/NLV tetramers and thereafter with CD3, CD4, and CD8 Abs. (C) Staining with m24 Ab and ICAM-1 multimers together, without EDTA treatment. Numbers indicate frequencies among CD8+ T cells in %.
Figure 3
Figure 3
The flow cytometry assessment of antigen-specific CD4+ WB T cells by staining of activated β2-integrins with m24 Ab. The cells were stained with m24 Ab, treated with EDTA afterward, and then stained with CD3, CD4, and CD8 Abs, gating strategy is displayed in Figure 1A. (A) The time course of m24 Ab staining following incubation of WB cells with SEB (black, four donors, presented as mean ± SEM), CMV/HPT peptide (red, one donor), or HBV/Env pool of overlapping peptides (blue and purple, two donors) for 4, 8, 16, 32, 60, 120, 240, or 360 min. Background from the relevant unstimulated sample was subtracted. (B) Examples of m24 Ab staining obtained after 16 or 240 min, i.e., 4 h without stimulation (control) or in the presence of matched peptides or SEB of the donor with a CMV/HPT CD4+ reactivity (top panel). One of the two HBV vaccinees (bottom panel). (C) DRB1*11/HPT multimer staining was performed without CMV/HPT peptide stimulation and was obtained from the same donor as in (B) (top panel). Numbers indicate frequencies among CD4+ T cells in %.
Figure 4
Figure 4
The flow cytometry assessment of antigen-specific CD8+ WB T cells by staining activated β2-integrins with m24 Ab. Cells were stained with m24 Ab, treated with EDTA afterward, and then stained with CD3, CD4, and CD8 Abs; gating strategy is displayed in Figure 2A. Percentages of m24+ cells among total CD8+ T cells are indicated. (A) The time course of m24 Ab staining following incubation of WB cells with SEB (gray, three donors, presented as mean ± SEM), or CMV/NLV peptide (orange, one donor; green, the same donor, but additionally stained with A*02/NLV multimers), for 4, 8, 16, 32, 60, 120, 240, or 360 min. Background from the relevant unstimulated sample was subtracted. Numbers indicate frequencies among CD8+ T cells in %. (B) Examples of m24 Ab staining obtained after 16 or 240 min, i.e., 4 h without stimulation (control), in the presence of CMV/NLV peptide, or after stimulation with SEB. (C) Combined m24 Ab and CMV/NLV tetramer staining of the CMV-specific CD8+ T cells. Percentages of A*02/NLV+ within the CD8+ subset and of m24+ within the A*02/NLV+ cells are indicated in black and green, respectively.
Figure 5
Figure 5
The functional profile of CMV-specific m24+ CD4+ WB T cells. WB of a DRB1*11+ donor was stimulated with CMV/HPT peptide. (A) Frequencies of m24 Ab staining, CD154, and cytokine expression within CD4+ T cells are shown as bar graphs (at the indicated times and after subtraction of the background assessed in the control test); empty bars represent total m24+ cells, positive gray bars represent marker+ (CD154, TNF, IFN-γ, or IL-2) m24+ CD4+ T cells, whereas negative gray bars (practically not visible) are marker+m24neg CD4+ T cells. (B) Staining was obtained after 6 h without stimulation (control, top) or in the presence of CMV/HPT (middle). Numbers on density plots indicate frequencies among CD4+ T cells. m24+ CD154neg, m24+ CD154+, and m24neg CD154+ subsets were gated (middle panel: blue, red, and black frames, respectively) and further displayed as histograms according to their TNF, IFN-γ, and IL-2 expression (bottom). Numbers on histograms indicate frequencies of the respective color-coded population among CD4+ T cells (markers are shown). Gating strategy is as shown in Figure 1A.
Figure 6
Figure 6
The functional profile of HBV-specific m24+ CD4+ WB T cells. The WB from a donor who was vaccinated ~10 years ago against HBV was stimulated with HBV/Env overlapping peptides. (A) Frequencies of m24 Ab staining, CD154, and cytokine expression within CD4+ T cells are shown as bar graphs (at the indicated times and after subtraction of the background assessed in the control test); empty bars represent total m24+ cells, positive gray bars represent marker+ (CD154, TNF, IFN-γ, or IL-2) m24+ CD4+ T cells, whereas negative gray bars are marker+m24neg CD4+ T cells. (B) Staining obtained after 6 h without stimulation (control, top) or in the presence of the HBV/Env overlapping peptides (middle). Numbers on density plots indicate frequencies among CD4+ T cells. m24+ CD154neg, m24+ CD154+, and m24neg CD154+ subsets were gated (middle panel: blue, red, and black frames, respectively) and further displayed as histograms according to their TNF, IFN-γ, and IL-2 expression (bottom). Numbers on histograms indicate frequencies of the respective color-coded population among CD4+ T cells (markers are shown). Gating strategy is as shown in Figure 1A.
Figure 7
Figure 7
The functional profile of severe acute respiratory syndrome coronavirus 2 (SARS-CoV-2)-specific m24+ CD4+ WB T cells. m24 Ab staining in combination with CD154, TNF, IFN-γ, or IL-2 expression after stimulation with pools of CoV-2 membrane (M)-, nucleocapsid (N)-, and spike (S)-derived overlapping peptides for 4 h. (A) Examples of m24 Ab staining obtained from CoV-2 #3 without stimulation (control) or in the presence of the M, N, or S peptides. Numbers indicate frequencies among CD4+ T cells in %. (B) The results for marker+ m24+ CD4+ T cells obtained from SARS-CoV-2 convalescents (n = 3, CoV-2 #1 to #3) and unexposed healthy controls (n = 4, UD #1 to #4) are shown as graphs (after subtraction of background assessed in the control test). Asymptotic significance was calculated using two-tailed Mann–Whitney U-tests, *p < 0.05. Numbers indicate frequencies among CD4+ T cells in %. Gating strategy is as shown in Figure 1A.
Figure 8
Figure 8
The functional profile of SARS-CoV-2-specific m24+ CD8+ WB T cells. m24 Ab staining in combination with TNF or IFN-γ expression after 4 h of stimulation with pools of SARS-CoV-2 M-, N-, and S-derived overlapping peptides. (A) Examples of m24 Ab staining from CoV-2 #1 obtained without stimulation (control, top) or in the presence of N peptides (bottom). Numbers indicate frequencies among CD8+ T cells in %. (B) The results for marker+ m24+ CD8+ T cells obtained from SARS-CoV-2 convalescents (n = 3, CoV-2 #1 to #3) and unexposed healthy donors (n = 4, UD #1 to #4) are shown as graphs (after subtraction of background assessed in the control test). No significant difference was found using two-tailed Mann–Whitney U-tests. Numbers indicate frequencies among CD8+ T cells in %. Gating strategy is as shown in Figure 2A.
Figure 9
Figure 9
The functional profile of CMV- and SARS-CoV-2-specific CD4+ WB T cells after peptide vaccination. (A–E) m24 Ab staining in combination with CD154, TNF, IFN-γ, or IL-2 expression obtained from a donor vaccinated with one CMV and three SARS-CoV-2 major histocompatibility complex (MHC)-class II peptides without stimulation (control, A), with CMV/YQE (B), CoV-2/IGY (C), CoV-2/ASA (D), or CoV-2/FYV peptides (E) for 6 h stimulation. Numbers indicate frequencies among CD4+ T cells in %. Gating strategy is as shown in Figure 1A.
Figure 10
Figure 10
The application of the m24 Ab assay for simultaneous detection of antigen-specific CD4+ and CD8+ T cells within cryopreserved peripheral blood mononuclear cells (PBMCs). PBMCs of a preselected healthy donor were thawed and rested overnight before a 4 h stimulation with a pool of HLA-class II and HLA-A*02 peptides. (A) m24 Ab staining and CD154, TNF, IFN-γ, and IL-2 expressions for unstimulated (control) or major histocompatibility complex (MHC)-class II peptide-stimulated CD4+ T cells (mix of n = 9 virus-derived peptides). (B) The same stainings for CD8+ T cells without stimulation (control) or after stimulation with a HLA-A*02 epitope (YVLDHLIVV and EBV/YVL). Gating strategy is similar to that of Figures 1A, 2A, with Zombie Aqua included as a live/dead cell marker. See also Supplementary Figure 5A.
Figure 11
Figure 11
The scheme of experimental procedure for flow cytometry-based detection of activated CD4+ and CD8+ T cells using m24 Ab. The procedure can be performed on WB or PBMCs, either in fluorescence-activated cell sorting (FACS) tubes (WB and PBMCs) or 96-well plates (PBMCs) and is divided into five main steps: (1) antigen-specific stimulation, (2) staining of activated β2-integrins with m24 Ab, followed by EDTA treatment, (3) fixation/erythrocyte lysis of WB or fixation of PBMCs, (4) cell surface marker staining, and (5) permeabilization and intracellular staining. Additional modifications can be made for covering different specific questions as indicated in the scheme.
Figure 12
Figure 12
The polyfunctional profile of CD154+ m24+ CD4+ WB T cells for various viruses and vaccination conditions. The pie charts represent the distribution of the cytokine production patterns from the donors and antigens tested in the study after CMV peptide vaccination (n = 1), CMV infection (n = 1), CoV-2 infection (n = 3, mean is represented), CoV-2 peptide vaccination (n = 1), or HBV vaccination (n = 2, mean is represented) after 4 h (A) or 6 h (B) of stimulation with the respective peptides. Samples of the CMV infection and HBV vaccination were stimulated for 4 and 6 h for comparative purposes.

Similar articles

Cited by

References

    1. Monks CR, Freiberg BA, Kupfer H, Sciaky N, Kupfer A. Three-dimensional segregation of supramolecular activation clusters in T cells. Nature. (1998) 395:82–6. 10.1038/25764 - DOI - PubMed
    1. Fooksman DR, Vardhana S, Vasiliver-Shamis G, Liese J, Blair DA, Waite J, et al. . Functional anatomy of T cell activation and synapse formation. Annu Rev Immunol. (2010) 28:79–105. 10.1146/annurev-immunol-030409-101308 - DOI - PMC - PubMed
    1. Long EO. ICAM-1: getting a grip on leukocyte adhesion. J Immunol. (2011) 186:5021–3. 10.4049/jimmunol.1100646 - DOI - PMC - PubMed
    1. Verma NK, Kelleher D. Not just an adhesion molecule: LFA-1 contact tunes the T lymphocyte program. J Immunol. (2017) 199:1213–21. 10.4049/jimmunol.1700495 - DOI - PubMed
    1. Dimitrov S, Gouttefangeas C, Besedovsky L, Jensen ATR, Chandran PA, Rusch E, et al. . Activated integrins identify functional antigen-specific CD8(+) T cells within minutes after antigen stimulation. Proc Natl Acad Sci USA. (2018) 115:E5536–45. 10.1073/pnas.1720714115 - DOI - PMC - PubMed

MeSH terms