

Continuous growth through winter correlates with increased resting metabolic rate but does not affect daily energy budgets due to torpor use
- PMID: 33854531
- PMCID: PMC8026158
- DOI: 10.1093/cz/zoaa047
Continuous growth through winter correlates with increased resting metabolic rate but does not affect daily energy budgets due to torpor use
Abstract
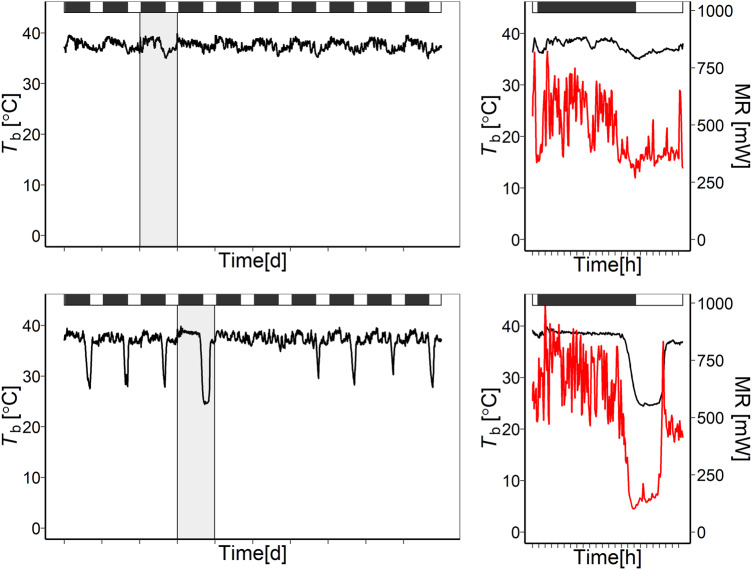
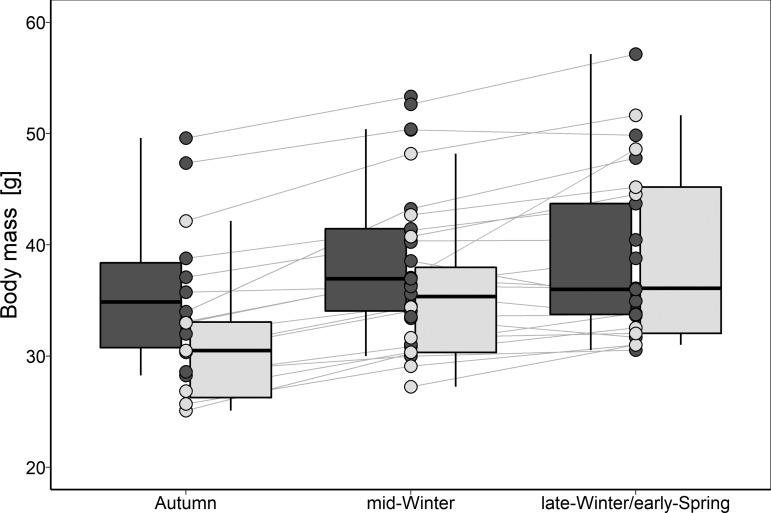
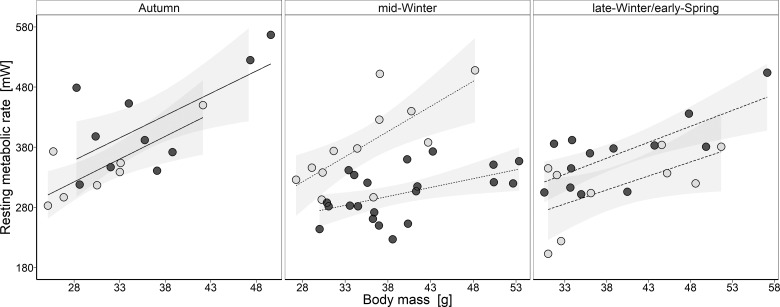
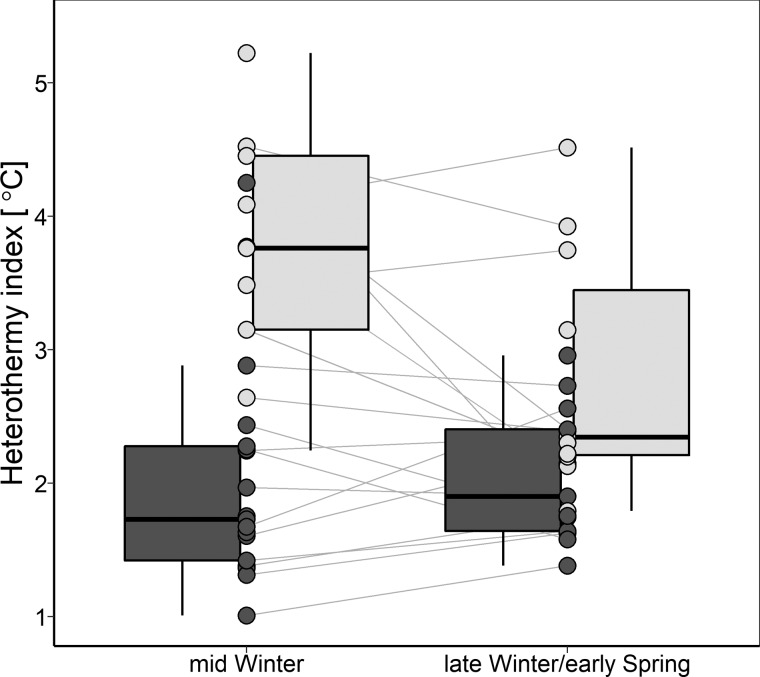
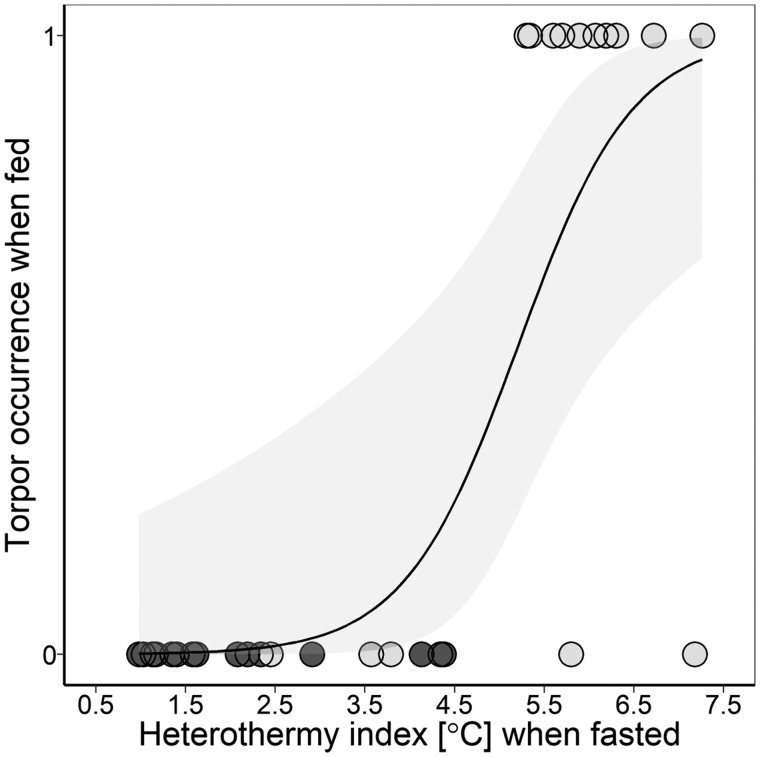
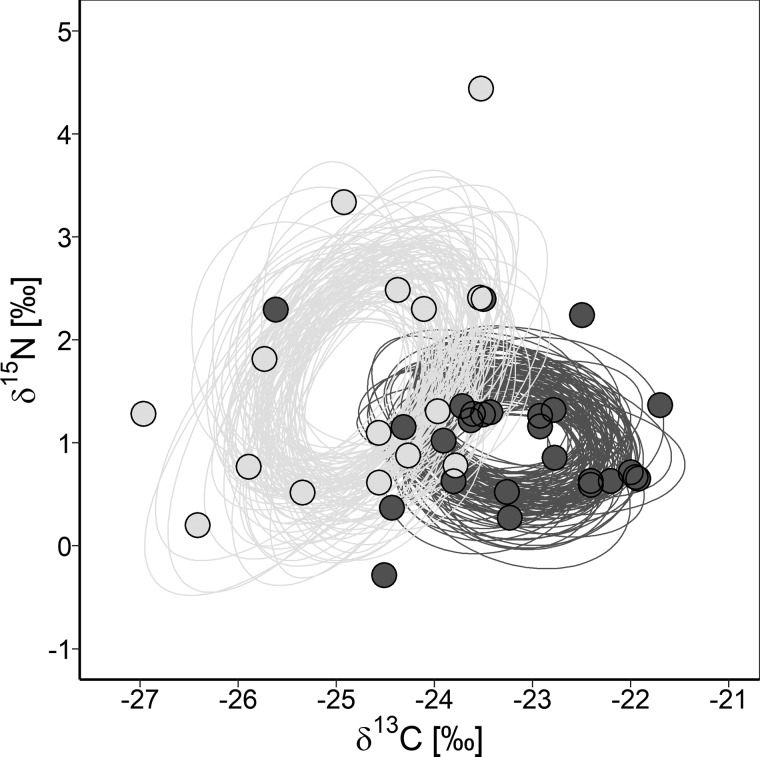
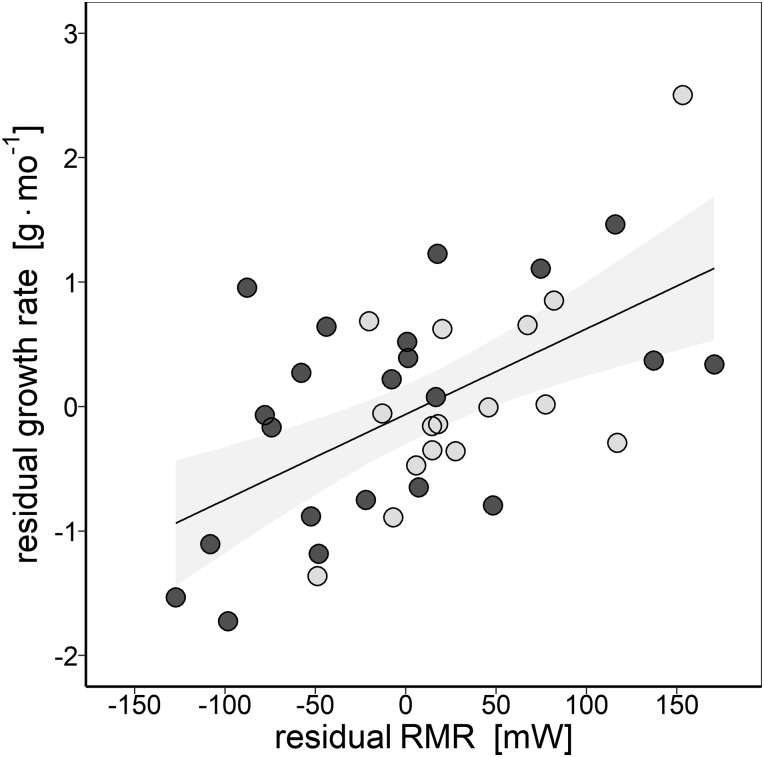
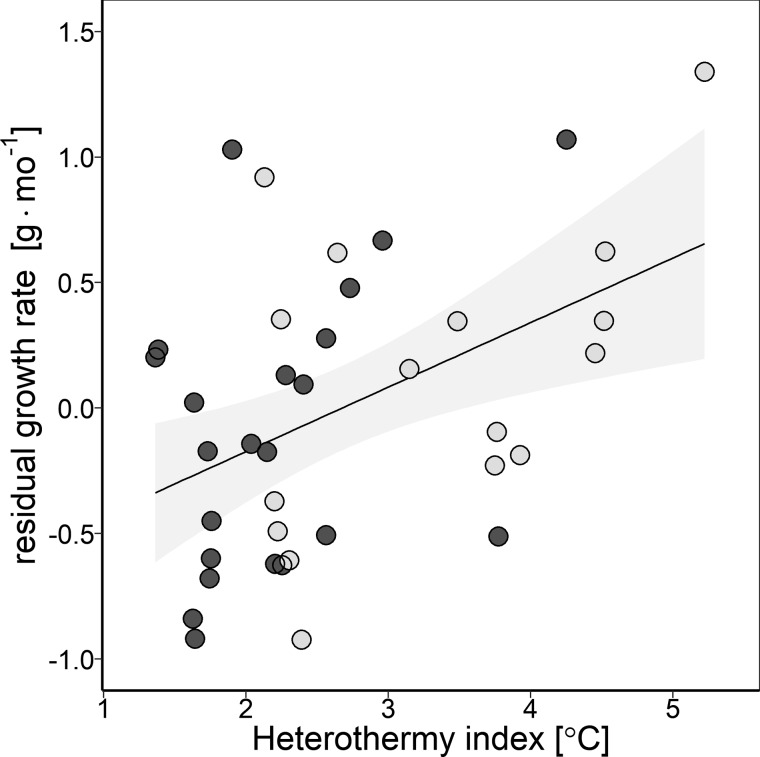
Small mammals that are specialists in homeothermic thermoregulation reduce their self-maintenance costs of normothermy to survive the winter. By contrast, heterothermic ones that are considered generalists in thermoregulation can lower energy expenditure by entering torpor. It is well known that different species vary the use of their strategies to cope with harsh winters in temperate zones; however, little is still known about the intraspecific variation within populations and the associated external and internal factors. We hypothesized that yellow-necked mice Apodemus flavicollis decrease their resting metabolic rate (RMR) from autumn to winter, and then increase it during spring. However, since the alternative for seasonal reduction of RMR could be the development of heterothermy, we also considered the use of this strategy. We measured body mass (m b), RMR, and body temperature (T b) of mice during 2 consecutive years. In the 1st year, mice decreased whole animal RMR in winter, but did not do so in the 2nd year. All mice entered torpor during the 2nd winter, whereas only a few did so during the first one. Mice showed a continuous increase of m b, which was steepest during the 2nd year. The relationship between RMR and m b varied among seasons and years most likely due to different mouse development stages. The m b gain at the individual level was correlated positively with RMR and heterothermy. This indicates that high metabolism in winter supports the growth of smaller animals, which use torpor as a compensatory mechanism. Isotope composition of mice hair suggests that in the 1st year they fed mainly on seeds, while in the 2nd, they likely consumed significant amounts of less digestible herbs. The study suggests that the use of specialist or generalist thermoregulatory strategies can differ with environmental variation and associated differences in developmental processes.
Keywords: growth rate; heterothermy; phenotypic flexibility; resting metabolic rate; torpor.
© The Author(s) (2020). Published by Oxford University Press on behalf of Editorial Office, Current Zoology.
Figures
References
-
- Aars J, Ims RA, 2002. Intrinsic and climatic determinants of population demography: the winter dynamics of tundra vole populations. Ecology 83:3449–3456.
-
- Adamczewska KA, 1959. Untersuchungen über die Variabilität der Gelbhalsmaus, Apodemus flavicollis flavicollis (Melchior, 1834). Acta Theriol 3:141–190.
-
- Adamczewska KA, 1961. Intensity of reproduction of the Apodemus flavicollis (Melchior 1834) during the period 1954-1959. Acta Theriol 5:1–21.
-
- Albuquerque RL, Sanchez G, Garland T, 2015. Relationship between Maximal Oxygen Consumption (VO2max) and Home Range Area in Mammals. Physiol Biochem Zool 88:660–667. - PubMed
-
- Angilletta MJ, Cooper BS, Schuler MS, Boyles JG, 2010. The evolution of thermal physiology in endotherms. Front Biosci 2:861–881. - PubMed
LinkOut - more resources
Full Text Sources