CD8+ T Lymphocyte Coexpression Genes Correlate with Immune Microenvironment and Overall Survival in Breast Cancer
- PMID: 33854546
- PMCID: PMC8019641
- DOI: 10.1155/2021/5533923
CD8+ T Lymphocyte Coexpression Genes Correlate with Immune Microenvironment and Overall Survival in Breast Cancer
Abstract
Purpose: To identify CD8+ T lymphocyte-related coexpressed genes that increase CD8+ T lymphocyte proportions in breast cancer and to elucidate the underlying mechanisms among relevant genes in the tumor microenvironment.
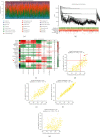
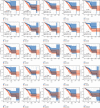
Method: We obtained breast cancer expression matrix data and patient phenotype following information from TCGA-BRCA FPKM. Tumor purity, immune score, stromal score, and estimate score were calculated using the estimate package in R. The CD8+ T lymphocyte proportions in each breast carcinoma sample were estimated using the CIBERSORT algorithm. The samples with p < 0.05 were considered to be significant and were taken into the weighted gene coexpression network analysis. Based on the CD8+ T lymphocyte proportion and tumor purity, we generated CD8+ T lymphocyte coexpression networks and selected the most CD8+ T lymphocyte-related module as our interested coexpression modules. We constructed a CD8+ T cell model based on the least absolute shrinkage and selection operator method (LASSO) regression model and robust model and evaluate the prediction ability in different subgroups.
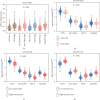
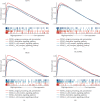
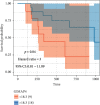
Results: A breast carcinoma CD8+ T lymphocyte proportion coexpression yellow module was determined. The coexpression genes in the yellow module were determined to increase the CD8+ T lymphocyte proportion levels in breast cancer patients. The yellow module was significantly enriched in the antigen presentation process, cellular response to interferon-gamma, and leukocyte proliferation. Subsequently, we generated CD8+ T cell-related genes lasso regression risk model and robust model, and eight genes were taken into the risk model. The risk score showed significant prognostic ability in various subgroups. Expression levels of proteins, encoded by CD74, were lower in the breast carcinoma samples than in normal tissue, suggesting expression differences at both the mRNA and the protein levels.
Conclusion: These eight CD8+ T lymphocyte proportion coexpression genes increase CD8+ T lymphocyte in breast cancer by an antigen presentation process. The mechanism might suggest new pathways to improve outcomes in patients who do not benefit from immune therapy.
Copyright © 2021 Jialing Jiang and Yi Zhao.
Conflict of interest statement
The authors declare that there are no conflicts of interest.
Figures





Similar articles
-
Identification of CD8+ T Cell-Related Genes: Correlations with Immune Phenotypes and Outcomes of Liver Cancer.J Immunol Res. 2021 Jun 2;2021:9960905. doi: 10.1155/2021/9960905. eCollection 2021. J Immunol Res. 2021. PMID: 34124275 Free PMC article.
-
Tumor Purity Coexpressed Genes Related to Immune Microenvironment and Clinical Outcomes of Lung Adenocarcinoma.J Oncol. 2021 Jun 14;2021:9548648. doi: 10.1155/2021/9548648. eCollection 2021. J Oncol. 2021. PMID: 34234827 Free PMC article.
-
9-Gene Signature Correlated With CD8+ T Cell Infiltration Activated by IFN-γ: A Biomarker of Immune Checkpoint Therapy Response in Melanoma.Front Immunol. 2021 Jun 17;12:622563. doi: 10.3389/fimmu.2021.622563. eCollection 2021. Front Immunol. 2021. PMID: 34220795 Free PMC article.
-
CD8+ T Cell Co-Expressed Genes Correlate With Clinical Phenotype and Microenvironments of Urothelial Cancer.Front Oncol. 2020 Nov 19;10:553399. doi: 10.3389/fonc.2020.553399. eCollection 2020. Front Oncol. 2020. PMID: 33330025 Free PMC article.
-
Coexpressed Genes That Promote the Infiltration of M2 Macrophages in Melanoma Can Evaluate the Prognosis and Immunotherapy Outcome.J Immunol Res. 2021 Mar 8;2021:6664791. doi: 10.1155/2021/6664791. eCollection 2021. J Immunol Res. 2021. PMID: 33748290 Free PMC article.
References
-
- Mansfield A. S., Aubry M. C., Moser J. C., et al. Temporal and spatial discordance of programmed cell death-ligand 1 expression and lymphocyte tumor infiltration between paired primary lesions and brain metastases in lung cancer. Annals of Oncology. 2016;27(10):1953–1958. doi: 10.1093/annonc/mdw289. - DOI - PMC - PubMed
LinkOut - more resources
Full Text Sources
Other Literature Sources
Research Materials

