

Metabolome-Genome-Wide Association Study (mGWAS) Reveals Novel Metabolites Associated with Future Type 2 Diabetes Risk and Susceptibility Loci in a Case-Control Study in a Chinese Prospective Cohort
- PMID: 33854788
- PMCID: PMC8025395
- DOI: 10.1002/gch2.202000088
Metabolome-Genome-Wide Association Study (mGWAS) Reveals Novel Metabolites Associated with Future Type 2 Diabetes Risk and Susceptibility Loci in a Case-Control Study in a Chinese Prospective Cohort
Abstract
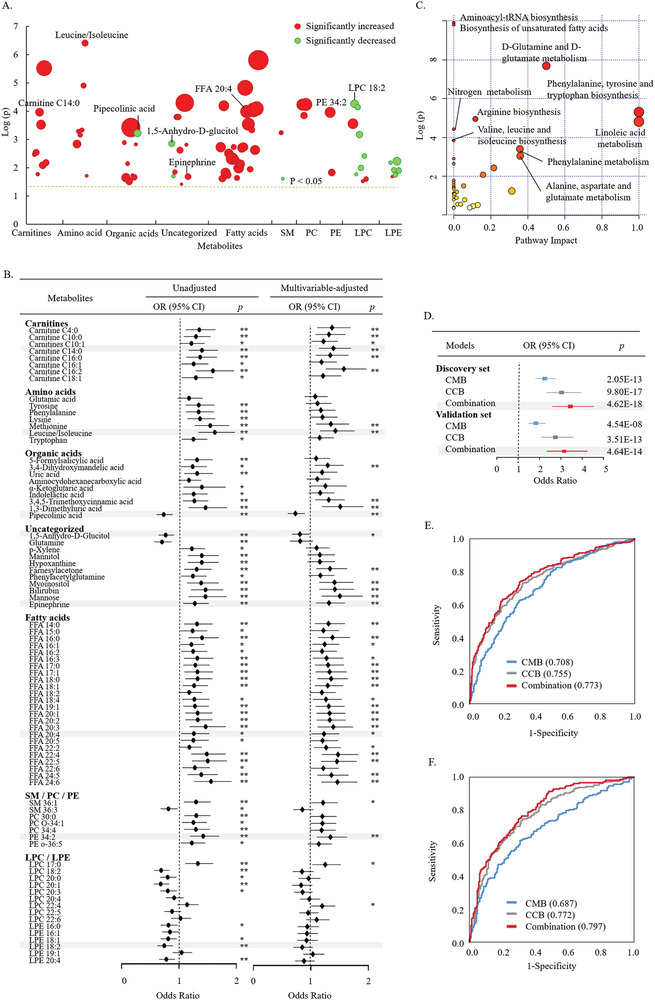
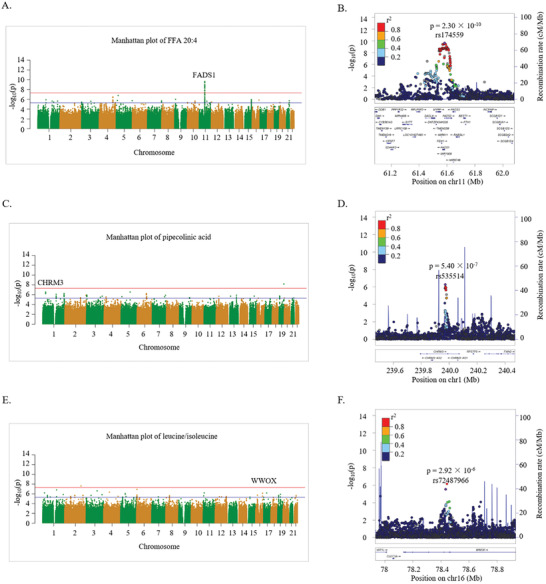
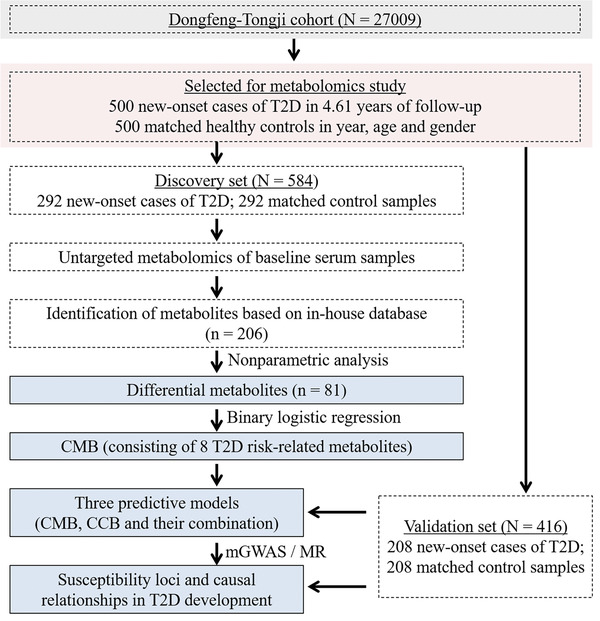
In a Chinese prospective cohort, 500 patients with new-onset type 2 diabetes (T2D) within 4.61 years and 500 matched healthy participants are selected as case and control groups, and randomized into discovery and validation sets to discover the metabolite changes before T2D onset and the related diabetogenic loci. A serum metabolomics analysis reveals that 81 metabolites changed significantly before T2D onset. Based on binary logistic regression, eight metabolites are defined as a biomarker panel for T2D prediction. Pipecolinic acid, carnitine C14:0, epinephrine and phosphatidylethanolamine 34:2 are first found associated with future T2D. The addition of the biomarker panel to the clinical markers (BMI, triglycerides, and fasting glucose) significantly improves the predictive ability in the discovery and validation sets, respectively. By associating metabolomics with genomics, a significant correlation (p < 5.0 × 10⁻⁸) between eicosatetraenoic acid and the FADS1 (rs174559) gene is observed, and suggestive correlations (p < 5.0 × 10⁻⁶) between pipecolinic acid and CHRM3 (rs535514), and leucine/isoleucine and WWOX (rs72487966) are discovered. Elevated leucine/isoleucine levels increased the risk of T2D. In conclusion, multiple metabolic dysregulations are observed to occur before T2D onset, and the new biomarker panel can help to predict T2D risk.
Keywords: genomics; mGWAS; nested case‐control study; type 2 diabetes; untargeted metabolomics.
© 2021 The Authors. Global Challenges published by Wiley‐VCH GmbH.
Conflict of interest statement
The authors declare no conflict of interest.
Figures
References
-
- Drogan D., Dunn W. B., Lin W. C., Buijsse B., Schulze M. B., Langenberg C., Brown M., Floegel A., Dietrich S., Rolandsson O., Wedge D. C., Goodacre R., Forouhi N. G., Sharp S. J., Spranger J., Wareham N. J., Boeing H., Clin. Chem. 2015, 61, 487. - PubMed
-
- Qiu G., Zheng Y., Wang H., Sun J., Ma H., Xiao Y., Li Y., Yuan Y., Yang H., Li X., Min X., Zhang C., Xu C., Jiang Y., Zhang X., He M., Yang M., Hu Z., Tang H., Shen H., Hu F. B., Pan A., Wu T., Int. J. Epidemiol. 2016, 45, 1507. - PubMed
-
- Lu J., Lam S. M., Wan Q., Shi L., Huo Y., Chen L., Tang X., Li B., Wu X., Peng K., Li M., Wang S., Xu Y., Xu M., Bi Y., Ning G., Shui G., Wang W., Diabetes Care 2019, 42, 2117. - PubMed
LinkOut - more resources
Full Text Sources
Other Literature Sources
