

Vaccinating in the Emergency Department, a Model to Overcome Influenza Vaccine Hesitancy
- PMID: 33855251
- PMCID: PMC8032353
- DOI: 10.1097/pq9.0000000000000430
Vaccinating in the Emergency Department, a Model to Overcome Influenza Vaccine Hesitancy
Abstract
Introduction: Vaccine hesitancy and delays in vaccine administration time have limited the success of prior influenza vaccination initiatives in the pediatric emergency department (ED). In 2018-2019, season 1, this ED implemented mandatory vaccine screening and offered the vaccine to all eligible patients; however, only 9% of the eligible population received the vaccine. In 2019-2020, season 2, the team sought to improve influenza vaccination rates from 9% to 15% and administer over 2,000 vaccines to eligible ED patients.
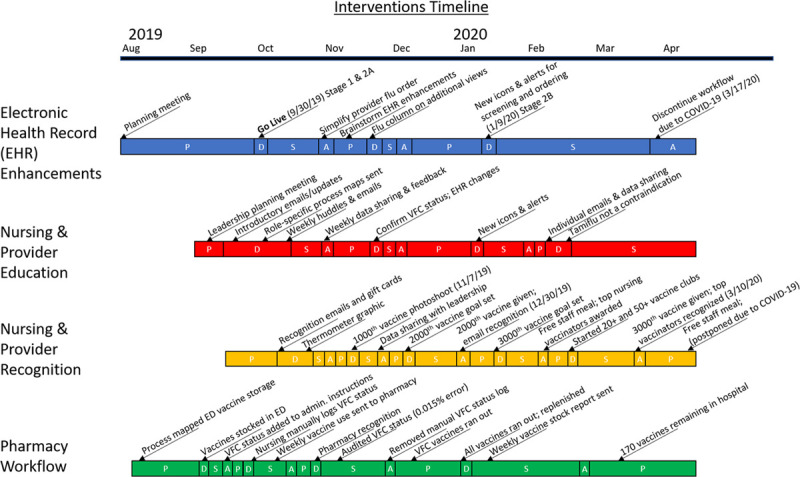
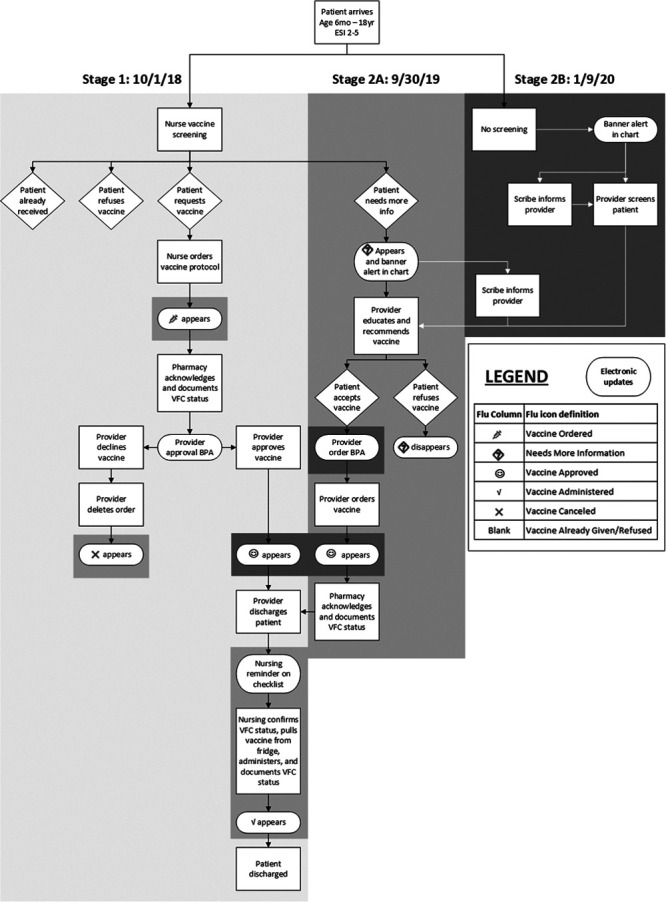
Methods: Key drivers included: identifying vaccine hesitancy, providing counseling, reducing administration delays, and developing reminders for vaccine administration. We tested interventions using plan-do-study-act cycles. We included discharged ED patients, age 6 months-18 years old, emergency severity index score 2-5, and no prior vaccine this season. Process measures included percent of patients screened, eligible, accepting the vaccine, and leaving before vaccination. Outcome measures were the percent of eligible patients vaccinated and the total number of vaccines administered. Vaccination time was the balancing measure.
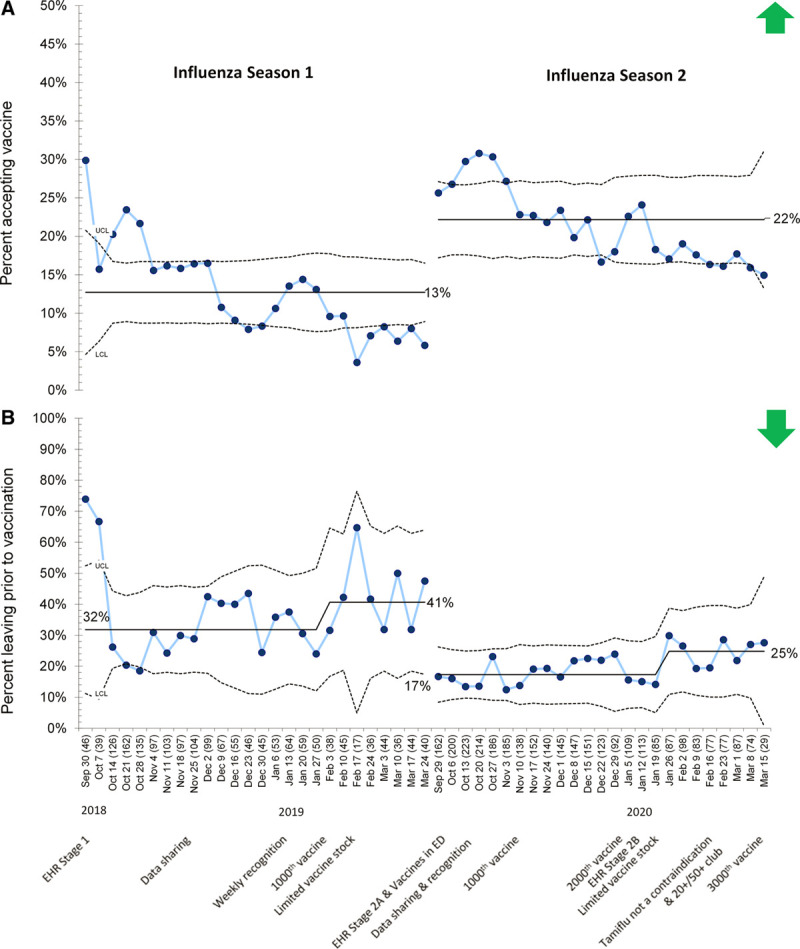
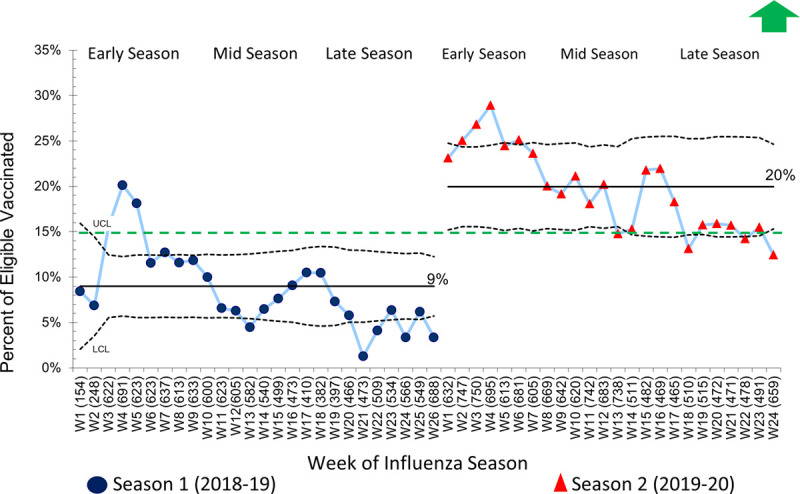
Results: We included 57,804 children in this study. Comparing season 1 to 2, screening rates (84%) and eligibility rates (58%) were similar. Vaccine acceptance rates improved from 13% to 22%, the proportion of patients leaving before vaccination decreased from 32% to 17%, and vaccination rates improved from 9% to 20%. Total vaccines administered increased from 1,309 to 3,180, and vaccination time was 5 minutes faster in season 2.
Conclusions: This ED influenza vaccination process provides a model to overcome vaccine hesitancy and can be adapted and replicated for any vaccine-preventable illness.
Copyright © 2021 the Author(s). Published by Wolters Kluwer Health, Inc.
Conflict of interest statement
Disclosure The authors have no financial interest to declare in relation to the content of this article.
Figures
Similar articles
-
Vaccinating in the Emergency Department, a Novel Approach to Improve Influenza Vaccination Rates via a Quality Improvement Initiative.Pediatr Qual Saf. 2020 Jul 8;5(4):e322. doi: 10.1097/pq9.0000000000000322. eCollection 2020 Jul-Aug. Pediatr Qual Saf. 2020. PMID: 32766495 Free PMC article.
-
Operationalizing influenza vaccination in an urban safety-net emergency department.Am J Emerg Med. 2022 Feb;52:179-183. doi: 10.1016/j.ajem.2021.12.021. Epub 2021 Dec 15. Am J Emerg Med. 2022. PMID: 34942427
-
Implementation of a Military Emergency Department Influenza Vaccination Program: Lessons from Failure.Mil Med. 2023 Aug 29;188(9-10):2844-2849. doi: 10.1093/milmed/usac225. Mil Med. 2023. PMID: 35861509 Free PMC article.
-
Influenza Vaccine Hesitancy: Scope, Influencing Factors, and Strategic Interventions.Pediatr Clin North Am. 2023 Apr;70(2):227-241. doi: 10.1016/j.pcl.2022.11.003. Pediatr Clin North Am. 2023. PMID: 36841592 Review.
-
Addressing vaccine hesitancy and resistance for COVID-19 vaccines.Int J Nurs Stud. 2022 Jul;131:104241. doi: 10.1016/j.ijnurstu.2022.104241. Epub 2022 Apr 1. Int J Nurs Stud. 2022. PMID: 35489108 Free PMC article. Review.
Cited by
-
Implementation of a COVID-19 Vaccination Program in the Emergency Department.Hosp Pharm. 2022 Oct;57(5):599-602. doi: 10.1177/00185787221095773. Epub 2022 Jun 4. Hosp Pharm. 2022. PMID: 36081542 Free PMC article. No abstract available.
-
Beyond Influenza Vaccination: Expanding Infrastructure for Hospital-based Pediatric COVID-19 Vaccine Delivery.Clin Ther. 2022 Mar;44(3):450-455. doi: 10.1016/j.clinthera.2022.01.013. Epub 2022 Jan 29. Clin Ther. 2022. PMID: 35172946 Free PMC article.
-
Self-Reported COVID-19 Vaccine Status and Barriers for Pediatric Emergency Patients and Caregivers.West J Emerg Med. 2025 Jan;26(1):96-102. doi: 10.5811/westjem.18417. West J Emerg Med. 2025. PMID: 39918148 Free PMC article.
-
Understanding Influenza and SARS-CoV-2 Vaccine Hesitancy in Racial and Ethnic Minority Caregivers.Vaccines (Basel). 2022 Nov 20;10(11):1968. doi: 10.3390/vaccines10111968. Vaccines (Basel). 2022. PMID: 36423063 Free PMC article.
-
Emergency Departments: An Underutilized Resource for Expanding COVID-19 Vaccine Coverage in Children.Vaccines (Basel). 2023 Sep 1;11(9):1445. doi: 10.3390/vaccines11091445. Vaccines (Basel). 2023. PMID: 37766122 Free PMC article.
References
-
- World Health Organization. Ten Threats to Global Health 2019. 2020. Available at: https://www.who.int/news-room/feature-stories/ten-threats-to-global-heal.... Accessed April 24, 2020.
-
- Maldonado Y, Zaoutis TE, Banerjee R, et al. . Recommendations for prevention and control of influenza in children, 2018-2019. Pediatrics. 2018; 142:1–26. - PubMed
-
- World Health Organization. Improving Vacciantion Demand and Addressing Hesitancy. Immunization, Vaccines, and Biologicals [web page]. 2020. Available at: https://www.who.int/immunization/programmes_systems/vaccine_hesitancy/en/. Accessed April 24, 2020.
-
- Hart RJ, Paul RI, Levine A, et al. . Parent intent and willingness to immunize children against influenza in the pediatric emergency department. Pediatr Emerg Care. 2019; 35:493–497. - PubMed
LinkOut - more resources
Full Text Sources
Other Literature Sources