. 2021 Mar 13;24(4):102306.
doi: 10.1016/j.isci.2021.102306. eCollection 2021 Apr 23.

Drosophila RASopathy models identify disease subtype differences and biomarkers of drug efficacy

Affiliations

Drosophila RASopathy models identify disease subtype differences and biomarkers of drug efficacy

Tirtha K Das et al. iScience. .

Abstract

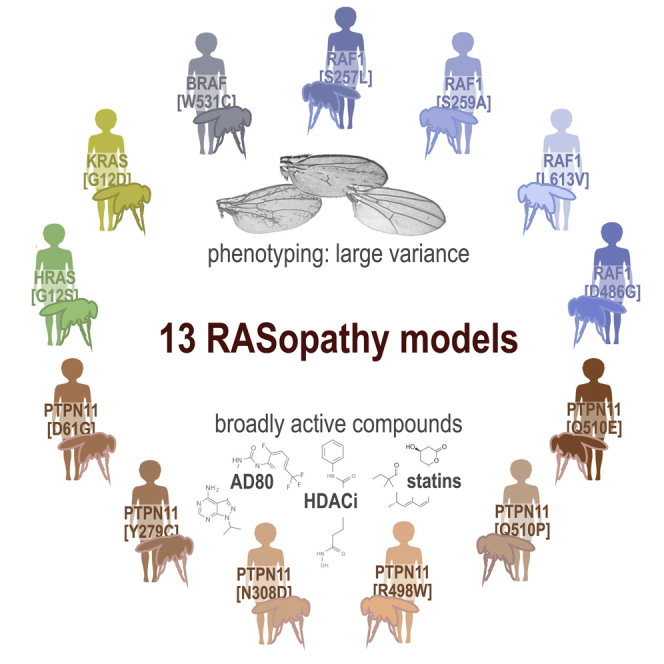
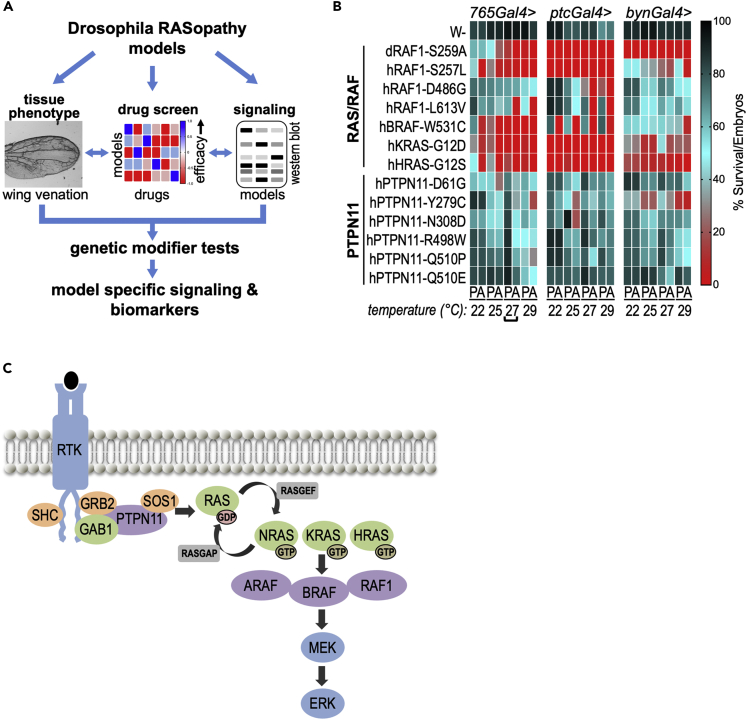
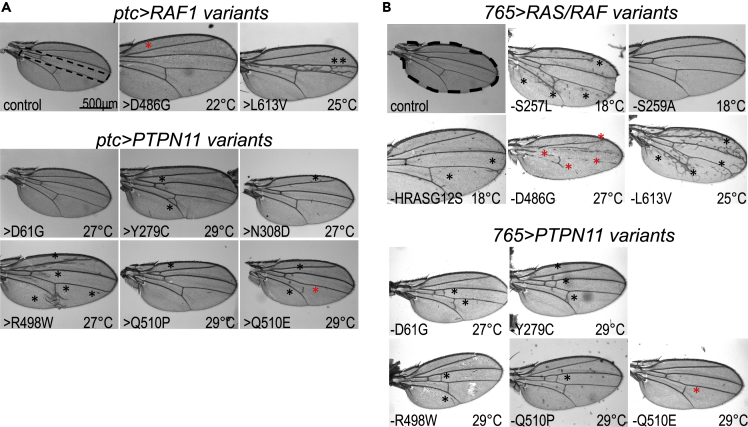
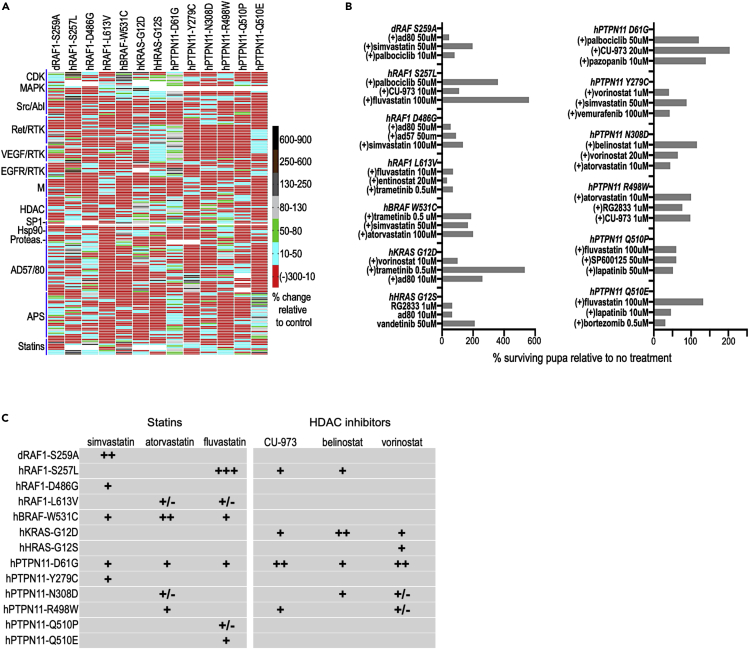
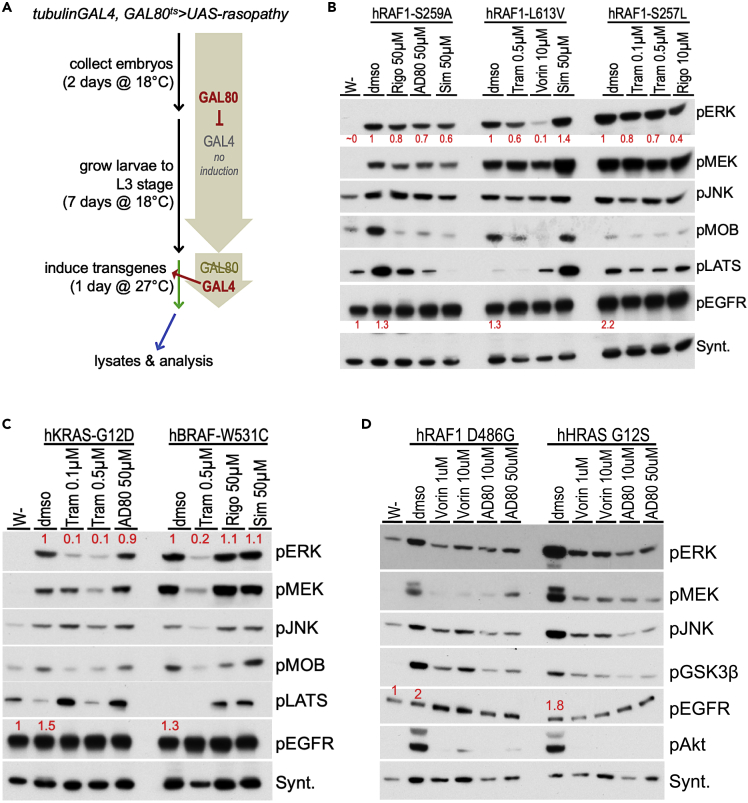
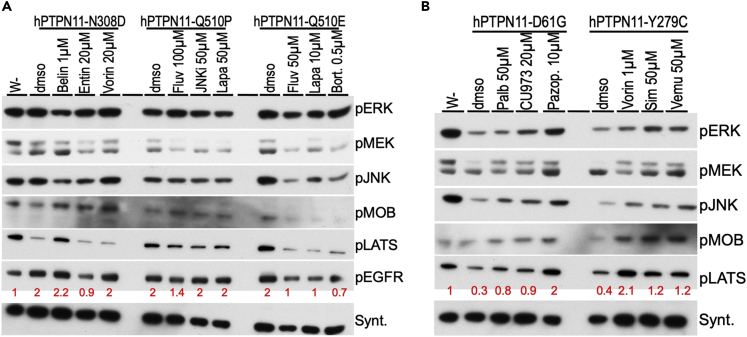
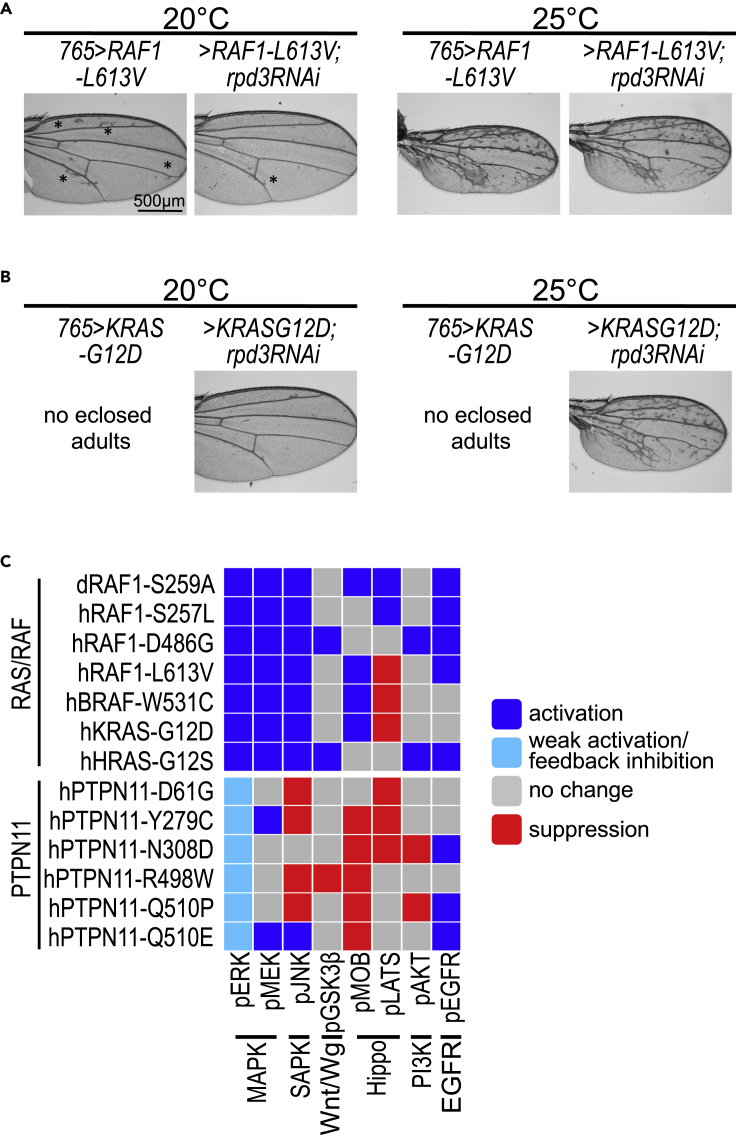
RASopathies represent a family of mostly autosomal dominant diseases that are caused by missense variants in the rat sarcoma viral oncogene/mitogen activated protein kinase (RAS/MAPK) pathway including KRAS, NRAS, BRAF, RAF1, and SHP2. These variants are associated with overlapping but distinct phenotypes that affect the heart, craniofacial, skeletal, lymphatic, and nervous systems. Here, we report an analysis of 13 Drosophila transgenic lines, each expressing a different human RASopathy isoform. Similar to their human counterparts, each Drosophila line displayed common aspects but also important differences including distinct signaling pathways such as the Hippo and SAPK/JNK signaling networks. We identified multiple classes of clinically relevant drugs-including statins and histone deacetylase inhibitors-that improved viability across most RASopathy lines; in contrast, several canonical RAS pathway inhibitors proved less broadly effective. Overall, our study compares and contrasts a large number of RASopathy-associated variants including their therapeutic responses.

Keywords: Biological Sciences; Cell Biology; Molecular Biology; Physiology.


Conflict of interest statement

B.G. declares royalties from GeneDx, Correlegan, LabCorp, and Prevention Genetics. B.G. is a named inventor on issued patents related to PTPN11, SHOC2, RAF1, and SOS1 mutations in Noonan syndrome. The Icahn School of Medicine at Mount Sinai licensed the patent to several diagnostics companies and has received royalty payments, some of which are distributed to B.G. B.G. and R.C. are principal investigators for a sponsored research agreement from Onconova.

Figures

None
Graphical abstract
Figure 1
Figure 1
Drosophila RASopathy models (A) A schematic of the approach, using Drosophila models that expressed different human RASopathy isoforms. Each isoform was induced in flies using different tissue-specific promoters and its effect on wing phenotype assessed (tissue phenotype). Flies were subjected to whole animal screening to identify optimal therapeutics for each model (drug screen). Differences in signaling among isoforms were assessed using Western blot analysis in the presence or absence of identified drug hits (signaling). For select models, pathways identified using this approach were functionally validated through genetic knockdown experiments. This integrated approach provided a broad overview of differences in signaling among isoforms and potential biomarkers of therapeutic efficacy. (B) Quantitative viability assay. GAL4 levels progressively increase with increasing temperature, which results in increased transgene expression. The result was increasing lethality, allowing identification of optimal lethality conditions. Percent viability represents the number of pupae (P) or eclosed adults (A) after 12–14 days divided by the total number of embryos originally present in each experiment and is depicted as a heatmap. Percent viability color code is shown next to the heatmap. The different GAL4 drivers tested in this assay and their primary domain of expression are 765-GAL4 (entire wing), ptc-GAL4 (several tissues including the central portion of the wing), and byn-GAL4 (hindgut). Bracket highlights the optimal screening condition (765-GAL4 at 27°C) that was used for drug screening (Figure 3). This heatmap represents approximately 32,000 screened embryos. (C) RASopathy-relevant genes define important aspects of the RAS pathway.
Figure 2
Figure 2
In vivo exploration of RAS pathway activity-wing venation (A) Bright field images of adult fly wings in which RASopathy isoforms were overexpressed using the ptc-GAL4 driver. Control wing with dotted outline indicates the region within which the ptc-GAL4 driver is active. Upper panels: RAS/RAF isoform-expressing flies exhibited ectopic wing venation within the ptc domain. Lower panels: PTPN11 isoform-expressing flies exhibited ectopic wing venation in different parts of the wing but primarily outside the ptc domain. For (A) and (B), the temperature at which the transgene was induced is indicated in each panel; the black asterisk indicates ectopic veins and the red asterisk indicates suppression of normal wing veins. Figures S2–S5 summarize these experiments showing the range of phenotypes at 18°C, 22°C, 25°C, 27°C, and 29°C. (B) Bright field images of adult fly wings in which RASopathy isoforms were induced using 765-GAL4 driver. Control wing with dotted outline showing the region where the 765-GAL4 driver is active. Upper panels: RAS/RAF isoform-expressing flies mostly exhibited ectopic wing venation; the exception was RAF1D486G, which suppressed wing vein formation (red asterisks). Lower panels: PTPN11 isoform-expressing flies exhibited ectopic wing venation in different parts of the wing. PTPN11 isoforms consistently induced a milder ectopic wing venation phenotype compared to the RAS/RAF isoforms. Bar in panel 2A represents 500 µM as indicated.
Figure 3
Figure 3
Heterogeneity in drug response by different RASopathy lines (A) Heatmap depicting response of RASopathy models to a panel of indicated drugs and tool compounds. For each model, the heatmap indicates the ratio of the number of pupae surviving following treatment compared to no treatment controls. This is represented as percent change compared to control as shown in the adjacent key. As in the previous figure, viability is assessed as the mean of four replicates for each condition. Each model exhibited a unique pattern of responses to the panel of drugs tested. The AD57/AD80 and APS family of tool compounds were developed in-house as previously published (Dar et al., 2012; Sonoshita et al., 2018). (B) Select top drug hits for each RASopathy model. Shown on the left are the RAS/RAF models and on the right the PTPN11 models. As in (A), the bars represent the ratio of the number of pupae surviving following treatment compared to no treatment controls, represented as percentage change compared to control. No treatment controls often have slightly different survival rates (as indicated by error bars in Figure S1A) and are therefore repeated for each batch of drugs tested (see Methods), providing more accurate estimates of drug rescue in different experiments. Note the unexpected rescue of RAF1D486G pupae by RAS pathway inhibitors AD80 and AD57 (see text). (C) Table showing qualitative relative response of RASopathy model flies to statins and HDAC inhibitors. These two classes of compounds showed the broadest efficacy across the thirteen models tested. No single drug showed efficacy across all models. Statins showed better efficacy in RAS/RAF models compared to PTPN11 models, while HDAC inhibitors showed the opposite.
Figure 4
Figure 4
Western pathway analyses of drug responses- RAS/RAF (A) Flowchart depicting timeline to induce expression of RASopathy isoforms in developing Drosophila larvae followed by Western blot analysis. Embryos from flies were collected in a fixed time span (collection), and larvae were allowed to develop at 18°C until L3 stage (growth). At this temperature, transgene expression was not induced: basal expression of an included temperature-sensitive GAL80-variant (GAL80ts) inhibited GAL4-dependent UAS-transgene activation. After reaching L3 stage, the larvae were shifted to 27°C, which led to destabilization of GAL80ts protein and induced expression of the RASopathy encoding transgenes (induction). After a fixed time of induction, larvae were collected and whole-body lysates extracted for Western blot analysis. (B) Western blot analysis of indicated RAF1 models. The first lane in this and subsequent panels represent lysates from w-control flies; dmso represents treatment with the solvent in the absence of drug. Drug doses represent the condition at which the drugs showed efficacy in the screens in Figure 4. All RAF1 models exhibited strong upregulation of pERK levels compared to control flies (lane 1; ~0); relative quantitation indicated below in red in this and subsequent panels. pJNK and pMEK levels were also increased by RAF1 isoforms (compare w- to dmso lanes). Hippo pathway activity markers pMOB and pLATS were differentially regulated by the RAF1 isoforms; drug treatments led to clear effects on these markers in most RAF1 lines tested. Downregulation of pMOBS and/or pLATS is predicted to promote cellular growth. (C) Western blot analysis of KRASG12D and BRAFW531C isoforms. These isoforms induced strong upregulation of pERK and pMEK levels, moderate upregulation of pJNK levels, and differential regulation of Hippo pathway markers pMOBS and pLATS (compare w- to dmso lanes). Treatment with MEK inhibitor trametinib suppressed pERK upregulation by both isoforms. Both isoforms suppressed the growth inhibitory Hippo pathway marker pLATS, while most drug treatments upregulated pLATS. (D) Western blot analysis of RAF1D486G and HRASG12S isoforms, which induced strong upregulation of pERK, pMEK, pJNK, pAKT (PI3K pathway), and pGSK3β (Wnt/Wg pathway) levels (compare w- to dmso lanes). Vorinostat and polypharmacological compound AD80 suppress levels of all these markers. pERK, pMEK, pJNK, pAKT, pMOBS, pLATS, and pGSK3β indicate phosphorylated forms of the proteins. Syntaxin, in this and subsequent panels, was used as one method of assessing loading control; see Methods for full description and Figure S6 for size markers.
Figure 5
Figure 5
Western pathway analyses of drug responses- PTPN11 (A) Western blot analysis of indicated PTPN11 models, which had a mild effect on the MAPK pathway (also see Figure S8). All three isoforms induced almost two-fold upregulation of pEGFR levels; some drug treatments suppressed this induction. These isoforms showed differential regulation of growth inhibitory Hippo pathway marker pLATS and pMOBS. Notably, PTPN11N308D lines exhibited reduced levels of these markers while drug treatments reversed that effect and upregulated one or both markers. (B) Western blot analysis of indicated PTPN11 models. These two isoforms consistently reduced levels of growth inhibitory Hippo pathway markers pLATS and pMOBS; drug treatments reversed that effect, leading to upregulation of one or both markers. See Figure S6 for size markers.
Figure 6
Figure 6
Genetic modifier experiments identify functional RASopathy pathways (A) Genetic modifier experiments with lines expressing RAF1L613V demonstrated dependency on HDAC1. RAF1L613V was expressed throughout the developing larval wing disc using the 765-GAL4 driver under different temperature conditions (also see Figures 2 and S2). In 765>RAF1L613V flies, ectopic wing venation phenotypes were observed at 20°C, which was suppressed by RNAi-mediated knockdown of fly HDAC1 ortholog Rpd3 (rpd3-RNAi). The suppression of ectopic wing venation did not occur at 25°C with stronger induction of the isoform. Black asterisks highlight examples of ectopic veins. (B) Genetic modifier experiments with KRASG12D isoform demonstrate dependency on HDAC1 activity. When 765>KRASG12D flies were raised at 20°C and 25°C, no adults eclosed. This developmental lethality was suppressed by co-expression of rpd3-RNAi; of note, the number of UAS transgenes is increased by one, which could affect expression levels. At 20°C 765>KRASG12D, rpd3-RNAi flies exhibited near-normal wing vein pattern, while at 25°C, the ectopic wing venation pattern was not suppressed, presumably due to stronger induction of the isoform. Bar in panel 6A represents 500 M as indicated. (C) Summary of the pathway activation/signaling analysis of the different RASopathy models. Overall, RAS/RAF isoforms were significantly distinct from PTPN11 isoforms in their activation of the MAPK pathway. However more broadly, each RASopathy isoform displayed a unique profile of regulation of major cellular pathways as assessed by the indicated markers.

Similar articles

Cited by

References

    1. Altmüller F., Pothula S., Annamneedi A., Nakhaei-Rad S., Montenegro-Venegas C., Pina-Fernández E., Marini C., Santos M., Schanze D., Montag D. Aberrant neuronal activity-induced signaling and gene expression in a mouse model of RASopathy. PLoS Genet. 2017;13:e1006684. - PMC - PubMed
    1. Andelfinger G., Marquis C., Raboisson M.J., Théoret Y., Waldmüller S., Wiegand G., Gelb B.D., Zenker M., Delrue M.A., Hofbeck M. Hypertrophic cardiomyopathy in noonan syndrome treated by MEK-inhibition. J. Am. Coll. Cardiol. 2019;73:2237–2239. - PMC - PubMed
    1. Araki T., Mohi M.G., Ismat F.A., Bronson R.T., Williams I.R., Kutok J.L., Yang W., Pao L.I., Gilliland D.G., Epstein J.A., Neel B.G. Mouse model of Noonan syndrome reveals cell type- and gene dosage-dependent effects of Ptpn11 mutation. Nat. Med. 2004;10:849–857. - PubMed
    1. Azad T., Nouri K., Janse van Rensburg H.J., Maritan S.M., Wu L., Hao Y., Montminy T., Yu J., Khanal P., Mulligan L.M., Yang X. A gain-of-functional screen identifies the Hippo pathway as a central mediator of receptor tyrosine kinases during tumorigenesis. Oncogene. 2020;39:334–355. - PubMed
    1. Beurel E., Grieco S.F., Jope R.S. Glycogen synthase kinase-3 (GSK3): regulation, actions, and diseases. Pharmacol. Ther. 2015;148:114–131. - PMC - PubMed